344–348
The reflection of two past outbursts of Sagittarius A⋆ observed by Chandra during the last decade
Abstract
The supermassive black hole at the Galactic center, Sagittarius A⋆, has experienced periods of higher activity in the past. The reflection of these past outbursts is observed in the molecular material surrounding the black hole but reconstructing its precise lightcurve is difficult since the distribution of the clouds along the line of sight is poorly constrained.
Using Chandra high-resolution data collected from 1999 to 2011 we studied both the 6.4 keV and the 4–8 keV emission of the region located between Sgr A⋆ and the Radio Arc, characterizing its variations down to 15′′ angular scale and 1-year time scale. The emission from the molecular clouds in the region varies significantly, showing either a 2-year peaked emission or 10-year linear variations. This is the first time that such fast variations are measured. Based on the cloud parameters, we conclude that these two behaviors are likely due to two distinct past outbursts of Sgr A⋆ during which its luminosity rose to at least 1039 erg s-1.
keywords:
reflection nebulae, X-rays: ISM, radiation mechanisms: nonthermal, Galaxy: center1 Introduction
Sagittarius A⋆ is the supermassive black hole located in the center of the Galaxy. Its X-ray luminosity is about erg s-1 at quiescence ([Baganoff et al. 2003]) but varies, showing rapid flares ([Neilsen et al. 2013]) during which its luminosity remains at least eight orders of magnitude lower than its Eddington luminosity. Nevertheless, there are strong hints that Sgr A⋆ experienced a large phase of activity in the past ([Ponti et al. 2013]) and its recent history can be reconstructed from the non-thermal emission emanating from the molecular clouds at the Galactic center. This emission is characterized by a continuum component and a strong Fe K line at 6.4 keV. The strong variability of this emission, detected in both Sgr B2 ([Inui et al. 2009, Terrier et al. 2010, Nobukawa et al. 2011]) and the Sgr A region ([Muno et al. 2007, Ponti et al. 2010, Capelli] et al. 2012, [Clavel et al. 2013]), proves that a significant fraction of the diffuse emission correlated with the molecular clouds is due to reflection. This reflected emission is created by Compton scattering and K-shell photo-ionization of neutral iron atoms produced by intense X-ray radiation such as emitted during a putative past large flare of Sgr A⋆ ([Sunyaev et al. 1993, Koyama et al. 1996, Sunyaev & Churazov 1998]). Unfortunately, reconstructing the lightcurve of Sgr A⋆ is very complex because the distribution of clouds along the line of sight is barely known. Nonetheless, the temporal behavior of the illumination is directly linked to the clouds’ position along the line of sight, so the fine X-ray variations can also be used to constrain the matter distribution and thereby to further characterize the past activity of Sgr A⋆. This is why we took advantage of Chandra’s high spatial resolution to measure the fine X-ray variations occurring in a key region located between Sgr A⋆ and the Radio Arc, hereafter called the Sgr A complex. We present here our main results concerning the temporal variations observed in this region and the constraints we derived on the past activity of Sgr A⋆. For more details, refer to [Clavel et al. 2013, Clavel et al. (2013)].
2 Temporal variations in the Sgr A complex: two time behaviors
Our analysis is based on all the Chandra observations covering the ten-arcmin-squared region centred on (l,b)=(0.06∘, 0.10∘) that have been collected between 1999 and 2011. The data have been reduced using Chandra standard analysis and we used the 4–8 keV flux of 15-arcsec-squared regions in order to characterize the variations of the Sgr A complex. This systematic analysis of the region is in perfect agreement with the 6.4 keV characterization also performed for some specific clouds in [Clavel et al. 2013, Clavel et al. (2013)] and shows that the five main molecular clouds of the region are varying with a significance of at least but with two different types of temporal behavior: the variations are either short (year) and peaked, or slower (decade) and linear (Fig. 1).
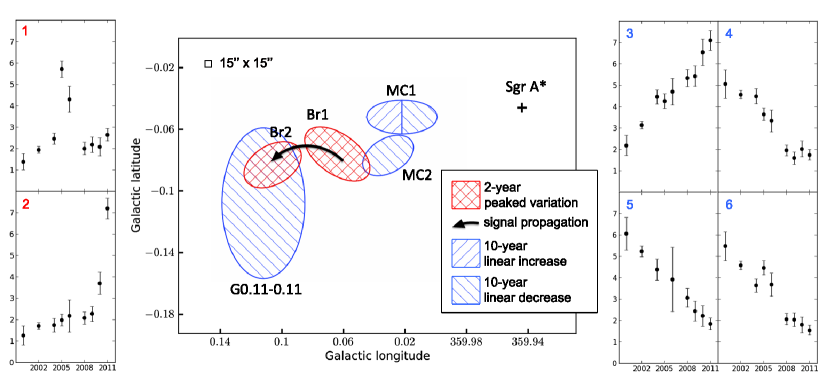
Two-year peaked variations: Br1 and Br2 have mainly been illuminated since 2008, with the illumination starting on the Galactic west of the cloud with a superluminal propagation of the echo away from Sgr A⋆ ([Ponti et al. 2010]). Our analysis confirms both the propagation along the Bridge, with the detection of a bright filament at the center of Br2 in 2011 (Fig. 1, lc 2), and a required Sgr A⋆ luminosity of at least a few times 1039 erg s-1 in order to account for the illumination. Furthermore, we report the first detection of a flux increase followed by a similar decrease in several subregions of the Br1 cloud (Fig. 1, lc 1), which forces the duration of the reflection episode to be about two years or less. Since the variation of the reflected emission cannot be faster than the illuminating event itself, this new measurement implies that the past X-ray radiation responsible for the Br1 and Br2 illumination peak lasted no more than two years.
Ten-year linear variations: the variations of the three other clouds are characterized by either a ten-year linear increase (Fig. 1, lc 3) or a ten-year linear decrease (Fig. 1, lc 4-6). In the following section we discuss whether these slower variations are compatible with the two-year upper limit for the illuminating event derived from the fastest variations.
3 Constraints on Sgr A⋆’s past activity: two past outbursts
The variations of the reflection component we observed depend on the lightcurve of the illuminating event but also on the structure of the reflecting clouds. So the two different behaviors observed could be due to either two different cloud structures or to two different illuminating flares (Fig. 2).
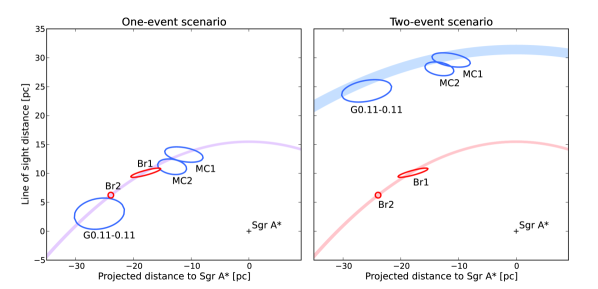
One-event scenario: to explain the variations seen in the Sgr A complex, a single-event scenario was first assumed by [Ponti et al. 2010, Ponti et al. (2010)], suggesting an event duration of a few centuries. We now have a strong upper limit of two years on the flare duration, along with more detailed lightcurves of the cloud emissions, which gives stringent constraints for this scenario. First, since the event is so short, all the illuminated clouds ought to lie along the same parabola (Fig. 2, Left). However, this would imply that a large fraction of the molecular material of the Sgr A complex is roughly at the same position along the line of sight despite its different molecular line velocities ([Jones et al. 2012]). Second, in case of a two-year event, the longer illumination seen in MC1, MC2 and G0.11-0.11 can only be explained by a larger depth of these clouds along the line of sight so that the event parabola moving away from Sgr A⋆ reached them first and illuminates them longer than the Br1 and Br2 clouds. In this case, the similarity of the decreasing trends observed in the three clouds (Fig. 1, lc 4-6) can only be attributed to similar density distributions within these clouds. Third, knowing the fluence of the reflected emission from each molecular cloud as well as the clouds’ relative positions, we can derive an estimation of their column densities. We find that the clouds displaying slower variations should have higher column densities than the Br1 and Br2 clouds. Since this is not what is deduced from the molecular line observations ([Jones et al. 2012]), the one-event scenario is excluded.
Two-event scenario: in addition to the two-year event already described, we have to introduce a second event responsible for the longer variations seen in three of the molecular clouds (Fig 2, Right). Since the slopes of the linear decrease seen in these clouds are very similar we can reasonably assume that this variation pattern is mainly dominated by the time scale of the illuminating event rather than by each cloud’s specific configuration. In this case we can set a ten-year lower limit on the duration of the second flare. We have no constraints on the relative position in time of these two events. However, the three clouds experiencing the longer event have similar brightnesses and similar column densities which means that they ought to be about at the same distance from Sgr A⋆ and only old flares (about 200 years old or more) can fulfill this criterion. Since both the position of the cloud along the line of sight and the opacity of the clouds on scales that match the X-ray data are unknown, having an estimate of the events’ luminosity is also difficult. Nevertheless, assuming reasonable parameters for the clouds we find that two past flares of Sgr A⋆ with a luminosity of a few 1039 erg s-1 and lasting for two and ten years are sufficient to explain the short and long behaviors, respectively.
4 Conclusions
Our systematic analysis of the flux variations of the Sgr A complex, divided into 15-arcsec-squared subregions, reveals significant variations in all the molecular clouds of the complex. We report two different types of behavior: on the one hand a two-year peaked variation which is the fastest variation detected so far in the diffuse X-rays from Galactic center molecular clouds, and on the other hand a ten-year linear variation. Based on these results we are able to exclude a single-event scenario and we can provide constraints on the luminosity ( few 1039 erg s-1) and duration ( and years, respectively) of the two past flares of Sgr A⋆. These new results will provide key evidence for identifying the physical processes responsible for the past changes in the luminosity of Sgr A⋆.
References
- [Baganoff et al. 2003] Baganoff, F. K., Maeda, Y., Morris, M., et al. 2003, ApJ, 591, 891
- [Capelli] Capelli, R., Warwick, R. S., Porquet, D., et al. 2012, A&A, 545, A35
- [Clavel et al. 2013] Clavel, M., Terrier, R., Goldwurm, A., et al. 2013, A&A, 558, A32
- [Greene et al. 2007] Greene, J. E. & Ho, L. C. 2007, ApJ, 667, 131
- [Inui et al. 2009] Inui, T., Koyama, K., Matsumoto, H., et al. 2009, PASJ, 61, 241
- [Jones et al. 2012] Jones, P. A., Burton, M. G., Cunningham, M. R., et al. 2012, MNRAS, 419, 2961
- [Koyama et al. 1996] Koyama, K., Maeda, Y., Sonobe, T., et al. 1996, PASJ, 48, 249
- [Muno et al. 2007] Muno, M. P., Baganoff, F. K., Brandt, W. N., et al. 2007, ApJL, 656, L69
- [Neilsen et al. 2013] Neilsen, J., Nowak, M. A., Gammie, C., et al. 2013, ApJ, 774, 42
- [Nobukawa et al. 2011] Nobukawa, M., Ryu, S. G., Tsuru, T. G., et al. 2011, ApJL, 739, L52
- [Ponti et al. 2010] Ponti, G., Terrier, R., Goldwurm, A., et al. 2010, ApJ, 714, 732
- [Ponti et al. 2013] Ponti, G., Morris, M. R., Terrier, R., et al. 2013, in Advances in Solid State Physics, Vol. 34, Cosmic Rays in Star-Forming Environments, ed. D. F. Torres & O. Reimer, 331
- [Sunyaev et al. 1993] Sunyaev, R. A., Markevitch, M. & Pavlinsky, M. 1993, ApJ, 407, 606
- [Sunyaev & Churazov 1998] Sunyaev, R. A. & Churazov, E. 1998, MNRAS, 420, 388
- [Terrier et al. 2010] Terrier, R., Ponti, G., Bélanger, G., et al. 2010, ApJ, 719, 143