Fermi-LAT Detection of Pulsed Gamma-rays Above 50 GeV
from the Vela Pulsar
Abstract
The First Fermi-LAT Catalog of Sources Above 10 GeV reported evidence of pulsed emission above 25 GeV from 12 pulsars, including the Vela pulsar, which showed evidence of pulsation at GeV energy bands. Using 62 months of Fermi-LAT data, we analyzed the gamma-ray emission from the Vela pulsar and searched for pulsed emission above 50 GeV. Having confirmed the significance of the pulsation in 30-50 GeV with the H-test (p-value ), we extracted its pulse profile using the Bayesian block algorithm and compared it with the distribution of the 5 observed photons above 50 GeV using the likelihood ratio test. Pulsation was significantly detected for photons above 50 GeV with p-value (). The detection of pulsation is significant above at GeV and above at GeV energy bands, making this the highest energy pulsation significantly detected by the LAT. We explore non-stationary outer gap scenario of the very high-energy emissions from the Vela pulsar.
1 Introduction
The mechanism of the GeV gamma-ray emissions from pulsars remains to be solved since the discovery of gamma-ray emitting pulsars (Crab and Vela) in the 1970s. In the past several years, the observations of pulsar emissions above 10 GeV by the Fermi Large Area Telescope (Fermi-LAT) and ground based Cherenkov telescopes have created a breakthrough in the understanding of the nature of GeV gamma-ray emissions from the Crab pulsar. In particular, the detection of the pulsed emission up to 400 GeV by the MAGIC collaboration (Aliu et al. 2008; Aleksic et al. 2014) and the VERITAS collaboration (2011) were unexpected by the standard curvature radiation scenario of the outer magnetospheric gap. The observed spectrum between 100 MeV and 400 GeV is better described by a broken power law than the power law with exponential cutoff in the standard curvature radiation scenario. This result suggests that the inverse-Compton scattering process produces the emissions above 10 GeV of the Crab pulsar (Aleksik et al. 2011; Aharonian et al. 2012).
In the First Fermi-LAT Catalog of Sources Above 10 GeV (1FHL, Ackermann et al., 2013), 20 pulsars were found to show pulsed emissions (p-value) in the energy range GeV, including 12 pulsars show pulsed emissions at GeV (Saz Parkinson et al., 2012). 1FHL also reported that evidence of pulsation from the Vela pulsar at GeV and two other pulsars (PSRs J0614-3329 and J1954+2836) at GeV. Recently, pulsed emission of the Vela pulsar above 30 GeV was also reported by H.E.S.S. collaboration (2014), with a mean photon energy of 40 GeV.
Given the high significance detection of the Vela pulsar in 1FHL (e.g. in 30-100 GeV), it is a good candidate for studying pulsed emission at high energy. The recent release of the reprocessed Pass 7 (P7REP) LAT data provides significant improvement over Pass 7 (P7) in the direction reconstruction of high energy photons GeV as well as improvement in energy reconstruction (Bregeon et al., 2013). For instance, the () containment angle for ’Source’ class events at GeV is reduced by from () in P7 to () in P7REP. The reduced PSF at high energy implies that the number of background photons, primarily from Vela-X in this case, inside the containment angle of the target source is also reduced, leading to an enhanced signal-to-noise at high energy.
In this paper, we report on the analysis of 62 months of Fermi-LAT data and the high significance () detection of pulsed emissions at GeV from the Vela pulsar. The detection of pulsation is significant above at GeV and above at GeV energy bands.
2 Observations and Data Analysis
In this study, we analyzed Fermi-LAT data collected for 62 months, from 2008 August 4 to 2013 October 18. The data was reduced and analyzed using the Fermi Science Tools package (v9r32p5), available from the Fermi Science Support Center 111http:// fermi.gsfc.nasa.gov/ssc/data/analysis/software/. We selected only events in the reprocessed Pass 7 ’Source’ class and used the P7REP_SOURCE_V15 IRFs. To reduce contamination from the Earth’s albedo, we excluded time intervals when the zenith angle of the ROI was greater than or the LAT’s rocking angle was greater than 52°. We calculated the pulse phases using the TEMPO2 plugin for Fermi, with the timing model of the Vela pulsar available from Fermi-LAT Multiwavelength Coordinating Group 222https://confluence.slac.stanford.edu/display/GLAMCOG/LAT+Gamma-ray +Pulsar+Timing+Models (Ray et al., 2011), which covers the entire span of the observation.
2.1 Spectral Analysis
We performed binned likelihood analyses using the gtlike tool in the region surrounding the Vela pulsar. We selected photons between 0.1 and 300 GeV within a ROI centered at the position of the Vela pulsar. We modeled the diffuse backgrounds with gll_iem_v05_rev1.fit and iso_source_v05.txt. We included 2FGL sources (Nolan et al., 2012) within of the ROI center in the model. Only the spectral parameters of sources within of the ROI center were left free, while others were fixed to the catalog values. Since the publication of 2FGL, extended emission from two nearby SNRs, Vela-Jr (Tanaka et al., 2011) and Puppis A (Hewitt et al., 2012), have been reported. The spatial and spectral models of the PWN Vela-X was also updated (Grondin et al., 2013). To model these extended sources, we first performed an off-pulse analysis for the region. We selected photons in the phase interval 0.8-1.0 (cf. Figure 3) for the off-pulse analysis as in Grondin et al. (2013).
We replaced the 7 point sources in 2FGL that were possibly associated to Vela-Jr and Puppis A (Nolan et al., 2012) with the best-fit uniform circular disk spatial templates and simple power laws reported in Tanaka et al. (2011) and Hewitt et al. (2012). For Vela-X, we replaced the uniform circular disk model in 2FGL with the best-fit uniform elliptical disk template and broken power law reported by Grondin et al. (2013). Only the flux normalization parameters were left free. The off-pulse analysis was done with the Vela pulsar removed.
The off-pulse fit results, after correcting for exposure difference, were then passed to a phase-averaged fit. The fluxes of the 3 extended sources were fixed to the exposure-corrected off-pulse values. The Vela pulsar was modeled with a power law with exponential cutoff
| (1) |
The best-fit values for the phase-averaged spectrum are , MeV and . The best fit function is over-plotted in Figure 1.
Spectral points were obtained by performing likelihood fits in individual energy bands, fitting only the normalization parameters of the Vela pulsar and point sources within , modeled as power laws, and the diffuse backgrounds. All other sources were fixed to the best-fit full band values. For the energy bands 50-100 GeV and 100-300 GeV, the normalization parameter of Vela-X was also left free. The results are shown in Figure 1. The Vela pulsar is detected in 50-100 GeV with a TS value of 9.5 (), and a photon flux of ph cm-2 s-1. In 100-300 GeV, the TS value of the Vela pulsar drops to 2.4 (), and the 95 c.l. upper limit was shown.
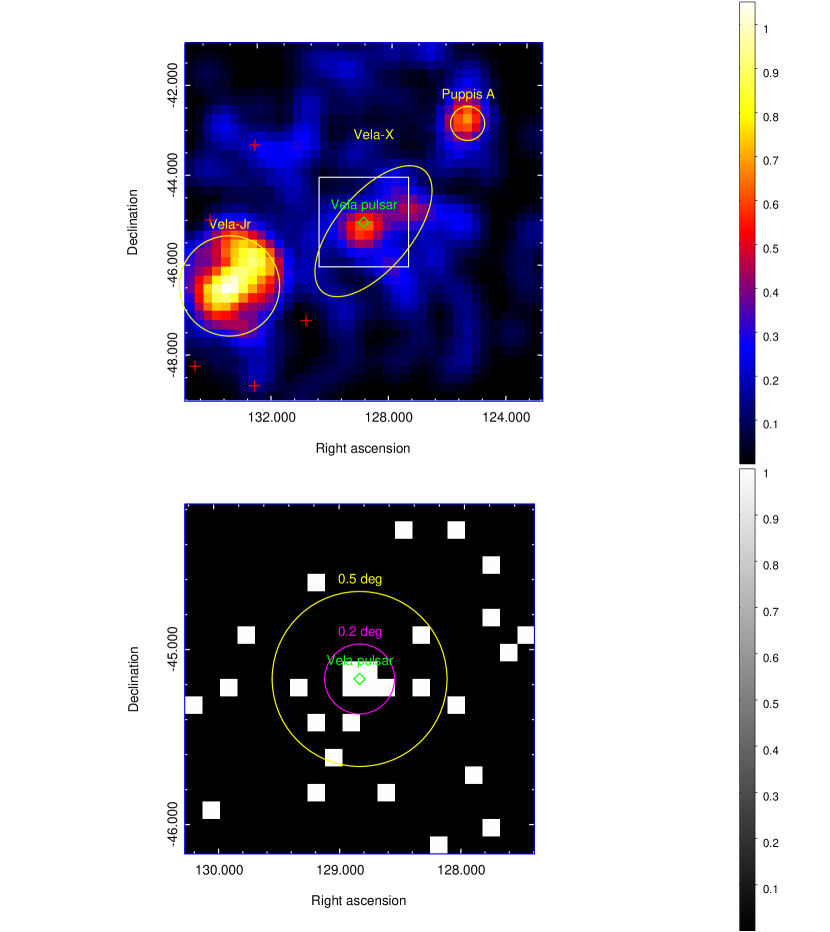
A spectral fit was performed in 50-300 GeV. The source model was the same as above, except that the Vela pulsar and Vela-X were now modeled as power laws with the normalization factors and spectral indices left free. The Vela pulsar was detected with a TS value of 11.7 (), with a photon index of and a photon flux of ph cm-2 s-1. Figure 2 (upper panel) shows the smoothed counts map above 50 GeV in a region. The emission around the position of the Vela pulsar is point-like and distinct from that of Vela-X. In contrast, the emission from Vela-Jr, with a spatial template of comparable size, is visibly extended.
2.2 Pulsation Search
2.2.1 Weighted H-test
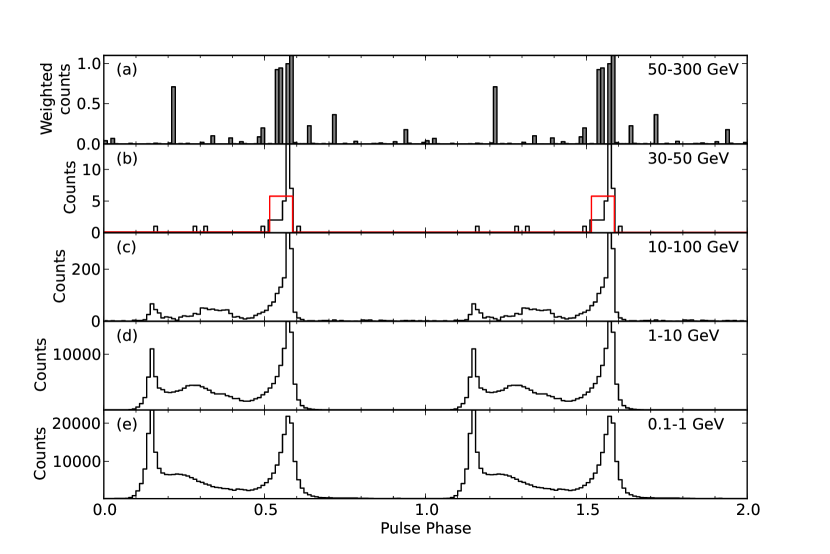
Given the significant detection of the Vela pulsar in 50-300 GeV, we performed a pulsation search in this energy range. We applied a weighted H-test (Kerr et.al., 2011) to this energy range. Each photon within from the Vela pulsar was weighted by its probability to have originated from the pulsar (), calculated using the gtsrcprob tool. We used the spectral model obtained from the spectral fit in 50-300 GeV described in Section 2.1 to calculate the probabilities. The sum of probabilities , and the weighted H-statistic is 15.4, corresponding to a p-value of or . Figure 3(a) shows the weighted light curve in 50-300 GeV. The weighted H-test for higher energy ranges returned , i.e. below .
As noted in 1FHL, the H-test (de Jager et al., 1989; Kerr et.al., 2011) is not the most sensitive tool for the pulsation search on known pulsars at high energy, as it does not utilize any prior knowledge of the pulse shape. Therefore, we apply a likelihood ratio test in our search. The test compares the distribution in pulse phase of high energy photons with a known pulse profile in lower energies, and determines whether the high energy photons are better described by the known pulse profile or a uniform distribution. For this test to be most effective, it is necessary that the lower energy pulse profile should satisfactorily reflect the expected distribution of high energy photons.
2.2.2 Selection of Low Energy Pulse Profile
As shown in previous studies (e.g. Abdo et al., 2010, 2013), the pulse profile of the Vela pulsar is strongly dependent on energy. Figure 3(c) to (e) shows the folded light curves of the Vela pulsar in 3 energy bands: 0.1-1 GeV, 1-10 GeV and 10-100 GeV. With increasing energy, P1 weakens significantly, with the peak heights ratio P1:P2 decreasing by a factor of from 0.1-1 GeV to 10-100 GeV. The bridge structure also shifts towards P2 and reduces in height. Therefore, it is expected that the photons above 50 GeV should follow a distribution more similar to that in 10-100 GeV and concentrate around P2, and it is not appropriate to apply the full energy pulse profile in the likelihood ratio test.
In order to obtain a pulse profile that better reflects the high energy behavior, we need to use an energy range high enough to reflect the expected distribution of the GeV photons, but low enough to demonstrate a statistically significant pulse profile.
We extracted the folded light curve in 30-50 GeV and performed the unweighted H-test (de Jager et al., 1989). We experimented with different aperture radii in steps of and found that a radius maximizes the H-statistic, giving (p-value ). This represents a statistically significant pulse profile to be used in the likelihood ratio test.
We then employed the Bayesian block algorithm (Scargle et al., 2013) to identify statistically significant variation features in the folded light curve in 30-50 GeV in a radius aperture, using a false positive threshold of . Since the Bayesian block algorithm assumes Poisson statistics, it can only be applied to unweighted photons. The folded light curve in 30-50 GeV is represented by a block spanning the phase interval from 0.5159 to 0.5870. Figure 3(b) shows the 30-50 GeV folded light curve overlaid with the Bayesian blocks. This block function was taken to be the low energy pulse profile in the likelihood ratio test.
2.2.3 Photon Selection Above 50 GeV
To select GeV photons for the likelihood ratio test, we calculated also the probabilities of coming from Vela-X () and the Galactic diffuse emission () for photons within from the Vela pulsar, following the procedures described in Section 2.2.1. Since the Vela pulsar is completely embedded in Vela-X as seen by the LAT, the major sources of background contamination are Vela-X and the Galactic diffuse emission. Therefore, we selected only photons with .
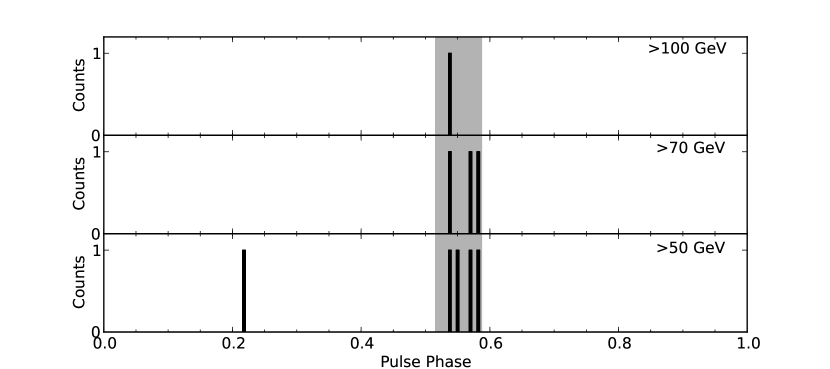
A total of 5 photons have . Figure 2 (lower panel) displays the counts map above 50 GeV. All the 5 photons are located within the circle centered at the Vela pulsar. We also note that all 5 photons fall into the highest quality ’Ultraclean’ class of events, meaning that they have the strictest rejection against cosmic ray events, which are more common at higher energies. Figure 4 shows the folded light curves in 3 energy bands: 50-300 GeV, 70-300 GeV and 100-300 GeV. The shaded area represents the phase interval spanned by the Bayesian block in 30-50 GeV. 4 of the 5 photons are located within the Bayesian block and are distributed across all 3 energy bands. The highest energy photon within the Bayesian block is at 209 GeV. Table 1 lists the energy, arrival time, angular separation from the Vela pulsar, pulse phase and source probability of the 5 photons. We note that one glitch occurred at MJD 53959.9 (Yu et al., 2013) before the start of the observation, and two other glitches were recorded during the span of the observation at MJD 55408.8 and MJD 56555.8 in the timing model. None of the selected photons was detected near a glitch epoch.
2.2.4 Likelihood Ratio Test
We performed a maximum likelihood fit to the GeV folded light curve using a probability distribution of a block function
| (2) |
where is the pulse phase, and are fixed to the edges of the Bayesian block in 30-50 GeV, and is a free parameter in [0,1]. We also performed a fit with the null hypothesis of a uniform distribution, i.e. . Using the likelihood ratio test, we obtained the test statistic, for GeV. We scanned up in energy by removing the lowest-energy photon each time and calculating the value. The values are listed in Table 1.
Since the Wilk’s theorem, which translates to p-values, assumes infinite statistics, we calculated the p-values with Monte Carlo simulations. In each Monte Carlo realization, phases, where is drawn from a Poisson distribution with the mean equal to the observed number of photons, were randomly generated in . Then the same analysis was performed to the simulated data to calculate the value. The p-values from Monte Carlo simulation agree with Wilk’s theorem, and are listed in Table 1. The significance of pulsation is above for and GeV, and above at GeV energy bands. We note that the pulsation significance for GeV is below , due to the contribution of an off-pulse photon at 55.9 GeV. We also note that, however, this particular photon has a smaller probability () to have originated from the Vela pulsar than the other four photons ().
3 Discussion
As shown in Figure 1, the observed flux above 10GeV of the Vela pulsar decreases slower than a simple exponential function. Previous emission models that invoke the curvature radiation process for the GeV emissions have in general predicted a flux at the 50-100GeV smaller than the observed flux level of . Abdo et al. (2010) proposed that a sub-exponential cut-off in the observed spectrum can be understood as the superposition of several power low plus exponential cut-off functions with varying the photon index and the cut-off energy.
In the section, we argue the model that the outer gap accelerator is switching between a number of states, and that superposition of the emissions from the different states of the outer gap make the observed spectrum of . There is a wide range of variability times scale in the radio emissions from the pulsar (e.g. Kramer et al., 2002; Lyne et al., 2010; Keane, 2013). The micro-second variations seen in single pulse could be produced by spatial fluctuation in the emission region. The pulse-to-pulse variations on the timescale of millisecond to second likely represent timescale of the temporal variation of the structure of the emission region. The longer timescale (second to year) variations associated with the model switching and nulling, which sometimes accompany the variations of the spin down rate, could be related with the changes of entire magnetosphere. The higher energy observations also found the mode switches in the X-ray emission properties of PSR B0943+10 (Hermsen et al., 2013) and in the GeV gamma-ray emission properties of PSR J2021+4026 (Allafort et al., 2013). These multi-wavelength observations suggest that the switching between a number of state of magnetosphere is probably a generic feature of the pulsars.
The active outer gap should require the external currents () that are injected into the outer gap at the boundaries, because they initiate the gamma-ray emissions and subsequent pair-creation cascade process. In our model, the outer gap structure and the properties of the curvature radiation depend on how large currents are injected into the gap. For example, the outer gap size can develop until the pair-creation process creates the gap current of order of the Goldreich-Julian value (Takata et al., 2004; Hirotani, 2006). The outer gap with a smaller external current has a larger gap size and a larger electric field, and produces harder gamma-rays. If the external current, which may be originated from the polar cap region, is temporally variable, the observed gamma-ray spectrum will be the superposition of the emissions from various gap states.
We consider that the outer gap (Cheng et al., 1986; Takata et al., 2006) produces the GeV emissions; in the model the charge depletion from the Goldreich-Julian charge density causes the electric field along the magnetic field line, which accelerates the electrons and positrons to Lorentz factor of . We assume the dipole magnetic field in the magnetosphere and solve three-dimensional structure of the gap (Takata et al. in prepare); (1) the particle acceleration process by the electric field, (2) the curvature radiation process and (3) the pair-creation process between the gamma-rays and thermal X-rays from the neutron star surface. Our 3-D model is the expansion of 2-D study developed by Takata et al. (2006; 2008; 2009), which discussed the phase-averaged spectra of the pulsars measured by the EGRET.
In our model, we assume that the observed gamma-ray spectrum are superposition of the emissions from various stationary gap structures with various external currents. The model assumes that the timescale of the variability of the external current is of order of or longer than crossing time scale of the light cylinder radius (), , with which the stationary outer gap structure for an external current is archived. Figure 1 compares the calculated spectra with the observations. In the calcualtion, we assumed the power law distribution of the external current as
| (3) |
where is the normalization factor and is determined from , and we used and . In addition, we chose the power index , which reasonably reproduces the observed spectral cut-off behavior. In Figure 1, the calculated spectrum for an external current cannot explain the observed spectral shape in 100MeV-50GeV, while the gamma-ray spectrum superposed by the different gap states explains better the observed cut-off behavior. We also find that the emissions above 20GeV can be explained by the outer gap with a very small injection current. In the subsequent paper, we will study dependency of the viewing geometry (inclination angle and viewing angle) on the predicted spectrum and will discuss how goodness of the model fitting for high-energy pulsars.
In summary, we detected pulsed gamma-ray emissions from the Vela pulsar at above at GeV and above at GeV energy bands using Fermi-LAT. This is difficult to explain using the previous stationary model in the pulsar magnetosphere. We proposed the model that the outer gap structure is switching between a number of state. Future searches for pulsed emission above 50 GeV in other pulsars will help understand the nature of the high-energy emission in the pulsar magnetosphere.
References
- Abdo et al. (2010) Abdo, A. A., et al. 2010, ApJ, 713, 154
- Abdo et al. (2013) Abdo, A. A., et al. 2013, ApJS, 208, 17
- Ackermann et al. (2013) Ackermann, M. et al. 2013, ApJS, 209, 34
- Aharonian et al. (2012) Aharonian, F.A., Bogovalov, S.V., Khangulyan, D, 2012, Nature, 482, 507
- Alelsic et al. (2014) Aleksic, J. et al. 2014, A&A Letter, 562
- Alelsic et al. (2011) Aleksic, J. et al. 2011, ApJ, 742. 43
- Allafort et al. (2013) Allafort, A. et al., 2013, ApJ Letter, 777, 2
- Magic collaboration, Aliu et al. (2008) Aliu E., et al. 2008, Sci, 322, 1221
- Becherini et al. (2008) Becherini, Y. et al. 2008, AIPC, 1085, 738
- Bregeon et al. (2013) Bregeon, J. et al. 2013, eprint arXiv:1304.5456
- Cheng et al. (1986) Cheng, K.S., Ho, C., Ruderman, M., 1986, ApJ, 300, 500
- Kramer et al. (2002) Kramer, M., Johnston, S., Van Straten, W., 2002, MNRAS, 334, 523
- de Jager et al. (1989) de Jager, O. C. et al. 1989, A&A, 221, 180
- Grondin et al. (2013) Grondin, M.-H., et al. 2013, ApJ, 744, 110
- Hermsen et al. (2013) Hermsen, W. et al., 2013, Sci, 339, 436
-
H.E.S.S. collaboration (2014)
H.E.S.S. collaboration 2014, in Astroparticle Physics 2014 -
A joint TeVPA/iDM conference,
https://www.mpi-hd.mpg.de/hfm/HESS/201406-TeVPA-Amsterdam-nofilm.pdf - Hewitt et al. (2012) Hewitt, J. W., et al. 2012, ApJ, 759, 89
- Hirotani (2006) Hirotani, K., 2006, ApJ, 652, 1475
- Keane (2013) Keane, E.F., 2013, Proceedings of the International Astronomical Union, Volume 291, pp. 295-300
- Kerr et.al. (2011) Kerr, M. 2011, ApJ, 732, 38
- Lyne et al. (2010) Lyne, A., Hobbs, G., Kramer, M., Stairs, I., Stappers, B., 2010, Sci, 329, 408
- Nolan et al. (2012) Nolan, P. L., et al. 2012, ApJS, 199, 31
- Ray et al. (2011) Ray, P. S., et al. 2011, ApJS, 194, 17
- Saz Parkinson et al. (2012) Saz Parkinson, P. M., et al. 2012, eprint arXiv:1210.7525
- Scargle et al. (2013) Scargle, J. D. Norris, J.P., Jackson, B., Chiang, J., 2013, ApJ, 764, 167
- Takata et al. (2009) Takata, J., Chang, H.-K., 2009, MNRAS, 392, 400
- Takata et al. (2008) Takata, J.. Chang, H.-K., Shibata, S., 2008, MNRAS, 386, 748
- Takata et al. (2006) Takata, J., Shibata, S., Hirotani, K., Chang, H.-K., 2006, MNRAS, 366, 1310
- Takata et al. (2004) Takata, J., Shibata, S., Hirotani, K., 2004, MNRAS, 354, 1120
- Tanaka et al. (2011) Tanaka, T. et al. ApJL, 740, L51
- timokhin (2013) Timokhin, A.N., Arons, J., 2013, MNRAS, 429, 283
- VERITAS Collaboration et al. (2011) VERITAS Collaboration et al. 2011, Science, 334, 69
- Yu et al. (2013) Yu, M., et al. 2013, MNRAS, 429, 688

| (GeV) | Time (MJD) | () | Pulse Phase | ||||
|---|---|---|---|---|---|---|---|
| 51.3 | 55050.8 | 0.074 | 0.548 | 0.940 | 16.3 | ||
| 55.9 | 56149.3 | 0.136 | 0.219 | 0.707 | 11.5 | ||
| 79.5 | 56317.2 | 0.034 | 0.581 | 0.986 | 15.9 | ||
| 91.0 | 56437.5 | 0.011 | 0.569 | 0.994 | 10.6 | ||
| 208.5 | 55154.1 | 0.092 | 0.537 | 0.922 | 5.3 |