Scaling:
Lost in the smog
The success of natural sciences lies in their great emphasis on the role of quantifiable data and their interplay with models. Data and models are both necessary for the progress of our understanding: data generate stylized facts and put constraints on models. Models on the other hand are essential to comprehend the processes at play and how the system works. If either is missing, our understanding and explanation of a phenomenon are questionable. This
issue is very general, and affects all scientific domains, including the study of cities.
Until recently, the field of urban economics essentially consisted in untested laws and theories, unjustified concepts that supersede empirical evidence Bouchaud:2008 . Without empirical validation, it is not clear what these models teach us about cities. The tide has turned in recent years, however: the availability of data is increasing in size and specificity, which has led to the discovery of new stylized facts and opened the door to a new science of cities Batty:2013 . The recent craze for scaling laws Batty:2008 ; Bettencourt:2007 ; Pumain:2004 , for instance, has been an important new step in the study of urban systems.
These laws present themselves as a power-law relationship between socioeconomic (GDP, number of patents), structural (length of roads, of cables) quantities , and the size of the population of the city:
| (1) |
where the exponent can be different from . This type of scaling relation is a signature
of various processes governing the phenomenon under study, especially when the exponent
is not what is naively expected Barenblatt:2003 . However, as more and more scaling
relationships are being reported in the literature, it becomes less and less clear what we really
learn from these empirical findings. Mechanistic insights about these scalings are usually
nonexistent, often leading to misguided interpretations.
A striking example of the fallacies which hinder the interpretation and application of scaling is given by different studies on emissions due to transportation Fragkias:2013 ; Glaeser:2010 ; Oliveira:2014 ; Rybski:2013 . The topic is particularly timely: pollution peaks occur in large cities worldwide with a seemingly increasing frequency, and are suspected to be the source of serious health problems Bernstein:2004 . Glaeser and Kahn Glaeser:2010 , Rybski et al Rybski:2013 , Fragkias et al Fragkias:2013 , and Oliveira et al Oliveira:2014 are interested in how emissions scale with the population size of cities. The question they ask is simple: Are larger cities greener—in the sense that there are fewer emissions per capita for larger cities—or smoggier? Surprisingly, these different studies reach contradictory conclusions. We identify here two main sources of error which originate in the lack of understanding of the mechanisms governing the phenomenon.
The first error concerns the estimation of the quantity of emissions due to transportation. In the absence of direct measures, Glaeser and Kahn Glaeser:2010 have chosen to use estimations of based on the total distance traveled by commuters. This is in fact incorrect, and in heavily congested urban areas the relevant quantity is the total time spent in traffic Louf:2013 . Using distance leads to a serious underestimation of emissions: the effects of congestion are indeed strongly nonlinear, and the time spent in traffic jams is not proportional to the traveled distance. As a matter of fact, commuting distance and time scale differently with population size, and the time spent commuting and emissions scale with the same exponent Louf:2014 .
The second, subtler, issue lies in the definition of the city itself, and over which
geographical area the quantities and should be aggregated. There is currently great
confusion in the literature about how cities should be defined, and scientists, let alone the
various statistical agencies in the world, have not yet reached a consensus. This is a crucial
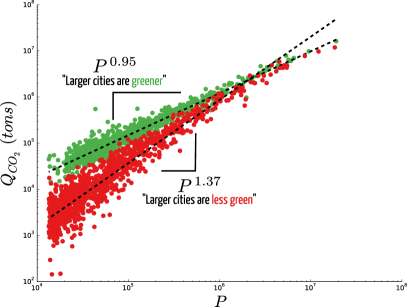
issue as scaling exponents are very sensitive to the definition of the city Arcaute:2013 . emissions are no exception: aggregating over urban areas or metropolitan
statistical areas entails radically different behaviours (see figure 1). For the US, using the
definition of urban areas provided by the Census Bureau (http://www.census.org), one finds
that emissions per capita sharply increase with population size, implying that larger
cities are less green. Using the definition of metropolitan statistical areas, also provided by
the Census Bureau, one finds that emissions per capita decrease slightly with population
size, implying that larger cities are greener.
Faced with these two opposite results, what should one conclude? Our point is that, in the absence of a convincing model that accounts for these differences and how they arise, nothing. Scaling relationships, and more generally data analysis, have an important role to play in the rising new science of cities. But, as the previous discussion illustrates, it is dangerous to interpret empirical results without any mechanistic insight. Conclusions cannot safely be drawn from data analysis alone.
From a policy point of view, now, what should one do to curb CO2 emissions? Favour the growth of large urban areas or the repartition of population in less populated cities? Both can be argued by considering data analysis alone. It should therefore be obvious that, until they have a satisfactory understanding of the mechanisms responsible for the observed behaviours, scientists should refrain from giving policy advice that might have unforeseen, disastrous consequences. If they choose to do so anyway, policy makers should be wary about what is, at best, a shot in the dark
References
- (1) Bouchaud JP (2008) “Economics needs a scientific revolution” Nature 455:1181.
- (2) Batty M (2013) The New Science of Cities (MIT Press, Cambridge, MA).
- (3) Batty M (2008) “The size, scale, and shape of cities” Science 319:769–771.
- (4) Bettencourt LMA, Lobo J, Helbing D, Kühnert C, West GB (2007) “Growth, innovation, scaling, and the pace of life in cities” Proceedings of the National Academy of Science, USA 104:7301–7306.
- (5) Pumain D (2004) “Scaling laws and urban systems”, Working Papers, Santa Fe Institute, 2004-02-002.
- (6) Barenblatt GI (2003) Scaling (Cambridge University Press, Cambridge).
- (7) Fragkias M, Lobo J, Strumsky D, Seto KC (2013) “Does size matter? Scaling of emissions and US urban areas” PloS ONE 8:e64727.
- (8) Glaeser EL, Kahn ME (2010) “The greenness of cities: carbon dioxide emissions and urban development” Journal of Urban Economics 67:404–418.
- (9) Oliveira EA, Andrade JS, Makse HA (2014) “Large cities are less green” Scientific Reports 4:4235.
- (10) Rybski D, Sterzel T, Reusser DE, Winz AL, Fichtner C, Kropp JP (2013) “Cities as nuclei of stability?” arXiv:1304.4406.
- (11) Bernstein JA, Alexis N, Barnes C, Bernstein IL, Nel A, Peden D, Diaz-Sanchez S, Tarlo M, Williams PB (2004) “Health effects of air pollution” Journal of Allergy and Clinical Immunology 114:1116–1123.
- (12) Louf R, Barthelemy M (2013) “Modeling the polycentric transition of cities” Physical Review Letters 111:198702.
- (13) Louf R, Barthelemy M (2014) “How congestion shapes cities: from mobility patterns to scaling” Scientific Reports 4:5561.
- (14) Arcaute E, Hatna E, Ferguson P, Youn H, Johansson A, Batty M (2013) “City boundaries and the universality of scaling laws” arXiv:1301.1674.