Spectroscopy and laser cooling on the line in Yb via an injection-locked diode laser at 1111.6 nm
N. Kostylev, C. R. Locke, M. E. Tobar and J.J. McFerran∗
School of Physics, University of Western Australia, 6009 Crawley, Australia
∗Corresponding author: john.mcferran@uwa.edu.au
Abstract
We generate 555.8 nm light with sub-MHz linewidth through the use of laser injection-locking of a semiconductor diode at 1111.6 nm, followed by frequency doubling in a resonant cavity. The integrity of the injection lock is investigated by studying an offset-beat signal between slave and master lasers, by performing spectroscopy on the transition in magneto-optically trapped ytterbium, and by demonstrating additional laser cooling of 171Yb with the 555.8 nm light. For the spectroscopy, we confirm the linear dependence between ground state linewidth and the intensity of an off-resonant laser, namely, that used to cool Yb atoms in a magneto-optical trap. Our results demonstrate the suitability of injection locked 1100-1130 nm laser diodes as a source for sub-MHz linewidth radiation in the yellow-green spectrum.
OCIS codes: 140.3520, 140.3515, 140.3320, 140.2020, 300.2530
PACS numbers: ; 42.62.Eh; 42.62.Fi; 07.57.-c; 42.60.-v
1 Introduction
Generating narrow linewidth laser sources in the visible spectrum is a common objective, particularly in the field of atomic and molecular spectroscopy. In this work we focus attention on low-noise light generation at 555.8 nm needed for laser cooling of ytterbium, though the scheme can be employed for wavelengths nearby; for example, those used in an iodine frequency reference [1, 2, 3] or in confocal laser scanning microscopy [4]. Laser cooling of ytterbium is becoming more prevalent as the range of atomic studies and applications increase. Optical lattice clocks based on ytterbium have achieved significant milestones [5, 6], which has led to the rapid development of Yb lattice clocks at a number of institutions [7, 8, 9, 10]. Since the early magneto-optical trapping of Yb [11], a range of cold atoms experiments have been performed including Bose-Einstein condensation [12, 13], multi-species magneto-optical trapping with Yb [14, 15, 16], photo-association spectroscopy of excited heteronuclear Yb molecules [17], and quantum degenerate mixtures involving Yb [18, 19, 20, 21]. Investigations have been carried out studying sub-radiance in lattice bound Yb2 molecules [22]. Furthermore, cold ytterbium atoms or heteronuclear Yb molecules are good candidates for studying topological phases [23, 24], searching for a permanent electric-dipole moment [25, 26], and studying quantum magnetism [27].
While methods do exist for generating low-noise 555.8 nm laser light, they are generally cost disadvantageous in comparison to diode laser systems. Furthermore, crystal waveguides, such as those based on lithium niobate, have been known to suffer degradation in conversion efficiency over months or years [28, 29]. The technique here uses a low power fibre laser at 1111.6 nm, then through optical injection of a semiconductor diode laser, the available power is increased while maintaining the low noise characteristic of the fibre laser. For efficient conversion into the green a resonant frequency doubling cavity is employed. To confirm that the narrow linewidth of the source laser is transferred to the slave laser we perform spectroscopy on the line in magneto-optically trapped ytterbium, where cooling and trapping of 172Yb is carried out using the transition. We deduce that the linewidth contribution from the 555.8 nm light is below 410 kHz. Furthermore, we show additional atomic cloud compression in a dual and magneto-optical trap of 171Yb involving the (398.9 nm) and (555.8 nm) lines, verifying the low noise properties of the green light. To our knowledge, this is the first report of the use of optical injection-locking of ridge-waveguide diode lasers for narrow-linewidth green light emission near 556 nm. A related method has been used for 578 nm yellow light generation [30], but there the master laser was an extended cavity diode laser locked to a high-finesse optical cavity and a distributed feedback laser was injection locked, making for a more complicated set-up. Single mode diode lasers in the 1100-1130 nm range still remain scarce: we demonstrate one of few, and perhaps the first, instance of where they are used in atomic spectroscopy.
2 Laser injection locking at 1111.6 nm
The generation of adequate power of 555.8 nm light is often achieved by amplifying the output of a Yb doped fibre laser with a Yb fibre amplifier and then frequency doubling in a periodically poled lithium niobate crystal or waveguide [4, 31, 32, 33]. Here we demonstrate a cost effective method that also relies on a Yb fibre laser as a master laser, but amplification is by way of injection locking a semiconductor laser followed by a resonant frequency doubling stage. The master laser is a fibre laser producing 6 mW of light with a specified linewidth of less than 60 kHz. The slave laser is a ridge waveguide semiconductor laser (Eagleyard, EYP-RWL-1120) with a central wavelength of 1110 nm and a maximum power of 50 mW. The injection locking scheme is outlined in Fig.1, where light from the fibre laser is directed into the semiconductor laser using the rejection port of an optical isolator.
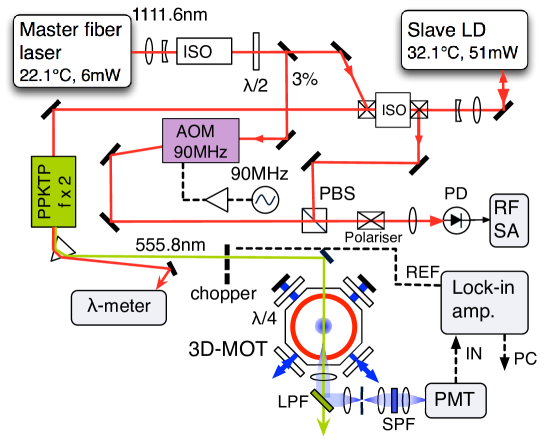
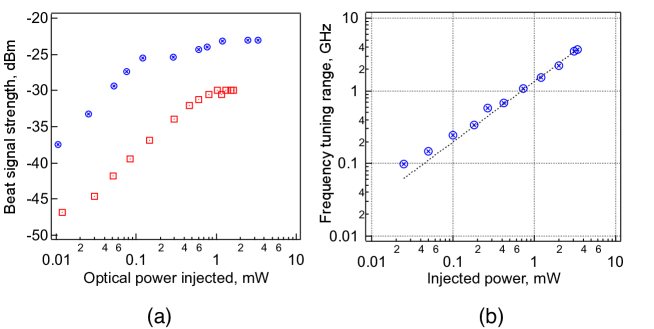
As a first means of testing the quality of the injection lock, 120 W of the master laser light is frequency shifted with an acousto-optic modulator (AOM) and heterodyned with 110 W of the slave laser light. The resultant beat signal, at 90 MHz, exhibits a signal-to-noise ratio (SNR) of 70 dB (3 kHz resolution bandwidth) when 3 mW of master laser light is coupled into the slave laser. An example of the field spectrum is shown in Fig. 2(a). The linewidth of the optical beat signal (3 kHz) is given by that of the voltage controlled oscillator driving the AOM. Its noise is not imposed on the semiconductor laser since the AOM lies outside the injection lock loop. The presence alone of the beat signal is an indication of injection locking occurring because the diode laser is not tuneable to the wavelength of 1111.6 nm (the nearest wavelength the diode laser could be tuned was 1111.53 nm after an exploration across temperature and diode current). Furthermore, a beat signal between the lasers without injection locking produces a linewidth of approximately 20 MHz that of the free running semiconductor laser (details below). The residual bumps either side of the beat signal in Fig. 2(a) may be due to a relaxation oscillation in the fibre laser, since the sideband frequency matches that at which there is a peak in the relative intensity noise of the fibre laser. At -70 dB below the carrier it is not a significant concern.

A demonstration of the change in wavelength of the slave laser under the influence of the master laser is seen in Fig. 2(b). Here the shift in frequency is 240 GHz, showing the extent of the locking range. This locking range is observed for injected light power above 150 W. Only at much higher resolution are the wavelength excursions seen; for example, as shown in the inset. The quality of the lock is discerned using the signal strength of the optical beat note. In Fig. 3(a) we show the beat signal strength versus the optical power of the injected light. The beat strength increases with a power law dependence on the injected light power until a saturation level is reached, which depends on the quality of the mode-coupling into the slave laser. In the case of optimised mode-coupling (hollow circles) the saturation power occurs at about 100 W. The lower trace (hollow squares) shows an example where the mode-coupling is not optimised, but the power law dependence is more evident. Another power law dependence is seen between the frequency tuning range of the slave laser and the injected light power, , as shown in Fig 3(b). While the locking range versus power is often used to characterise injection locking [34], here we consider the tuning range where the tuning is performed by adjusting a piezo element in the master laser, and the range is that where the SNR of the offset-beat remains above 40 dB (res. bandwidth =10 kHz). There is a sharp rise in amplitude noise at the extents of the tuning range, making for a clear demarcation. We note that the power law does not exhibit the square-root dependence sometimes seen for the locking range versus power, but rather a dependence.
The linewidth of the free running semiconductor laser was estimated by generating an optical beat signal between the fibre laser and the free running diode laser, without the injection locking. Adjustments were made to the slave laser diode temperature and current, and to the fibre laser temperature to tune the frequencies sufficiently close to one another for heterodyne detection on a photo-detector. In this case the wavelength was 1111.46 nm. The optical beat exhibited a linewidth of 18 MHz, where we can safely assume that the majority of the noise is due to the diode laser. Were this light to be frequency doubled to 555.8 nm, the corresponding linewidth would be approximately 70 MHz. This may be compared with the much narrower spectra obtained below.
In demonstrating the versatility of the 1110 nm diode lasers, a second semiconductor laser chip was placed in an extended cavity with a diffraction grating (1200 grooves mm-1) acting as the frequency selecting element. This laser was heterodyned separately with the master fibre laser producing an optical beat note with a linewidth of 600 kHz (sweep time of 20 ms). The ratio of lengths between the extended cavity diode laser and the free running diode was 42, while the ratio of linewidths is 30, suggesting that the finesse is slightly higher for the diode than the extended cavity.
3 Spectroscopy of the line in laser cooled Yb
An unequivocal way of determining the resultant linewidth of the injection locked laser is to set up two independent master-plus-slave laser systems and produce a heterodyne beat. Without access to a second fibre laser we have chosen to perform spectroscopy on cold ytterbium atoms to verify the noise properties of the slave laser. Here we use 172Yb atoms confined in a magneto-optical trap (MOT) that makes use of the 398.9 nm transition. The temperature of the 172Yb atoms (composite bosons) in the MOT has previously been shown to be approximately 1.1 mK [35]. The corresponding Doppler width, based on the expression , is 1.0 MHz when probing the atoms with 555.8 nm light. Here, is the frequency, is the Boltzmann constant, is temperature and is the mass of 172Yb. The spectroscopy is performed while the MOT fields are held constant and therefore the is influenced by ground-state broadening from the cooling light (sometimes referred to as Rabi broadening [36]). We choose 172Yb due to the simpler energy level structure compared to the fermonic isotopes. No dc magnetic field is applied to split the levels as the magneto-optical trap ensures that the -field is at (or close to) zero field at the location of the atoms (we safely state this because the side-lobes observed in the work of Loftus et. al. [37] are mostly unobservable, or unresolvable). However, the linear polarisation of the 555.8 nm light is set parallel to that of the -field of the Zeeman slower to minimise any influence from the Zeeman slower. Incidentally, with the 555.8 nm light polarised orthogonally to the Zeeman slower -field we observe splitting of the sub-states and so can verify the -field strength of the Zeeman slower.
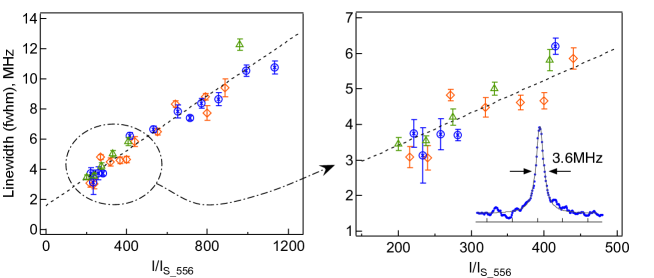
The slave laser light is frequency doubled using a periodically poled potassium titanyl phosphate (PPKTP) crystal producing 3.5 W of 555.8 nm light with 36 mW of fundamental light incident. The poling period is 10.275m (Raicol Crystals specification) and the crystal temperature for optimum frequency doubling is 55.7∘C (the FWHM temperature bandwidth is 3.5∘C). The 555.8 nm probe beam, with 2.4 W of optical power sent to the MOT chamber, is modulated with a chopper wheel rotating at 379 Hz. The probe creates a depletion in the ground state and a corresponding modulation is produced in the 398.9 nm fluorescence of the cold atoms. The fluorescence is detected with a photomultiplier cell (Hamamatsu 10492-001, 1 V/A, bandwidth of 20 kHz) and the modulation is down-converted with a lock-in amplifier that is referenced to the chopper wheel frequency. A short-wavelength pass filter with an optical density of 6.0 at 556 nm prevents any stray green light reaching the PMT. The 398.9 nm light was intensity stabilised via an amplitude modulation servo that uses the same AOM that controls the violet light’s frequency detuning. The technique differs from previous spectroscopy in a ytterbium MOT, where 556 nm fluorescence was detected and the measurements were recorded at DC [37, 36]. An example of the spectra obtained here is shown in the inset of Fig. 4, in this case, with a MOT light field intensity of 390 W m-2. The frequency scale is determined with the aid of a wavemeter that continually records the wavelength of the 1111.6 nm light (and the frequency doubling is taken into account). A piezo element in the fibre laser permits scanning of the laser frequency. The time taken to sweep across the FWHM of the resonance is 4 s and the maximum drift rate of the master laser is 2.1 kHz s-1 (4.2 kHz s-1 at 556 nm), therefore the drift does not strongly influence the spectral width of the lines. Any influence is reduced by scanning in alternate directions across the transition and calculating a mean FWHM. The dependence of the spectral-width of the line as a function of the optical intensity in the MOT is shown in Fig. 4. The intensity is normalised by the saturation intensity of the transition; i.e., W m-2. The different markers represent data recorded on separate days. Each data point is the weighted mean of between three and five measurements, where each measurement is the mean FWHM of typically four line scans. The Zeeman slower beam intensity was reduced to 120 for these measurements; however, the linewidth was found to be independent of the Zeeman beam intensity, so is not included in the intensity values of Fig. 4. There is a clear reduction in linewidth as the intensity is reduced. The relationship often used to describe intensity broadening is , where is the natural linewidth, or more generally, the homogenous linewidth in the absence of light [38, 39]. However, here the experiment is arranged such that only the ground state of the transition is affected by strong intensity perturbations. The 556 nm light intensity was 0.012 , so its contribution to line-broadening is negligible. Line broadening of the ground state is characterised by a linear dependence on intensity [40, 36]. Along with the natural linewidth there are also other contributions to the zero-intensity linewidth; for example, the inhomogeneous broadening from the residual velocity of the cold atoms (), and noise from the 555.8 nm light (). Incorporating these into the expression for spectral-width we have: , where characterises the slope. The dashed line of Fig. 4 shows the weighted line fit, producing an ordinate intercept of MHz (all the data are used to produce the fit). The product-moment correlation coefficient (Pearson’s coefficient) is 0.89, supporting the linear relationship between the linewidth and the intensity. Subtracting linewidth contributions due to Doppler broadening ( MHz) and the natural linewidth ( kHz), leaves a contribution from the 555.8 nm light of kHz. The 1111.2 nm fibre laser has a linewidth specification of 60 kHz; therefore the linewidth at 555.8 nm should be about 240 kHz (making the tenable assumption that the laser noise is dominated by white frequency noise). Our measurement is reasonably consistent with this estimate. In fact, it should be treated as an upper bound on the laser’s linewidth since residual splitting may to contribute to the linewidth if the atom cloud is offset from the MOT centre (and this is more likely to occur when the MOT light fields are weak). We note that the temperature of the Yb atoms increases with the cooling laser intensity; therefore, the Doppler broadening contribution to the linewidth will also increase. However, here the corresponding maximum linewidth (at 1200 ) is only 1.6 MHz based on Doppler cooling theory (at a frequency detuning equal to 1.5 times the linewidth of the transition). Thus, the contribution to the linewidths in Fig. 4 from this effect is small (and, moreover, has a dependence). Although we did not detect it, one may expect some ground state-broadening from the Zeeman slower beam, which would also lead to an overestimate of the laser linewidth (the slowing beam frequency detuning is -7 from the centre of the transition, but this should not prevent it from perturbing the state). Reduced uncertainty on the zero-intensity spectral-width would be achieved if the 398.9 nm laser cooling light could be reduced further. However, below 200 (300 W m-2 or 0.5 ) there is insufficient cooling intensity to trap adequate numbers of atoms in the MOT for line detection.
Another test regarding the injection locking is to reduce the power of the light injected into the slave laser diode and observe if there is an influence on the width of the spectral line when probing the cold atoms. We found that there was no noticeable change in the spectral width versus injected power and that only the strength of the spectroscopic signal weakens as the injected power is reduced. The control bandwidth of the injection locking is therefore well beyond the range of several MHz as one might expect [42]. The change in strength of the signal with injected power implies that the fraction of slave laser light that is coherent with the master laser also changes with injected power. Below a threshold of about 1 mW, the fraction of slave laser light that is coherent with the master laser light reduces with a logarithmic dependence: in our case with a slope of dBm-1.
4 Magneto-optical trapping with 555.8 nm light
To enhance the level of 555.8 nm light the PPKTP crystal has been placed in a resonant frequency doubling cavity [43]. The cavity is designed to generate a 35 m waist at the crystal location in both vertical and horizontal planes. The radius of curvature of the folding mirrors is 75 mm and full length of the cavity is 568 mm. The cavity resonances further demonstrate the effectiveness of the injection locking, since clear Lorenztian lineshapes are resolved by the cavity. Without injection locking the resonances are heavily obscured. The cavity is readily locked to the centre of resonance with the frequency modulation method (=33 kHz). We confer a 4.5 kHz servo bandwidth between the second-harmonic generating cavity and the 1111.8 nm light (which may be restricted by the phase roll-off produced by the lock-in amplifier used to generate the error signal).
The beam profile of the diode laser light is set with two pairs of cylindrical lenses for improved coupling into a single mode optical fibre. The fibre spatially filters the light to aid with the mode-matching into the frequency doubling cavity, and transports the light to the magneto-optical trap table. There is 52 % of the light coupled through the fibre, making available 24 mW for the resonant cavity. The spherical-Gaussian beam profile out of the fibre helps to achieve 98.5 % mode matching into the TEM00 mode of the second-harmonic generating cavity. By observing the reflection from the input coupler, the fraction of the 1112 nm light coupled into the cavity is, at most, 58 %. We see improved coupling as the incident power increases. It follows that the impedance matching is improving as the nonlinear conversion increases. The optimum reflectivity of the input coupler can be approximated using , where is the circulating power, is the single pass nonlinear conversion efficiency (0.026 W-1) [44], and represents other losses of fundamental power in the cavity excluding that at the input coupler [45, 44]. It is evident in our case that is very low because the finesse of the cavity corresponds closely to the losses produced by the transmission of the input coupler (). Making up the difference we find . The power enhancement is about 28; hence, for an input power of 25 mW the optimum input coupler reflectivity is 0.96 (the power enhancement varies by 14 % over ). Should diode lasers at 1110 nm become available with higher power the impedance matching condition will be better met. Alternatively, if an input coupler with R=0.96 is used an increase of about 30 % in the level of 555.8 nm light may be obtained. We can readily produce 8 mW of 555.8 nm light when half of this light is incident upon the atoms in the MOT, the atoms are completely ejected from the trap. Moreover, for a beam with an radius of 5 mm, a power level of 8 mW corresponds to an intensity 150 times the saturation intensity of the transition.
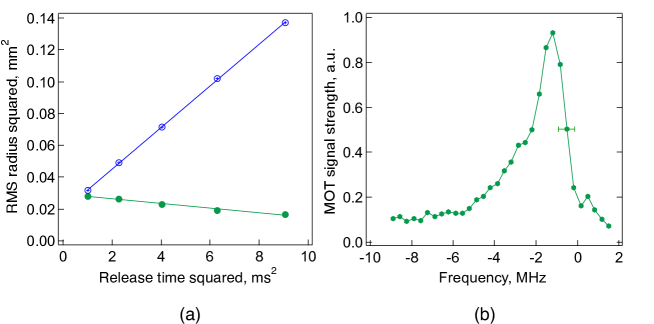
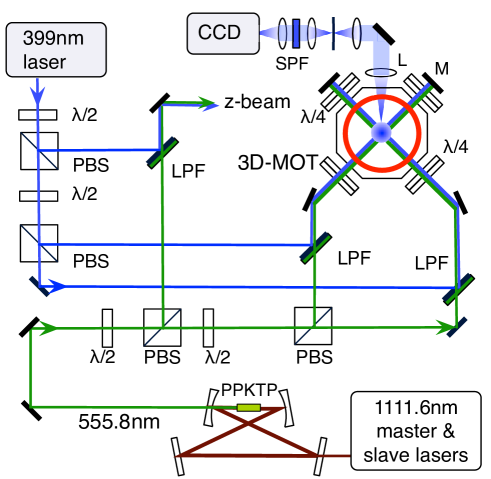
To confirm the narrow linewidth of the 555.8 nm light, we have tested its suitability for laser cooling of Yb, where we have implemented a dual stage magneto-optical trap using dichroic filters to combine the 398.9 nm and 555.8 nm beams, and achromatic quarter wave plates for the polarisation control. The arrangement is outlined in Fig. 5. The overlapping beam paths at the two wavelengths produces a compact configuration and eases the alignment process for the 555.8 nm light. The photo-multiplier tube of Fig. 1 is now replaced with a CCD camera to image the cloud of atoms. In Fig. 6(a) we show two traces: in the upper trace the root-mean-squared (rms) cloud size is measured against the free expansion time of the 171Yb atoms (both the 398.9 nm light and magnetic gradient are turned off for the free expansion). In the lower trace the same occurs, but with the 555.8 nm beams passing through the MOT and red-detuned from the centre of the resonance (by approximately one linewidth). We see that the green light further compresses the cloud of atoms, indicating further cooling. This supports earlier results that the injection locking process is preserving the narrow linewidth of the fibre laser.
As a final demonstration we show, in Fig. 6(b), the enhancement of the cold atoms’ fluorescence when the 555.8 nm is tuned close to the transition. While the relative frequency scale is well calibrated, the absolute frequency with respect to the line-centre is not, but it is coarsely estimated from the known characteristics of laser cooling. The fluorescence is recorded 2 ms after both the 398.9 nm light and magnetic gradient are turned off. The cycle time and therefore time taken between data points is 1 s, and the plot was produced by averaging over six scans. The asymmetric line shape is characteristic of spectra obtained with magneto-optical traps the sharp roll-off near resonance reflecting the sudden transition from trapping to dispersing atoms. The linewidth of approximately 1.6 MHz is enhanced by the broadening produced by an intensity of 190 . The effectiveness of the 555.8 nm radiation is evident.
5 Conclusions
We have demonstrated a scheme of generating low-noise 555.8 nm light suitable for Yb laser cooling that uses injection locking of a semiconductor laser at 1111.6 nm. A low power fibre laser injection locks a 50 mW diode laser, after which second harmonic generation in a resonant cavity is carried out. It avoids the use of high-power fibre amplifiers and crystal waveguides, both of which are costly and the latter can suffer degradation in conversion efficiency over the long term [28]. The technique should make experiments with laser cooled Yb more accessible. We performed spectroscopy on the line in 172Yb with 0.01 of 555.8 nm light and showed a linear dependence between the ground state linewidth and intensity of the trapping light. Interpolating to zero intensity we infer that the linewidth of the 555.8 nm light is less than 410 kHz. As further confirmation of the 555.8 nm light properties, we have shown additional laser cooling of 171Yb atoms in a dual 398.9 nm555.8 nm magneto-optical trap, hence indicating the suitability of injection locked 1100-1130 nm laser diodes as a source for sub-MHz linewidth radiation in the yellow-green spectrum.
Acknowledgement
This work was supported by the Australian Research Council (LE110100054). J.M. is supported through an ARC Future Fellowship (FT110100392) and N.K. through a Prescott Postgraduate Scholarship, UWA. We are gracious to Gary Light and Steve Osborne of the UWA Physics workshop for their technical expertise. We thank members of the ARC Centre of Excellence for Engineered Quantum Systems for their assistance, and S. Parker and E. Ivanov for the use of equipment.
References
- [1] F.-L. Hong, J. Ishikawa, K. Sugiyama, A. Onae, H. Matsumoto, J. Ye, and J. Hall, “Comparison of independent optical frequency measurements using a portable iodine-stabilized Nd:YAG laser,” IEEE Trans. Instrum. Meas. 52, 240 – 244 (2003).
- [2] H.-C. Chui, S.-Y. Shaw, M.-S. Ko, Y.-W. Liu, J.-T. Shy, T. Lin, W.-Y. Cheng, R. Roussev, and M. Fejer, “Iodine stabilization of a diode laser in the optical communication band,” Opt. Lett. 30, 646 (2005).
- [3] A. Yamaguchi, S. Uetake, and Y. Takahashi, “A diode laser system for spectroscopy of the ultranarrow transition in ytterbium atoms,” Appl. Phys. B 91, 57 – 60 (2008).
- [4] H. Matsuura and T. Takagi, “Development of a low-noise yellow-green laser using a Yb-doped double-clad fiber laser and a periodically poled LiNbO3 waveguide crystal,” Jpn. J. Appl. Phys. 50, 032701 (2011).
- [5] N. Hinkley, J. A. Sherman, N. B. Phillips, M. Schioppo, N. D. Lemke, K. Beloy, M. Pizzocaro, C. W. Oates, and A. D. Ludlow, “An atomic clock with instability,” Science 341, 1215–1218 (2013).
- [6] N. D. Lemke, A. D. Ludlow, Z. W. Barber, T. M. Fortier, S. A. Diddams, Y. Jiang, S. R. Jefferts, T. P. Heavner, T. E. Parker, and C. W. Oates, “Spin- optical lattice clock,” Phys. Rev. Lett. 103, 063001 (2009).
- [7] M. Yasuda, H. Inaba, T. Kohnot, T. Tanabe, Y. Nakajima, K. Hosaka, D. Akamatsu, A. Onae, T. Suzuyama, M. Amemiya, and F.-L. Hong, “Improved absolute frequency measurement of the 171Yb optical lattice clock towards a candidate for the redefinition of the second,” Appl. Phys. Express 5, 102401 (2012).
- [8] C. Y. Park, D.-H. Yu, W.-K. Lee, S. E. Park, E. B. Kim, S. K. Lee, J. W. Cho, T. H. Yoon, J. Mun, S. J. Park, T. Y. Kwon, and S.-B. Lee, “Absolute frequency measurement of ( F = 1/2)– ( F = 1/2) transition of 171 Yb atoms in a one-dimensional optical lattice at KRISS,” Metrologia 50, 119 (2013).
- [9] M. Pizzocaro, G. Costanzo, A. Godone, F. Levi, A. Mura, M. Zoppi, and D. Calonico, “Realization of an ultrastable 578-nm laser for an Yb lattice clock,” IEEE Trans. Ultrason. Ferroelectr. Freq. Control 59, 426 – 31 (2012).
- [10] C. Ning, Z. Min, C. Hai-Qin, F. Su, H. Liang-Yu, Z. Xiao-Hang, G. Qi, J. Yan-Yi, B. Zhi-Yi, M. Long-Sheng, and X. Xin-Ye, “Clock-transition spectrum of 171Yb atoms in a one-dimensional optical lattice,” Chin. Phys. B 22, 090601 (2013).
- [11] T. Loftus, J. Bochinski, and T. Mossberg, “Simultaneous multi-isotope trapping of ytterbium,” Phys. Rev. A 63, 053401 – 1 (2001).
- [12] Y. Takasu, K. Maki, K. Komori, T. Takano, K. Honda, M. Kumakura, T. Yabuzaki, and Y. Takahashi, “Spin-singlet Bose-Einstein condensation of two-electron atoms,” Phys. Rev. Lett. 91, 040404 (2003).
- [13] T. Fukuhara, S. Sugawa, and Y. Takahashi, “Bose-Einstein condensation of an ytterbium isotope,” Phys. Rev. A 76, 0516041 (2007).
- [14] M. Okano, H. Hara, M. Muramatsu, K. Doi, S. Uetake, Y. Takasu, and Y. Takahashi, “Simultaneous magneto-optical trapping of lithium and ytterbium atoms towards production of ultracold polar molecules,” Appl. Phys. B 98, 691 – 6 (2010).
- [15] F. Munchow, C. Bruni, M. Madalinski, and A. Gorlitz, “Two-photon photoassociation spectroscopy of heteronuclear YbRb,” Phys. Chem. Chem. Phys. 13, 18734 – 7 (2011).
- [16] M. Borkowski, P. Zuchowski, R. Ciurylo, P. Julienne, D. Kedziera, L. Mentel, P. Tecmer, F. Munchow, C. Bruni, and A. Gorlitz, “Scattering lengths in isotopologues of the RbYb system,” Phys. Rev. A 88, 052708 (2013).
- [17] M. Borkowski, R. Ciurylo, P. Julienne, R. Yamazaki, H. Hara, K. Enomoto, S. Taie, S. Sugawa, Y. Takasu, and Y. Takahashi, “Photoassociative production of ultracold heteronuclear ytterbium molecules,” Phys. Rev. A 84, 030702 (2011).
- [18] Y. Takasu and Y. Takahashi, “Quantum degenerate gases of ytterbium atoms,” J. Phys. Soc. Jpn. 78, 012001 (11 pp.) (2009).
- [19] H. Hara, Y. Takasu, Y. Yamaoka, J. Doyle, and Y. Takahashi, “Quantum degenerate mixtures of alkali and alkaline-earth-like atoms,” Phys. Rev. Lett. 106, 205304 (2011).
- [20] A. Hansen, A. Khramov, W. Dowd, A. Jamison, B. Plotkin-Swing, R. Roy, and S. Gupta, “Production of quantum-degenerate mixtures of ytterbium and lithium with controllable interspecies overlap,” Phys. Rev. A 87, 013615 (8 pp.) – (2013).
- [21] S. Dorscher, A. Thobe, B. Hundt, A. Kochanke, R. Le Targat, P. Windpassinger, C. Becker, and K. Sengstock, “Creation of quantum-degenerate gases of ytterbium in a compact 2D-/3D-magneto-optical trap setup,” Rev. Sci. Instrum. 84, 043109 (2013).
- [22] Y. Takasu, Y. Saito, Y. Takahashi, M. Borkowski, R. Ciurylo, and P. Julienne, “Controlled production of subradiant states of a diatomic molecule in an optical lattice,” Phys. Rev. Lett. 108, 173002 (2012).
- [23] F. Gerbier and J. Dalibard, “Gauge fields for ultracold atoms in optical superlattices,” New J. Phys. 12, 033007 (2010).
- [24] H. Nonne, M. Moliner, S. Capponi, P. Lecheminant, and K. Totsuka, “Symmetry-protected topological phases of alkaline-earth cold fermionic atoms in one dimension,” Europhys. Lett. 102, 37008 (2013).
- [25] V. Natarajan, “Proposed search for an electric-dipole moment using laser-cooled 171Yb atoms,” Eur. Phys. J. D 32, 33 – 8 (2005).
- [26] M. Tarbutt, B. Sauer, J. Hudson, and E. Hinds, “Design for a fountain of YbF molecules to measure the electron’s electric dipole moment,” New J. Phys. 15, 053034 (2013).
- [27] F. Deuretzbacher, D. Becker, J. Bjerlin, S. Reimann, and L. Santos, “Quantum magnetism without lattices in strongly interacting one-dimensional spinor gases,” Phys. Rev. A 90, 013611 (2014).
- [28] N. Chiodo, F. Du Burck, J. Hrabina, Y. Candela, J.-P. Wallerand, and O. Acef, “CW frequency doubling of 1029 nm radiation using single pass bulk and waveguide PPLN crystals,” Opt. Commun. 311, 239 – 44 (2013).
- [29] O. Stepanenko, E. Quillier, H. Tronche, P. Baldi, and M. De Micheli, “Highly confining proton exchanged waveguides on Z-Cut LiNbO3 with preserved nonlinear coefficient,” IEEE Photonics Technol. Lett. 26, 1557 – 60 (2014).
- [30] E. B. Kim, W.-K. Lee, C. Y. Park, D.-H. Yu, and S. E. Park, “Narrow linewidth 578 nm light generation using frequency-doubling with a waveguide PPLN pumped by an optical injection-locked diode laser,” Opt. Express 18, 10308 – 14 (2010).
- [31] M. Yasuda, T. Kohno, H. Inaba, Y. Nakajima, K. Hosaka, A. Onae, and F.-L. Hong, “Fiber-comb-stabilized light source at 556 nm for magneto-optical trapping of ytterbium,” J. Opt. Soc. Am. B 27, 1388 – 93 (2010).
- [32] S. Sinha, C. Langrock, M. Digonnet, M. Fejer, and R. Byer, “Efficient yellow-light generation by frequency doubling a narrow-linewidth 1150 nm ytterbium fiber oscillator,” Opt. Lett. 31, 347 – 9 (2006).
- [33] A. Bouchier, G. Lucas-Leclin, P. Georges, and J. Maillard, “Frequency doubling of an efficient continuous wave single-mode Yb-doped fiber laser at 978 nm in a periodically-poled MgO:LiNbO3 waveguide,” Opt. Express 13, 6974–6979 (2005).
- [34] S. Kobayashi and T. Kimura, “Injection locking in AlGaAs semiconductor laser,” Quantum Electronics, IEEE J. 17, 681–689 (1981).
- [35] N. Kostylev, E. Ivanov, M. Tobar, and J. J. McFerran, “Sub-Doppler cooling of ytterbium with the transition including 171Yb (I=1/2),” J. Opt. Soc. Am. B 31, 1614 (2014).
- [36] M. Cristiani, T. Valenzuela, H. Gothe, and J. Eschner, “Fast nondestructive temperature measurement of two-electron atoms in a magneto-optical trap,” Phys. Rev. A. 81, 063416 (2010).
- [37] T. Loftus, J. R. Bochinski, and T.W. Mossberg, “Probing magneto-optic trap dynamics through weak excitation of a coupled narrow-linewidth transition,” Phys. Rev. A. 61, 061401 (2000).
- [38] A. Slepkov, A. Bhagwat, V. Venkataraman, P. Londero, and A. Gaeta, “Spectroscopy of Rb atoms in hollow-core fibers,” Phys. Rev. A 81, 053825 (2010).
- [39] A. Akulshin, V. Sautenkov, V. Velichansky, A. Zibrov, and M. Zverkov, “Power broadening of saturation absorption resonance on the D2 line of rubidium,” Opt. Commun. 77, 295 – 8 (1990).
- [40] C. N. Cohen-Tannoudji, “Manipulating atoms with photons,” Rev. Mod. Phys. 70, 707 (1998).
- [41] R. Maruyama, R. Wynar, M. Romalis, A. Andalkar, M. Swallows, C. Pearson, and E. Fortson, “Investigation of sub-doppler cooling in an ytterbium magneto-optical trap,” Phys. Rev. A 68, 011403 (2003).
- [42] H. Telle, “Stabilization and modulation schemes of laser diodes for applied spectroscopy.” Spectrochimica Acta Review 15, 301–327 (1993).
- [43] S. Uetake, A. Yamaguchi, S. Kato, and Y. Takahashi, “High power narrow linewidth laser at 556 nm for magneto-optical trapping of ytterbium,” Appl. Phys. B 92, 33 (2008).
- [44] W. Kozlovsky, C. Nabors, and R. Byer, “Efficient second harmonic generation of a diode-laser-pumped CW Nd:YAG laser using monolithic MgO:LiNbO3 external resonant cavities,” IEEE J. Quantum Electron. 24, 913 – 19 (1988).
- [45] R. Le Targat, J. Zondy, and P. Lemonde, “75%-Efficiency blue generation from an intracavity PPKTP frequency doubler,” Opt. Commun. 247, 471 – 81 (2005).