CCD photometry of NGC 6811
Abstract
We present the results of CCD observations of the open cluster NGC 6811 obtained on 18th July 2012 with the 1 m telescope at the TÜBİTAK National Observatory (TUG). Using these photometric results, we determine the structural and astrophysical parameters of the cluster. The mean photometric uncertainties are better than 0.02 mag in the magnitude and , , and colour indices to about 0.03 mag for among stars brighter than magnitude . Cluster member stars were separated from the field stars using the Galaxia model of Sharma et al. (2011) together with other techniques. The core radius of the cluster is found to be arcmin. The astrophysical parameters were determined simultaneously via Bayesian statistics using the colour-magnitude diagrams versus , versus , versus , and versus of the cluster. The resulting most likely parameters were further confirmed using independent methods, removing any possible degeneracies. The colour excess, distance modulus, metallicity and the age of the cluster are determined simultaneously as mag, mag, dex and Gyr, respectively. Distances of five red clump stars which were found to be members of the cluster further confirm our distance estimation.
00footnotetext: Istanbul University, Faculty of Science, Department of Astronomy and Space Sciences, 34119 University, Istanbul, Turkey
00footnotetext: Istanbul University, Faculty of Science, Department of Astronomy and Space Sciences, 34119 University, Istanbul, Turkey
00footnotetext: Istanbul University, Faculty of Science, Department of Astronomy and Space Sciences, 34119 University, Istanbul, Turkey
00footnotetext: Istanbul University, Faculty of Science, Department of Astronomy and Space Sciences, 34119 University, Istanbul, Turkey
00footnotetext: Istanbul University, Faculty of Science, Department of Astronomy and Space Sciences, 34119 University, Istanbul, Turkey
00footnotetext: Istanbul University, Faculty of Science, Department of Astronomy and Space Sciences, 34119 University, Istanbul, Turkey
00footnotetext: Istanbul University, Graduate School of Science and Engineering, Department of Astronomy and Space Sciences, 34116, Beyazıt, Istanbul, Turkey
00footnotetext: Department of Theoretical Physics and Astrophysics, Masaryk University, Kotlár̆ská 2, 611 37 Brno, Czech Republic
Keywords Galaxy: open cluster and associations: individual: NGC 6811 – stars: Hertzsprung Russell (HR) diagram
1 INTRODUCTION
Galactic clusters are distributed along the Galactic disc, with scaleheights consistent with thin disc population. This distribution makes them ideal tracers of the Galactic disc, allowing for a better understanding of the Galactic structure, chemical composition, stellar population and star formation processes in the Galaxy. Thus, the structure and astrophysical parameters of individual clusters such as age, metal abundance, distance and reddening has to be determined through observations of these systems. The most practical and therefore most often used observational techniques are based on utilising colour-magnitude and two-colour diagrams observed in the optical bands.
The intermediate-age open cluster NGC 6811 (, ) is located in the Kepler field (Borucki et al., 2011). Historically, this cluster has seldomly been studied through only a limited number of photographic and photometric observations. First photographic measurements of the cluster were performed by Lindoff (1971), finding that the age of the cluster is yr and located at a distance of 1100 pc using 377 stars within the line-of-sight of the cluster. Barkhatova et al. (1978) estimated the age and distance as yr and 1150 pc, respectively, with a larger sample of stars (2000 stars) brighter than magnitude. Sanders (1971) identified 97 members of the cluster by investigating the proper motions of 296 stars brighter than magnitude in the field of NGC 6811. Mermilliod & Mayor, (1990) estimated the radial velocity of the cluster as km s-1 by means of the data of three cluster members. Glushkova et al. (1999) studied the cluster photometrically and spectroscopically. They measured the distance and age of the cluster as 1040 pc and yr, respectively. The most recent observations of NGC 6811 were reported by Janes et al. (2013) using CCD photometric data obtained from different telescopes. Following a Bayesian approach they measured colour excess, distance modulus, metal abundance and the age of the cluster as mag, mag, ( dex) and Gyr, respectively.
Here, we provide colour excesses, distance modulus and metal abundance of the cluster following different and independent approaches. On the one hand, we followed Bayesian methods, where the individual parameters are determined simultaneously. On the other hand, we used methods that involve comparing theoretical isochrones with the observed two-colour and colour-magnitude diagrams of the cluster members. The main difference between these procedures is that the parameters resulting from the Bayesian statistics may be affected from degeneracy. We aim to compare the astrophysical parameters of NGC 6811 obtained through a Bayesian approach and independent -traditional- methods. Although the degeneracies are possible in simultaneous solution of the parameters through the Bayesian approach, they are minimized as the colour and the possible red giants help to separate reddening and metallicity.
The layout of the paper is as follows: Section 2 presents the observations and photometric reduction of the open cluster NGC 6811. Section 3 describes colour-magnitude diagrams, and structural parameters of the cluster. In Section 4, we derive the astrophysical parameters of the cluster using a Bayesian approach. Section 5 is devoted to the independent methods used to determine the astrophysical parameters. Finally, in Section 6 we present a discussion and a conclusion of our study.
2 OBSERVATIONS
CCD observations of NGC 6811 were carried out on 18th July 2012 using the 1m Ritchey-Chrétien telescope (T100) located at the TÜBİTAK National Observatory (TUG)111www.tug.tubitak.gov.tr in Bakırlıtepe, Antalya/Turkey. The mounted camera was an SI 1100 CCD camera (back illuminated, 4k4k pixels). The pixel scale is pixel-1, resulting in a total field of view of about . The readout noise of the system is 4.19 e-, and the gain is 0.55 e-/ADU. The cluster field was observed using short and long exposure times in each filter to be able to cover the widest possible flux range, without being affected by photon pile-up. Log of observations is given in Table 1. The night was moderately photometric with a mean seeing of .
We used Image Reduction and Analysis Facility (IRAF)222IRAF is distributed by the National Optical Astronomy Observatories routines for pre-reduction processes and transforming the pixel coordinates of the objects identified in frames to equatorial coordinates. We observed several standard stars selected from Landolt (2009) during the night for the determination of atmospheric extinction and transformation coefficients for the observing system. We determined the instrumental magnitudes of the standard stars, utilizing IRAF software packages with aperture photometry. For the field of the cluster, we used Source Extractor (SExtractor)333SExtractor: Software for source extraction and isophotal photometry (Bertin & Arnouts, 1996). In order to perform aperture corrections for the instrumental magnitudes obtained from isophotal photometry, we also performed aperture photometry of a number of well separated stars in the field. Then, the resulting aperture corrections were applied to the instrumental magnitudes of the stars in the field. Finally, we used the following equations (Janes & Hoq, 2011; Janes et al., 2013) to transform the instrumental magnitudes and colours of stars to the standard photometric system:
for , and ;
| (1) | |||
| (2) | |||
| (3) | |||
for and ;
| (4) | |||
| (5) |
for and ;
| (6) | |||
| (7) |
where and are defined as magnitudes in the standard photometric system, , , , and the instrumental magnitudes and the airmass. and are primary and secondary extinction coefficients while and are transformation coefficients to the standard system. Applying multiple linear fits to the instrumental magnitudes of the standard stars, we obtained the photometric extinction and transformation coefficients for that particular night. The resulting values are given in Table 2.
3 DATA ANALYSIS
3.1 Identification of Stars and Error Analyses
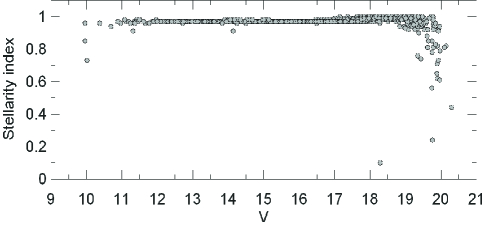
Using the SExtractor, we detected 1605 objects in the field of NGC 6811 and constructed a catalogue. In order to identify non-stellar objects, most likely galaxies, in our catalog, we used the the stellarity index (SI) provided by SExtractor. The apparent magnitude versus stellarity diagram of 1605 objects is plotted in Fig. 1. The objects with stellarity index smaller than 0.8 are assumed to be non-stellar sources and therefore excluded from further analysis (Andreuzzi et al., 2002; Karaali et al., 2004). The resulting catalog has 1591 objects that are classified as stars. The final photometric catalogue containing the colours and magnitudes of individual stars are tabulated in Table 3.
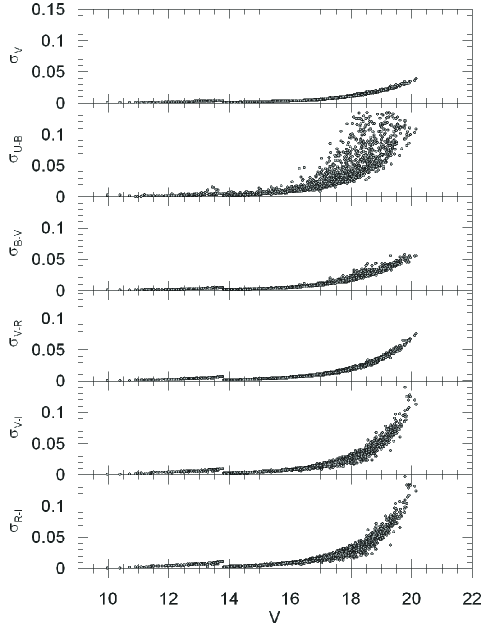
The mean errors of the measurements in the band and , , , and colours are given in Table 4 and Fig. 2 as a function of the apparent magnitude. The discontinuity of the errors at mag in Fig. 2 originates from the use of two different exposure times. The errors are relatively small for stars with mag, while they increase exponentially towards fainter magnitudes. The largest errors for a given magnitude belong to colour. For stars brighter than magnitude 15 and stars with magnitudes between 15 and 18, the mean photometric errors in the , , , and indices are smaller than 0.004 and 0.022 mag, respectively. The errors in the colour indices are smaller than 0.004 and 0.034 mag for the same magnitude ranges.
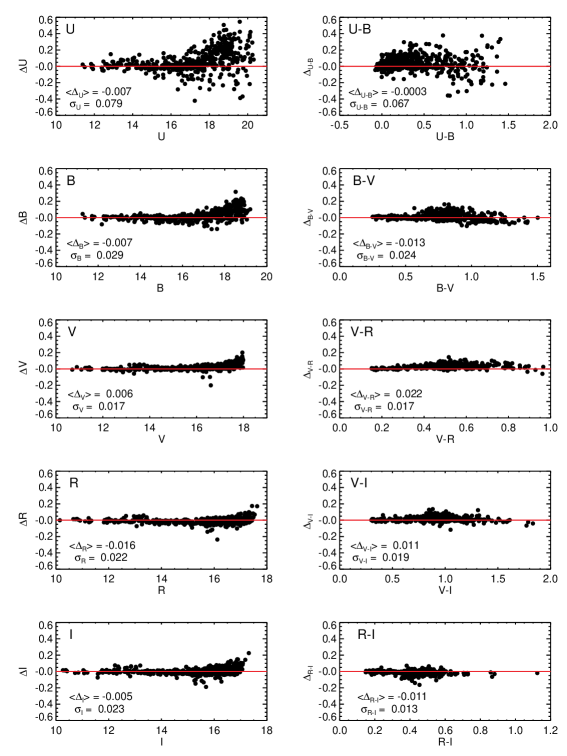
As stated above, NGC 6811 has been the subject of many studies. The most recent study for this cluster is carried out by Janes et al. (2013) who used the same photometry, i.e. , in their investigation, as it is located in the Kepler spacecraft’s field of view (Stello et al., 2011; Meibom et al., 2011; Hekker et al., 2011; Corsaro et al., 2012). We cross-matched our catalogue with the catalogue of Janes et al. (2013) to compare the photometric measurements. We identified 653 stars that are detected in both catalogues. The results of these comparisons are given in Fig. 3. The magnitudes and colours on the abscissa refer to the ones in our study, while the magnitude and colour differences on the ordinate show the differences between the two catalogues. The means and the standard deviations of the resulting differences are small except for and , i.e. and mag. The agreement is much better in the and bands and their related colours.
3.2 Colour-Magnitude Diagrams
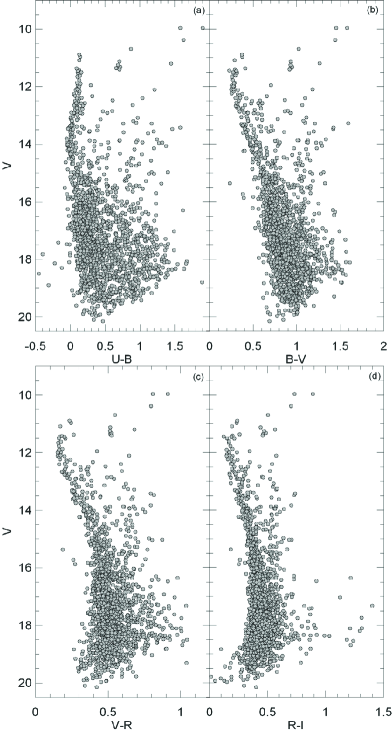
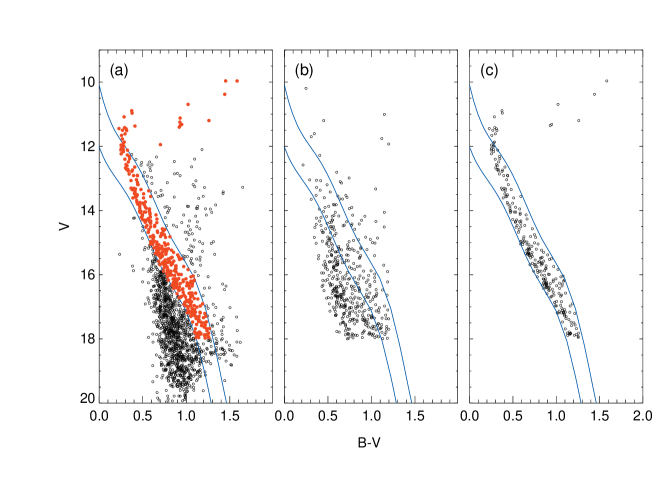
The most effective tool for the determination of the parameters for a cluster is its colour-magnitude diagrams. We used four colour-magnitude diagrams, i.e. versus , versus , versus and versus for the stars in Table 3, for this purpose. A glance to the colour-magnitude diagrams in Fig. 4 reveals that our cluster is rather sparse. Although most of the stars brighter than mag are lying along a sequence, resembling the main-sequence of an open cluster, the vertical distribution of the stars fainter than mag imply that most of these stars are field stars.
In all panels, among the bright and red stars half a dozen of them occupy the region where red clump (RC) stars lie, i.e. mag (Bilir et al., 2013a). These stars are important because they have been used as standard candles (i.e. Paczynski & Stanek,, 1998; Cabrera-Lavers, Garzón & Hammersley, 2005). These RC stars can be used to confirm the distance of a cluster found from other methods. The position of another small group of stars, bright but blue, implies that the turn-off point of the cluster lie within mag. The mean colour of these stars is about 0.2 mag.
As detailed below, in the identification of the cluster members we followed a two-step approach; first we made certain selections using theoretically calculated isochrones, then we used the Galaxia model (Sharma et al., 2011) to separate the field stars from the cluster members.
We assumed that 387 stars with mag are likely evolved and main-sequence members of the cluster and included in our further analysis due to the sensitivity of our observations (Fig. 5a). Below mag, to identify the likely main-sequence members of the cluster we applied the following selections. We fitted the zero age main-sequence (ZAMS) Padova isochrone with solar metallicity to 357 stars within an apparent magnitude interval and moved it to brighter magnitudes by 0.75 mag to cover the binary stars, as well, resulting in a band like region in the colour-magnitude diagram (see Fig. 5a).
We used the Galaxia model of Sharma et al. (2011) and estimated the magnitudes and colours of stars, which are expected to lie in the direction to the cluster NGC 6811 (Fig. 5b). We estimated the colours and magnitudes of these synthetic stars in different Galactic populations using the input parameters of the Galaxia model for the Galactic coordinates (), spatial size (0.1136 square-degree), colour ( mag) and the range of apparent magnitude () of the cluster. Then, we omitted those which fall into the categories of bulge, thick disc and halo stars plus the thin-disc stars older than 5 Gyr. Note that a small number of older stars could fall into the relevant region of the colour-magnitude diagram. Resulting sample contains 446 synthetic stars in the line-of-sight of NGC 6811. As a final restriction, we selected only those which are located in the same band on the colour-magnitude diagram Fig. 5b. The final number of stars which satisfy all of these conditions is 133. The next step in the selection is to subtract randomly selected 133 stars within the apparent magnitude interval of with 1 mag steps in the colour-magnitude diagram of the cluster as shown in Fig. 5a. Thus the resulting number of cluster stars within the apparent magnitude interval , with zero age and solar metallicity is 254. The versus diagram of the remaining 254 stars is shown in Fig. 5c.
3.3 Cluster Radius and Radial Stellar Surface Density
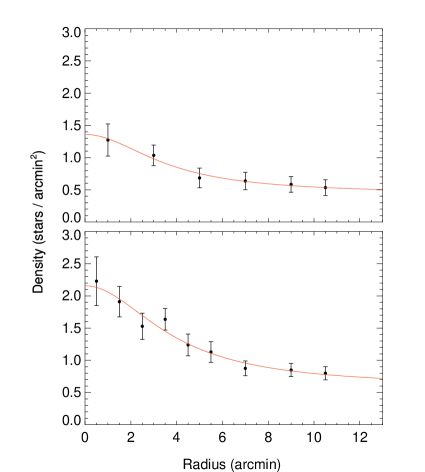
The stellar density profile of the cluster NGC 6811 has been estimated in two different ways. In the first case, we used only the main-sequence stars of the cluster given in Fig. 5c, while in the second case both categories, i.e. the cluster stars and the field main-sequence stars within the same apparent magnitude interval, with the same age and metallicity as cluster main-sequence stars (Fig. 5a) have been introduced into our calculations. The stellar density values for the main-sequence sample of the cluster have been evaluated in 2 arcminute steps, while for the second sample 1 arcminute step was sufficient for reliable density evaluations.
Stellar density profiles of the cluster are plotted in Fig. 6. We fitted each of them the King (1962) model defined as:
| (8) |
where is the radius of the cluster centered at the Galactic coordinates (, )=(). , and denote the background stellar density, the central stellar density and the core radius of the cluster, respectively. The core radii estimated for two stellar samples are compatible within the errors, i.e. and arcmin for the cluster stars and cluster plus field stars, respectively. However, the central densities for the two stellar samples are different than each other, as expected. The central stellar densities are and stars/arcmin2.
4 DETERMINATION OF THE ASTROPHYSICAL PARAMETERS OF NGC 6811 USING A BAYESIAN APPROACH
We estimated the age of the cluster NGC 6811 using the procedure of Jørgensen & Lindegren (2005) as explained in the following. We quote Jørgensen & Lindegren’s paper for details, while a shorter description can be found in Duran et al. (2013). The procedure we used is based on the posterior joint probability defined as follows:
| (9) |
where and and are the prior probability density of the parameters and the likelihood function, respectively. The parameters , , are the age, initial metallicity and initial mass, respectively. The probability density function is defined such that is the fraction of stars with ages between and , metallicities between and , and initial masses between and . The constant of proportionality in Eq. (9) must be chosen to make .
The likelihood function () is equal to the probability of getting the observed data (colour, apparent magnitude, metallicity) for given parameters . Then, the likelihood function is
| (10) |
where
| (11) |
and where is the standard error. A maximum-likelihood calculation of the stellar parameters may be obtained by finding the maximum of this function, which is equivalent to minimizing in the case of Gaussian errors.
The prior density of the model parameters in Eq. (12) can be written as
| (12) |
where is the a priori star formation rate history, the metallicity distribution as a function of age, and the a priori initial mass function (IMF) as a function of metallicity and age. In our study we adopted the metallicity distribution as a flat distribution, and IMF the following power-law :
| (13) |
with . These constraints which are the same as in Jørgensen & Lindegren (2005) and Duran et al. (2013) provide simplifications in calculations. If we insert Eq. (12) into Eq. (9) and integrate with respect to and we obtain the following form of the posterior probability density function of :
| (14) |
where
| (15) |
We normalize Eq. (15) such that at its maximum. Jørgensen & Lindegren (2005) interpreted as the relative likelihood of after eliminating and .
Following Jørgensen & Lindegren (2005), we evaluated Eq. (15) for each age value () as a double sum along a set of isochrones at the required age that are equidistant in metallicity (). In practice, we used pre-computed isochrones for a step size of 0.05 dex in , and considered only those within of the observed metallicity. Let be the initial-mass values along each isochrone (, ); then
| (16) |
Age corresponding to the mode of the relative posterior probability is adopted as the age of the star in question.
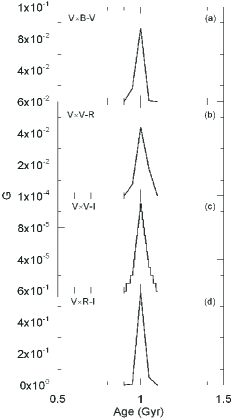
In the case of the cluster NGC 6811, we adopted the Padova synthetic stellar library (Marigo et al., 2008). We used the isochrones with 0-3 Gyr in steps of 50 Myr and the metallicities dex in steps of 0.05 dex. For the distance modulus we used the range as mag in steps of 0.01 mag. The observed data consist of the , , and colours and apparent magnitude. Because we have four sets of colour-magnitude diagrams for the cluster stars (Fig. 7), we estimated four sets of ages for the stellar sample. The distribution of the parameter in terms of age for each set is shown in Fig. 8. Each distribution has a relatively high peak, as expected for the stars of a cluster. The mode of the distribution obtained from each colour-magnitude diagram (Table 5) corresponds to the age of the cluster. The final age of NGC 6811 is determined as Gyr, by averaging these individual results.
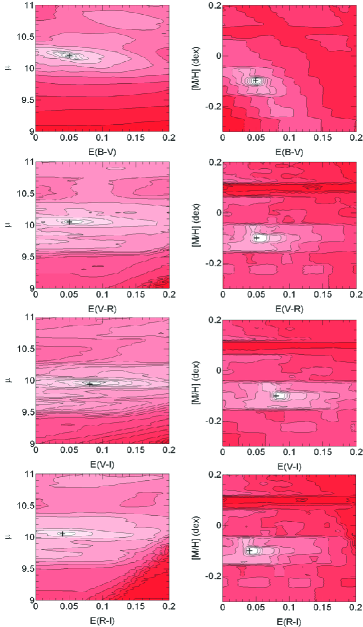
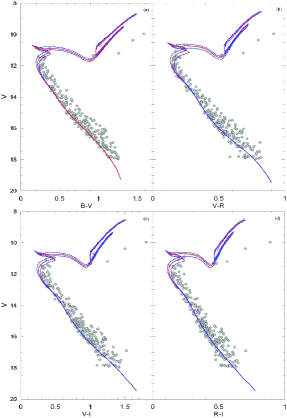
In each step of age () estimation for a given colour-magnitude diagram, we used a colour excess for de-reddening the corresponding distance modulus and colour indices, in addition to an amount of metallicity. The colour excesses , , and are selected from an interval of [0, 0.2] mag in steps of 0.01 mag. The colour excesses versus the corresponding apparent distance modulus and metallicity are plotted in Fig. 9. The most probable colour excess, distance modulus and metallicity for each colour-magnitude diagram are also indicated in the figure and the results are given in Table 5. The weighted mean of the four distance moduli and metallicities, i.e. mag and dex, are adopted as the distance modulus and the metallicity of the cluster NGC 6811. Resulting isochrones with the most likely parameter values are shown in Fig. 10 for each colour-magnitude diagram together with the uncertainties.
5 INDEPENDENT CONFIRMATION OF THE ASTROPHYSICAL PARAMETERS
In Section 4, we determined the astrophysical parameters of the cluster simultaneously using a Bayesian approach. However, in reality the distance, reddening, and the metallicity all affect the observed colour-magnitude diagrams of a cluster in similar ways. In order to break the degeneracies between these parameters and obtain the most reliable values, independent measurements are essential. Below, we use a number of well-known and independent methods to obtain astrophysical parameters of NGC 6811 and assess the results of the Bayesian approach.
5.1 Reddening and Distance Modulus Estimation
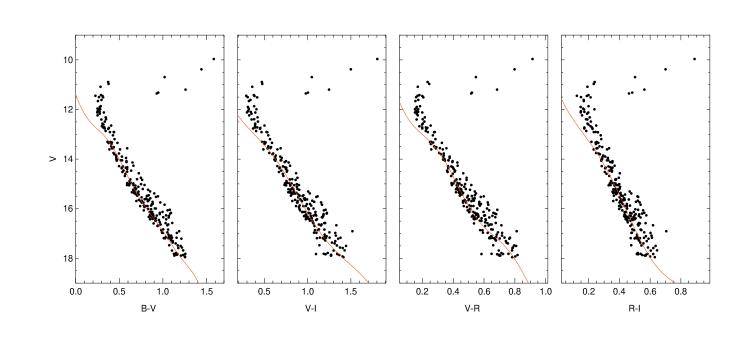
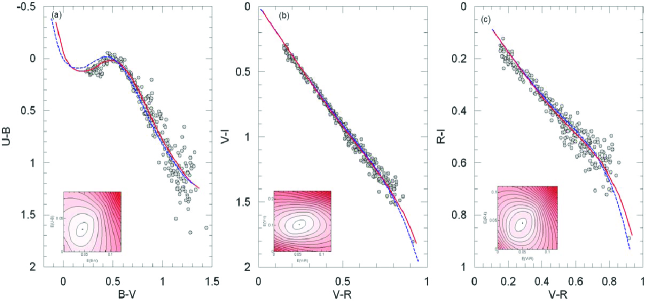
We used main-sequence stars of the cluster within the magnitude range for the determination of the reddening in five colours: , , , , and , comparing their positions in the two-colour diagrams with three standard main-sequences, as shown in Fig. 11. The first standard main-sequence (Sung et al., 2013) is constructed using the observational data of the solar metallicity main-sequence stars for the versus colours, while the other two are taken from the Padova synthetic stellar library (Marigo et al., 2008) calculated for the solar metallicity and zero age stars in the colours versus and versus , respectively.
We adopted an amount of colour excess values within the range mag in steps of 0.001 mag and used them in the following equations of Cardelli et al. (1989) to evaluate the , , and colour excesses:
| (17) | |||
| (18) | |||
| (19) |
The positions of the cluster stars have been compared to the standard main sequence in question, and the most likely colour excesses have been determined by minimum analyses. The final reddened and de-reddened main-sequence curves fitted to the cluster stars are shown in Fig. 11. The contours of distributions are also given in the left corner of each diagram. The colour excesses estimated in this way are as follows: , , , , and mag.
The distance modulus of the cluster NGC 6811 has been determined by fitting the colour-magnitude diagrams of the main-sequence stars with mag to four standard colour-magnitude diagrams (Fig. 7). For the versus diagram, we used the ZAMS given by Sung et al. (2013), while we adopted the corresponding ZAMS taken from the Padova synthetic stellar library (Marigo et al., 2008) for the versus , versus , and versus . The ZAMS’s are reddened by an amount of colour excesses found above and fitted to the cluster stars for different distance moduli values in the 9-11 mag range with a step size of 0.01 mag. The minimum statistics is used to obtain the most probable distance moduli for each colour-magnitude diagram. The resulting distance moduli are as follows: , , , and mag. The final distance modulus of the cluster is the weighted mean of the distance moduli claimed for the four colour-magnitude diagrams, i.e. mag. For the estimation of the errors, we adopted the procedure of Phleps et al. (2000), i.e. by adding 1 to the value.
5.2 Distance via the Red Clump Stars
Distance estimation given above for the cluster can be confirmed using the red clump (RC) stars identified in the colour-magnitude diagrams. The absolute magnitudes of the RC stars have been the subject of many studies in the sense that they can be used as standard candles in distance estimation of the objects associated with them (cf. Alves, 2000; Grocholski & Sarajedini, 2002; Groenewegen, 2008; Yaz Gökçe et al., 2013; Bilir et al., 2013a, b). Groenewegen (2008) calculated the mean absolute magnitude for the RC stars as mag in the Two Micron Sky Survey (2MASS; Skrutskie et al., 2006) photometric system, while the mean absolute magnitude in the band is given by Keenan & Barnbaum (1999) as mag.
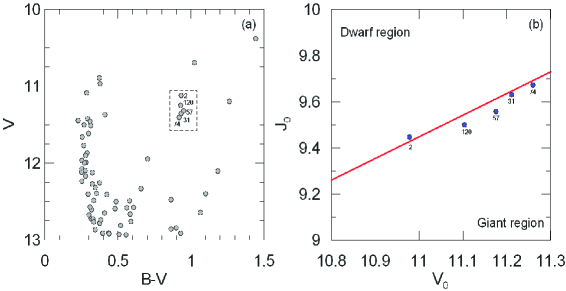
In the colour-magnitude diagrams of NGC 6811, stars No: 2, 31, 57, 74 and 120 occupy the region of the RC stars, i.e. mag in the versus colour-magnitude diagram (Fig. 12). Additionally, four of these (31, 57, 74 and 120) lie in the giant region of the versus two-magnitude diagram in Bilir et al. (2006) suggesting that they are evolved stars (see also, Bilir et al., 2010). We adopted the value mag as the absolute magnitude of the stars No: 2, 31, 57, 74 and 120, and used their apparent magnitudes to estimate their distances. Resulting values are given in Table 6. The estimated distances for the cluster NGC 6811 from the four colour-magnitude diagrams (Table 5) are in agreement with the values inferred from the RC stars, within the errors. Thus, we confirm the distance of the cluster estimated by the procedure in situ, i.e. by fitting its colour-magnitude diagram to a standard main-sequence, via about a half dozen RC stars.
5.3 Metallicity Estimation by Means of Normalized UV-excess
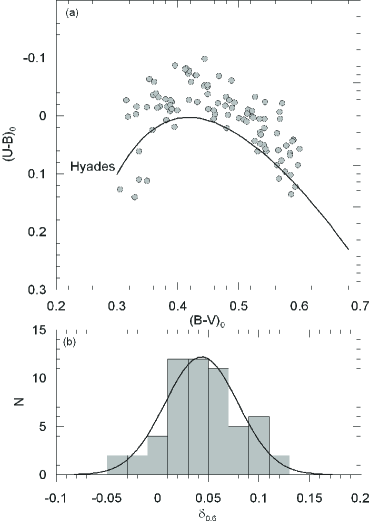
We measured the metallicity of the cluster NGC 6811 by means of the normalized ultra-violet (UV) excesses, , of 60 main-sequence cluster stars with spectral types F0-G0 and colours mag. We evaluated the difference between the de-reddened colour index of a given star and the one corresponding to the Hyades star with the same de-reddened colour index, i.e. , and normalized it to the UV-excess at mag, i.e. , following the procedure in Karaali et al. (2011). Here, the subscripts and refer to “Hyades” and “star”, respectively. The spectral types of the stars have been obtained from Cox (2000) by means of their de-reddened colour indices.
Then, we plotted the histogram of normalized excesses for 60 main-sequence stars with spectral types F0-G0 mentioned above and estimated the mode of this distribution. Finally, we transformed the mode to obtain the metallicity using the following equation in Karaali et al. (2011):
| (20) | |||
The two-colour diagram, versus , of 60 main-sequence stars used in the calculation and their normalized UV-excess, , histogram are given in Fig. 13. The mode for the distribution and the corresponding metallicity are mag and dex, respectively.
6 DISCUSSION
In this paper, we present the results of our photometric observations and determine the structural and astrophysical parameters of the open cluster NGC 6811. We used the Galaxia model of Sharma et al. (2011) and identified 133 likely field stars with mag in the line-of-sight to the cluster. Thus, we could obtain a density profile for the cluster based only on its possible members, in addition to the density profile in situ, i.e. the density profile formed by the cluster and field stars. The measured core radius by the two procedures are in agreement with each other within their formal uncertainties. However, the central and background densities are different, as would be expected. Janes et al. (2013) estimated nine sets of parameters for the density profile of the cluster NGC 6811. We compared our parameters, related to the cluster and field stars, with those of Janes et al. (2013) found for the apparent magnitude interval (Table 7). As presented in Table 7, the core radius and the peak central stellar density parameters, found via the King (1962) model are in very good agreement with each other, within the uncertainties of individual measurements. However, the background stellar density found here, stars/arcmin2, is less than the one in Janes et al. (2013), stars/arcmin2. We should note that the amounts of the differences between the structural parameters in our study and the corresponding ones in Janes et al. (2013) are at the level of the differences in Janes et al. (2013) among different models, i.e. King (1962), Plummer (1911), and exponential model, for a given parameter.
We have two sets of colour excesses and distance moduli. The colour excess, distance moduli, the metallicity, and age of the cluster are all determined from four colour-magnitude diagram sets, simultaneously following a Bayesian approach. As a further test of the Bayesian approach employing independent methods, we determined the colour excesses, using two-colour diagrams, versus , versus and versus . The distance moduli have been estimated via colour-magnitude diagrams, versus , versus , versus and versus . Finally, the metallicity of the cluster is measured using photometric UV-excesses of F-G type main-sequence stars. The colour excesses in the two methods are compatible for a given colour (Table 8). The same case holds also for the distance moduli (Table 5), as well, which further implies that the simultaneous estimation of the parameters is not affected by the degenaracies between the individual parameters.
The apparent distance modulus reported by Janes et al. (2013), mag, corresponds to a linear distance of pc. This is again compatible with our results, i.e. distances pc and pc, estimated via the weighted mean distance moduli 10.06 and 10.15 mag in Table 5. Additionally, the distances of five RC stars in the range pc further confirm the distance estimation of the cluster NGC 6811, within the errors. The age of the cluster NGC 6811 found in both studies, as and Gyr, here and Janes et al. (2013), respectively are in perfect agreement with each other. The weighted mean of colour excesses in the two sets, mag, is compatible with the one given by Janes et al. (2013) as the best estimate for the colour excess, mag, within the errors. Whereas, the best estimate for the metallicity in Janes et al. (2013), dex, is somewhat smaller than the weighted one in Table 5, dex. We attribute this small difference to a possible degenarcy between all of these astrophysical parameters, i.e. slightly different colour excess, metallicity and distance values resulting in a similar age for the cluster. colour excess and distance of the cluster found here have been confirmed by the two-colour and colour-magnitude diagrams, respectively. Hence, we conclude that the results in this study are not affected from the degeneracy in question.
We compared the colour excess, mean distance, metallicity and age estimated via the colour-magnitude diagrams in our study with the corresponding ones appeared in the literature, summarized in Table 9. The colour excesses estimated in the recent years, Janes et al. (2013) and in this study, are almost half of the ones estimated formerly, Lindoff (1971), Barkhatova et al. (1978), and Glushkova et al. (1999). While, there is a decrease in the distance estimation with increasing time. In these earlier studies, the metallicity of the cluster has been assumed as dex (Lindoff, 1971; Barkhatova et al., 1978; Glushkova et al., 1999). However, the recent two studies show that the cluster is a bit metal-poor, i.e. dex in Janes et al. (2013) and dex in our study. Still, there is a considerable difference between the two recent measurements. The metallicity of dex estimated via the normalized UV-excess in our study is compatible with the value found following the Bayesian approach, as dex. Hence, we conclude that NGC 6811 should be a bit metal-rich than the one claimed by Janes et al. (2013). There is a substantial difference between the ages estimated in the recent years and the ones appeared in the earlier studies, i.e. the cluster NGC 6811 is rather older than measured formerly.
As a final remark, we would like to emphasize the use of Galaxia model of Sharma et al. (2011) to separate the field stars from the likely members of the cluster. Due to its practicality, this procedure may lead to an accurate estimation of structural and astrophysical parameters for the clusters to be studied in the future.
References
- Alves (2000) Alves, D. R.: 2000, ApJ, 539, 732
- Andreuzzi et al. (2002) Andreuzzi, G., Richer, H. B., Limongi, M., & Bolte, M.: 2002, A&A, 390, 961
- Barkhatova et al. (1978) Barkhatova, K. A., Zakharova, P. E., & Shashkina, L. P.: 1978, SvA, 22, 31
- Bertin & Arnouts (1996) Bertin, E. & Arnouts, S.: 1996, A&AS, 117, 393
- Bilir et al. (2006) Bilir, S., Karaali, S., Güver, T., Karataş, Y., & Ak S.: 2006, AN, 327, 72
- Bilir et al. (2010) Bilir, S., Güver, T., Khamitov, I., Ak, T., Ak, S., Coşkunoğlu, K. B., Paunzen, E., Yaz, E.: 2010, Ap&SS, 326, 139
- Bilir et al. (2013a) Bilir, S., Önal, Ö., Karaali, S., Cabrera-Lavers, A., & Çakmak H.: 2013a, Ap&SS, 344, 417
- Bilir et al. (2013b) Bilir, S., Ak, T., Ak, S., Yontan, T., & Bostancı, Z. F.: 2013b, NewA, 23, 88
- Borucki et al. (2011) Borucki, W. J., & et al.: 2011, ApJ, 728, 117
- Cabrera-Lavers, Garzón & Hammersley (2005) Cabrera-Lavers A., Garzón F., Hammersley P. L.: 2005, A&A, 433, 173
- Cardelli et al. (1989) Cardelli, J. A., Clayton, G. C., & Mathis, J. S.: 1989, ApJ, 345, 245
- Corsaro et al. (2012) Corsaro, E., & et al.: 2012, ApJ, 757, 190
- Cox (2000) Cox, A. N.: 2000, Allen’s astrophysical quantities, 4th ed. Publisher: New York: AIP Press; Springer, 2000. Editedy by Arthur N. Cox. ISBN: 0387987460
- Cutri et al. (2003) Cutri, R. M., & et al.: 2003, 2MASS All-Sky Catalog of Point Sources, CDS/ADC Electronic Catalogues, 2246
- Duran et al. (2013) Duran, Ş., Ak, S., Bilir, S., Karaali, S., Ak, T., Bostancı, Z. F., & Coşkunoğlu, B.: 2013, PASA, 30, 43
- Groenewegen (2008) Groenewegen, M.A.T.: 2008, A&A, 488, 25
- Grocholski & Sarajedini (2002) Grocholski, A. J., & Sarajedini, A.: 2002, AJ, 123, 1603
- Glushkova et al. (1999) Glushkova, E. V., Batyrshinova, V. M., & Ibragimov, M. A.: 1999, AstL, 25, 86
- Hekker et al. (2011) Hekker, S., & et al.: 2011, A&A, 530, A100
- Janes & Hoq (2011) Janes, K., & Hoq, S.: 2013, AJ, 141, 92
- Janes et al. (2013) Janes, K., Barnes, S. A., Meibom, S., & Hoq, S.: 2013, AJ, 145, 7
- Jørgensen & Lindegren (2005) Jørgensen, B. R., & Lindegren, L.: 2005, A&A, 436, 127
- Karaali et al. (2004) Karaali, S., Bilir, S., & Hamzaoğlu, E.: 2004, MNRAS, 355, 307
- Karaali et al. (2011) Karaali, S., Bilir, S., Ak, S., Yaz, E., & Coşkunoğlu, B.: 2011, PASA, 28, 95
- Keenan & Barnbaum (1999) Keenan, P.C., & Barnbaum, C.: 1999, ApJ, 518, 859
- King (1962) King, I.: 1962, AJ, 67, 471
- Landolt (2009) Landolt, A.U.: 2009, AJ, 137, 4186
- Lindoff (1971) Lindoff, U.: 1972, A&A, 16, 315
- Marigo et al. (2008) Marigo, P., Girardi, L., Bressan, A., Groenewegen, M. A. T., Silva, L., & Granato, G. L.: 2008, A&A 482, 883
- Meibom et al. (2011) Meibom, S., & et al.: 2011, ApJ, 733, L9
- Mermilliod & Mayor, (1990) Mermilliod, J.-C., & Mayor, M.: 1990, A&A, 237,61
- Paczynski & Stanek, (1998) Paczynski, B., & Stanek, K. Z.: 1998, ApJ, 494, L219
- Phleps et al. (2000) Phleps, S., Meisenheimer, K., Fuchs, B., & Wolf, C.: 2000, A&A, 356, 108
- Plummer (1911) Plummer, H. C.: 1911, MNRAS, 71, 460
- Sanders (1971) Sanders, W. L.: 1971, A&A, 15, 368
- Sharma et al. (2011) Sharma, S., Bland-Hawthorn, J., Johnston, K. V., & Binney, J.: 2011, ApJ, 730, 3
- Skrutskie et al. (2006) Skrutskie, M. F., Cutri, R. M., Stiening, R., & et al.: 2006, AJ, 131, 1163
- Stello et al. (2011) Stello, D., & et al.: 2011, ApJ, 739, 13
- Sung et al. (2013) Sung, H., Lim, B., Bessell, M.S., Kim, J. S., Hur, H., Chun, M., & Park, B.: 2013, JKAS, 46, 103
- Yaz Gökçe et al. (2013) Yaz, Gökçe, E., Bilir, S., Öztürkmen, N. D., Duran, Ş., Ak, T., Ak, S., & Karaali, S.: 2013, NewA, 25, 19
| Filter | Exp. time (s)N |
|---|---|
| 902, 601, 3603 | |
| 203, 903 | |
| 53, 603 | |
| 23, 203 | |
| 13, 103 |
| Band/Coefficient | ||||
| - | - | |||
| - | - | - | ||
| - | - | - | ||
| - | - | - | ||
| - | ||||
| - | ||||
| - | - | |||
| - | - | |||
| - | - | |||
| - | - |
a,b,c calculated from , and , respectively.
| ID | (J2000) | (J2000) | ||||||
|---|---|---|---|---|---|---|---|---|
| 1 | 19 37 18.71 | 46 33 3.89 | 12.490 0.002 | 0.115 0.003 | 0.579 0.002 | 0.365 0.004 | 0.696 0.005 | 0.329 0.005 |
| 2 | 19 37 22.09 | 46 32 51.36 | 11.121 0.001 | 0.703 0.002 | 0.932 0.001 | 0.515 0.002 | 0.959 0.002 | 0.440 0.002 |
| 3 | 19 37 49.41 | 46 32 58.46 | 12.933 0.003 | 0.172 0.004 | 0.555 0.003 | 0.332 0.005 | 0.623 0.007 | 0.290 0.007 |
| 4 | 19 36 59.58 | 46 32 51.25 | 13.283 0.003 | 1.168 0.010 | 1.210 0.004 | 0.679 0.005 | 1.259 0.006 | 0.573 0.006 |
| 5 | 19 37 38.96 | 46 32 49.02 | 13.345 0.003 | 0.009 0.004 | 0.478 0.004 | 0.324 0.006 | 0.590 0.008 | 0.263 0.009 |
| . | … | … | … | … | … | … | … | … |
| . | … | … | … | … | … | … | … | … |
| . | … | … | … | … | … | … | … | … |
| Magnitude Range | |||||||
|---|---|---|---|---|---|---|---|
| 30 | 0.001 | 0.002 | 0.002 | 0.002 | 0.003 | 0.003 | |
| 45 | 0.002 | 0.003 | 0.003 | 0.004 | 0.006 | 0.006 | |
| 67 | 0.003 | 0.005 | 0.004 | 0.005 | 0.006 | 0.007 | |
| 85 | 0.002 | 0.004 | 0.002 | 0.003 | 0.004 | 0.004 | |
| 161 | 0.003 | 0.008 | 0.004 | 0.005 | 0.004 | 0.007 | |
| 289 | 0.005 | 0.015 | 0.008 | 0.008 | 0.011 | 0.012 | |
| 394 | 0.009 | 0.034 | 0.014 | 0.015 | 0.020 | 0.022 | |
| 378 | 0.015 | 0.069 | 0.026 | 0.027 | 0.037 | 0.040 | |
| 142 | 0.025 | 0.095 | 0.040 | 0.046 | 0.070 | 0.076 |
| Colour-Magnitude | Colour Excess | Age | ||||
|---|---|---|---|---|---|---|
| Diagram | (mag) | (mag) | (dex) | (Gyr) | (mag) | (pc) |
| versus | ||||||
| versus | ||||||
| versus | ||||||
| versus | ||||||
| Mean | ||||||
| ID | (J2000) | (J2000) | |||||||
|---|---|---|---|---|---|---|---|---|---|
| (hh:mm:ss) | (dd:mm:ss) | (mag) | (mag) | (mag) | (mag) | (mag) | (mag) | (pc) | |
| 2 | 19:37:22.09 | 46:32:51.36 | 11.121(1) | 0.932(1) | 9.489(20) | 10.978 | 0.886 | 9.448 | |
| 31 | 19:36:55.83 | 46:27:38.25 | 11.354(1) | 0.932(2) | 9.671(20) | 11.211 | 0.886 | 9.630 | |
| 57 | 19:37:02.70 | 46:23:13.76 | 11.319(1) | 0.949(2) | 9.599(20) | 11.176 | 0.903 | 9.558 | |
| 74 | 19:38:04.90 | 46:24:42.61 | 11.403(1) | 0.920(2) | 9.714(20) | 11.260 | 0.874 | 9.673 | |
| 120 | 19:36:57.15 | 46:22:43.22 | 11.247(1) | 0.928(2) | 9.541(20) | 11.104 | 0.882 | 9.500 |
| This study | Janes et al. (2013) | ||
| Parameter | Cluster | Cluster | King Model |
| stars | field stars | ||
| Colour excess | TCD | CMD |
|---|---|---|
| ID | Study | ||||
|---|---|---|---|---|---|
| (mag) | (pc) | (dex) | (Myr) | ||
| 1 | Lindoff (1972) | 0.16 | 1100 | 0 | 500 |
| 2 | Barkhatova et al. (1978) | 0.14 | 0 | 800 | |
| 3 | Glushkova et al. (1999) | 0 | |||
| 4 | Janes et al. (2013) | ||||
| 5 | This study (2014) |