A low-energy description of the metal-insulator transition in the rare-earth nickelates
Abstract
We propose a simple theoretical description of the metal-insulator transition of rare-earth nickelates. The theory involves only two orbitals per nickel site, corresponding to the low-energy anti-bonding states. In the monoclinic insulating state, bond-length disproportionation splits the manifold of bands, corresponding to a modulation of the effective on-site energy. We show that, when subject to a local Coulomb repulsion and Hund’s coupling , the resulting bond-disproportionated state is a paramagnetic insulator for a wide range of interaction parameters. Furthermore, we find that when is small or negative, a spontaneous instability to bond disproportionation takes place for large enough . This minimal theory emphasizes that a small or negative charge-transfer energy, a large Hund’s coupling, and a strong coupling to bond-disproportionation are the key factors underlying the transition. Experimental consequences of this theoretical picture are discussed.
pacs:
71.30.+h,71.15.Mb,71.38.-kI Introduction
The rare-earth nickelate series RNiO3 displays a rich phase diagram with striking structural and metal-insulator transitions Torrance et al. (1992) (see Refs. Medarde, 1997 and Catalan, 2008 for reviews). Only the end member of the series LaNiO3 is metallic and non-magnetic down to the lowest temperature Goodenough and Raccah (1965). Compounds with heavier rare-earth ions R (i.e. smaller ionic radius) display a bad-metal Jaramillo et al. (2014) to insulator transition (MIT) as temperature is lowered. The compounds with Pr or Nd undergo a transition to a magnetic insulating state. However, the transition is towards a non-magnetic insulating state for the smaller rare-earth ions (R Sm and beyond), and the magnetic ordering sets in only at a lower temperature. For example, in LuNiO3 the MIT occurs at K, but the magnetic ordering occurs only at K.
The transition from the high-temperature metallic phase in the orthorhombic () structure to the low temperature insulating phase is concomitant with a structural transition to a monoclinic (P2) structure with two types of NiO6 octahedra Alonso et al. (1999, 2000, 2001); Piamonteze et al. (2005). One set of octahedra is compressed and has short Ni-O bonds (SB), and the other set of octahedra is expanded and has long Ni-O bonds (LB).
The nature of this MIT has still not been fully clarified, and the respective role of correlations (on-site Coulomb repulsion and Hund’s rule coupling ), orbital degeneracy, and structural transition in causing the MIT is still under debate. Interest in this issue has been renewed by the recent activity on nickelates in the form of thin films and heterostructures, and the opportunities for controlling the MIT in these structures (e.g. by strain or electric field) Scherwitzl et al. (2009, 2010, 2011); Zubko et al. (2011); Rondinelli and Spaldin (2011); Hwang et al. (2012); Disa et al. (2013); Liu et al. (2013). The broad question behind the nature of the MIT is how we should think of the electronic structure of these materials.
In the most naive ionic picture, each nickel is Ni3+ () corresponding to the low-spin configuration . The MIT was initially interpreted as a Mott transition (or more accurately a metal to charge-transfer insulator transition) of the quarter-filled shell caused by the change in Ni-O-Ni angle as the tolerance factor is reduced Torrance et al. (1992). However, the MIT is simultaneously accompanied by the structural differentiation between the two nickel sites and there is no anomaly in the susceptibility at Zhou et al. (2000), which makes the homogeneous Mott transition picture untenable (see also Ref. Wang et al., 2012). Clearly, the MIT is not a Slater transition either, since for smaller rare-earths compounds it occurs at a temperature above that of magnetic ordering.
Although is an orbitally degenerate configuration that is susceptible to Jahn-Teller distortion of the octahedra, such a distortion is not experimentally observed for all octahedra Zhou and Goodenough (2004). Nonetheless, several experiments reveal that the lattice degrees of freedom play an active role in the transition. For example, a large isotope effect is observed on , at least for the lighter rare earths Medarde et al. (1998, 1997). In addition, recent control of the transition by light pulses resonant with specific vibrational modes have emphasized the importance of lattice degrees of freedom Caviglia et al. (2012). This suggests that these materials take some other structural route to lift the orbital degeneracy.
Charge disproportionation on the Ni sites into Ni3+δ (on SB sites) and Ni3-δ (on LB sites) has been proposed as an alternative way to interpret the structural transition and resolve the orbital degeneracy issue. A number of recent experiments, especially resonant spectroscopies Alonso et al. (1999, 2001); Staub et al. (2002); Caytuero et al. (2007); Medarde et al. (2008); Bodenthin et al. (2011) have been interpreted in terms of charge disproportionation. However, a strong on-site Coulomb repulsion that is likely relevant for Ni should suppress charge disproportionation.
A different picture was proposed early on by Demourgues et al. Demourgues et al. (1993), and Mizokawa, Khomskii and Sawatzky Mizokawa et al. (2000). The basic premise of these authors is that the ionic assignment is invalid: holes are formed on oxygen sites, a behaviour sometimes referred to as ‘negative charge-transfer’ insulators Mizokawa et al. (1991, 1994); Ushakov et al. (2011). Recent work by Park, Millis and Marianetti Park et al. (2012, 2014); Lau and Millis (2013) provides strong theoretical support to the importance of ligand holes. These authors performed electronic structure calculations involving both oxygen and nickel states, taking correlation effects into account within dynamical mean-field theory (DMFT). They found that the insulating phase can be viewed as a ‘site-selective’ Mott phase. The extreme limit of this picture is the following Park et al. (2012), as also emphasized by Johnston et al. Johnston et al. (2014): LB octahedra have the configuration , while SB octahedra acquire the configuration , with two holes on the ligand and two electrons in the atomic-like shell of nickel, hence lifting orbital degeneracy. Note that this does not imply an actual charge disproportionation since each oxygen is shared by two octahedra, although the charge density is larger in the SB octahedra than in the LB octahedra. The spin is strongly modulated in this picture, with on the SB octahedra (where the two ligand holes screen out the Ni moment) and on the LB octahedra. In the strong coupling limit, the system can be described as the superposition of a Kondo insulator on the SB sites and of a Mott insulator on the LB sites, a mechanism called ‘site-selective Mott transition’ by the authors of Ref. Park et al. (2012). This mechanism is also qualitatively consistent with ideas of Goodenough and coworkers pointing at the strong covalent bonding in the SB octahedra Zhou and Goodenough (2004); Goodenough (1996); Catalan (2008). This picture is quite attractive and reconciles a number of different experimental observations, in particular the absence of Jahn-Teller distortions.
Mazin et al. have pointed out that a disproportionation of the type can be favorable when is small Mazin et al. (2007). This picture is similar to that mentioned above if one assumes that the disproportionation occurs for the antibonding orbital resulting from the strong hybridization between Ni and O states. Ref. Mazin et al. (2007) used density functional calculations to show that magnetically ordered state with such disproportionation is indeed an insulator, although this picture cannot fully describe the non-magnetic insulating state that occurs for the majority of the rare-earth ions.
Two outstanding theoretical questions remain unanswered to this day however. The first one is whether it is at all possible to construct a low-energy description of nickelates and of their MIT in terms of low-energy electronic states only. By low energy, we mean a two-band (per nickel site) picture involving only states resulting from the strong hybridization between oxygen and nickel atomic states. This question was previously addressed by Lee, Chen and Balents in the weak-coupling limit, mostly in connection with ordered states Lee et al. (2011a, b). The second question is why the metallic state of these materials is so easily destabilized into an insulator with bond-length disproportionation and lower crystal symmetry. These are the questions that we set out to answer in the present paper.
Our answer to the first question is in fact remarkably simple. We find that an effective two-band description is indeed possible, provided that the effective low-energy interaction between two electrons with parallel spin in different orbitals is smaller than the energy difference between inequivalent nickel sites. Since is zero in the orthorombic phase and remains a small energy scale in the monoclinic phase (our estimate for LuNiO3 is eV), this implies that has to be taken small or even slightly negative, in qualitative agreement with the negative charge-transfer picture. We emphasize that in this description and, especially, are not the values for atomic-like localized nickel states but rather renormalized low-energy values appropriate for the covalent states. We explicitly construct such a low-energy model by performing electronic structure calculations of LuNiO3 in both the high-temperature orthorhombic and low-temperature monoclinic structures. By exploring the phase diagram of this model as a function of and using DMFT, we show that a consistent description of both the metallic and the insulating phases can be obtained.
Furthermore, our low-energy description also provides an insight into the second question. We show that the phase-diagram of this model as a function of and changes drastically as the Hund’s coupling is increased. When is small (), a symmetry breaking transition of the metal into a spontaneously disproportionated insulating state takes place. This confirms the importance of Hund’s coupling for these materials Mazin et al. (2007) and provides a new low-energy perspective on its physical relevance.
Our results also clearly establish that the homogeneous quarter-filled Mott transition scenario is untenable and that the MIT is a cooperative effect between the electronic degrees of freedom and the lattice distortion, which plays an essential role. Our description has direct implications for experiments probing excitations in both phases, such as optical spectroscopy, as discussed at the end of the paper.
This article is organized as follows. In Sec. II we introduce the low-energy model and discuss the electronic structure of both the high- orthorombic and low- monoclinic phases of LuNiO3 . In Sec. III, we then explore the phase diagram of this model using DMFT, for both phases, as a function of and and identify the region of interaction parameters which is appropriate to the description of nickelates. In Sec. IV, we provide a qualitative understanding of the physics of the problem, by considering a simplified model in which can be varied continuously, and demonstrate the sensitivity to site-disproportionation when the Hund’s coupling is large enough. Finally, in Sec. V we discuss consequences for experiments such as photoemission, optical spectroscopy and magnetic probes such as NMR, focusing on relevant physical observables.
II Electronic structure and low-energy model
II.1 Electronic structure of LuNiO3
 |
 |
 |
 |
To determine the appropriate low-energy description for LuNiO3, we first study its electronic structure using density-functional theory in the local density approximation (DFT-LDA).
The high-temperature (metallic) phase of all rare-earth nickelates that undergo an insulator-to-metal transition occurs in the GdFeO3 type orthorhombic structure with the space group . There are four formula units per unit cell, corresponding to a enlargement with respect to the undistorted cubic structure. The orthorhombic structure derives from the undistorted structure following octahedral rotations of type in Glazer’s notation Glazer (1972, 1975). In the low-temperature insulating phase, there is a symmetry breaking of the Ni sites into two sublattices such that the volume of the NiO6 octahedra in one sublattice increases, which simultaneously results in the decrease of the volume of the corner-shared NiO6 octahedra in the other sublattice. The resulting structure is monoclinic with the space group . The volume of the long-bond (LB) octahedra is Å3, and that of the short-bond (SB) ones is Å3, a difference of %. The average Ni-O bond-length differs by %.
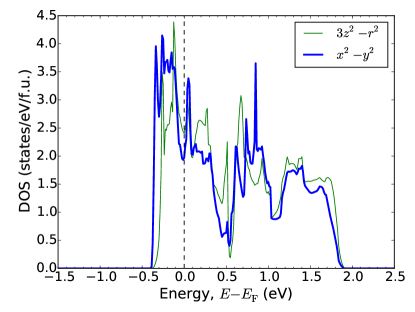
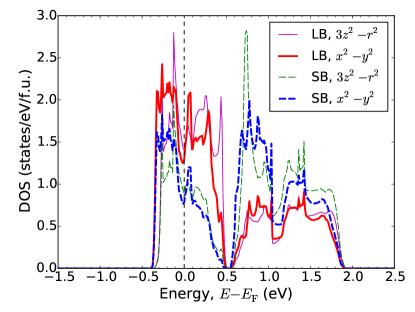
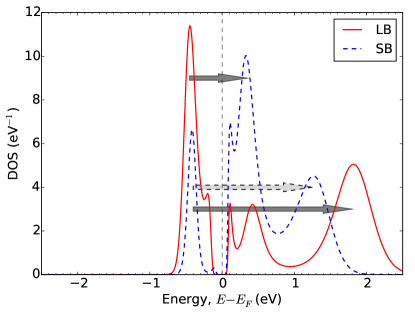
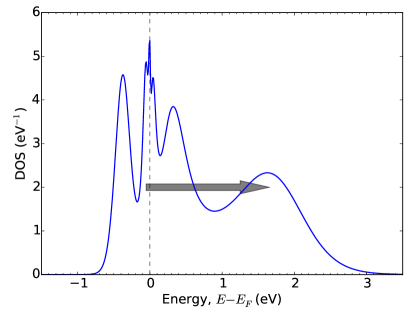
The calculated DFT-LDA bandstructure is displayed in Fig. 1 for both the high-temperature orthorhombic structure (top panel) and the low-temperature monoclinic structure (bottom panel). The corresponding density of states (DOS) of the bands are displayed in Fig. 2. The details of the calculations are provided in Appendix A. In both structures, the bands around the Fermi level derive from the states, which are built out of strongly hybridized Ni and O orbitals, reflecting the strong covalency in this material. The manifold extends from to eV relative to the Fermi level, corresponding to an overall bandwidth eV, and is well separated from other bands (such as ). There are eight spin-degenerate bands within this manifold as there are four Ni per primitive unit cell and two -orbitals per Ni.
In the orthorhombic structure, the bands in the manifold cross at isolated points within the energy window between and eV. Correspondingly, the DOS in Fig. 2 (top panel) displays a dip in this energy range. The degeneracies at these crossing points are lifted in the monoclinic structure, and the manifold is split into two distinct sub-manifolds, each comprising four bands. The lower partially occupied sub-manifold has a bandwidth eV, significantly reduced as compared to . The two sub-manifolds are separated by a characteristic energy scale eV.
The physics underlying the splitting of the manifold into two subsets as one goes from the orthorhombic to the monoclinic structure is quite easily explained. There is smaller Ni -O covalency in the LB octahedra because of the larger interatomic distance, which pushes the states corresponding to the LB octahedra to lower energies. The opposite applies to the SB octahedra. Hence, the lower submanifold has a stronger Ni-LB character, as well as a smaller bandwidth, while the upper submanifold has a stronger Ni-SB character and a larger bandwidth. This is illustrated by the ‘fat-band’ representation in Fig. 1 used to display the Ni-LB site-character. The splitting between the two submanifolds can be related to the difference of on-site energies (averaged over the two orbitals) between the LB and SB nickel sites. We obtain (in eV): , and , yielding eV, in good agreement with the observed band-splitting. Because is a rather small energy scale (in comparison, for example, with ), the two bands actually have a rather mixed character of Ni-LB and Ni-SB, although at degeneracy points the lower (upper) manifold is entirely LB (SB), as expected. In the limit of large however, the lower manifold would be fully LB and the upper one fully SB, with a smooth connection between the small and large limits.
Correspondingly, the charges (electronic occupancies) of the two types of nickel sites are different. At the LDA level, we find electrons for the LB sites and electrons for the SB sites. One should be careful, however, in interpreting these numbers in connection with charge disproportionation between the two types of sites. We emphasize that these are the occupancies referring to the strongly hybridized, extended, low-energy states. The occupancies of these states cannot be interpreted as the valence state of the localized atomic-like nickel orbitals.
We finally observe that the energy difference between the and orbitals on a given site is a smaller energy scale than and, of course, the bandwidth, emphasizing that the Jahn-Teller effect plays little role.
II.2 Low energy Hamiltonian
In order to construct a low-energy Hamiltonian for the states, we need a set of site-centered localized wave-functions describing these states. To this aim, we have built maximally localized Wannier functions using the procedure of Refs. Marzari and Vanderbilt (1997); Mostofi et al. (2008); Marzari et al. (2012). We used an energy window of eV that encloses the eight bands of the manifold and obtain two Wannier orbitals per each Ni site corresponding to the two -like orbitals 111 The spatial spreads which are minimized in the maximally localized Wannier came out to be NiLB1: 4.32, NiLB2: 4.42, NiSB1: 4.17, NiSB2: 4.17 (in Å2)..
We consider the following low-energy Hamiltonian, which contains a kinetic energy (band-structure) term and an interaction term :
| (1) |
The kinetic energy term reads:
| (2) |
In this expression, is the band dispersion calculated above for either the orthorhombic or the monoclinic structure. The eight different bands are labeled by the index , and the sum over pseudomomenta runs over the Brillouin zone of each structure. The operator creates an electron in one of the bands with spin .
In Eq. (1), the index refers to sites of the crystal lattice (with sites per unit cell and two types of inequivalent sites in the monoclinic structure corresponding to the LB and SB octahedra). On each site, we make the simplest possible choice for , namely a Kanamori Hamiltonian, appropriate to two orbitals per site with local interactions only:
| (3) | |||
Here, the orbitals (labeled by ) refer to the site-centered Wannier functions constructed above. In our calculations we omit the spin-flip and pair-hopping terms for computational efficiency. Although they are important for multiplet degeneracies and magnetic properties, the shift of the phase boundaries caused by omitting them is relatively small Pruschke and Bulla (2005). Therefore, we expect that such an approximation does not affect the qualitative conclusions of this article.
III Phase transitions and crossovers
III.1 Basic strategy
Here we investigate the phase diagram of the above low-energy model, as a function of and , for the two band structures corresponding to the orthorombic and monoclinic phases. Because and are effective low-energy coupling constants, their actual values are not known a priori. Our basic strategy is to find out whether a range of coupling exists in which the orthorombic structure is metallic while the monoclinic structure is insulating. This range should not be too narrow so that the effective low-energy description does not rely on excessive fine-tuning of the coupling constants. Furthermore, it should correspond to a range of couplings which is physically reasonable.
In this article, we shall not address the issue of estimating the low-energy values of and from first-principles methods. Progress has been made recently in the determination of screened Coulomb interaction parameters using methods such as constrained RPA Aryasetiawan et al. (2004) and combinations of GW and DMFT Biermann et al. (2003). Further work is needed however to assess the reliability of these methods in constructing low-energy models of late transition metal oxides, i.e. for projecting out the ligand states despite their strong hybridization. This is of particular concern here, since ligand holes and negative charge-transfer physics are likely to play an important role. Furthermore, no application of these methods to nickelates have yet appeared in the literature, to our knowledge.
Finally, we emphasize that we shall limit ourselves to the non-magnetic phases since our focus is on the metal to paramagnetic insulator transition of nickelates with heavier rare-earths. The interplay with magnetism and the simultaneous insulating and magnetic transition of Pr and Nd compounds is left for future investigations.
III.2 Phase diagram
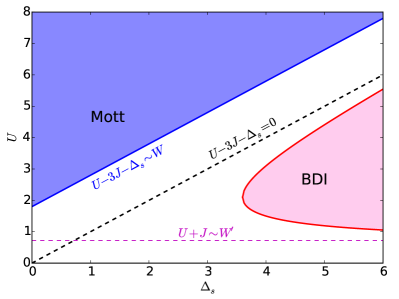
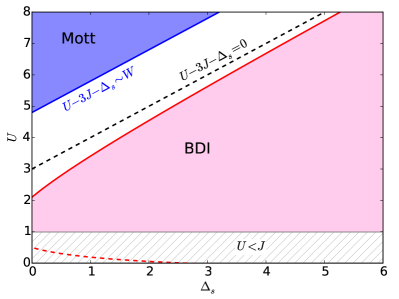
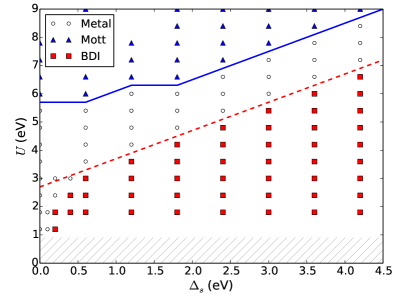
In Fig. 3, we display the phase diagram of the low-energy model for the orthorombic (top) and monoclinic (bottom) structures as a function of and . These results were obtained using DFT+DMFT applied to the model given by Eqs. (1)-(3) with the band structure described in Section II.1. The details of the calculations are provided in Appendix A.
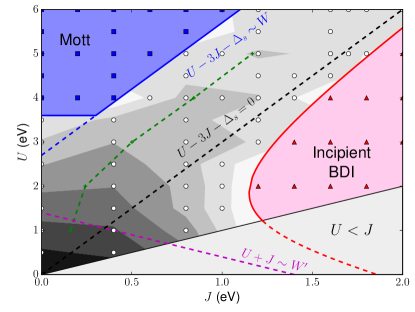
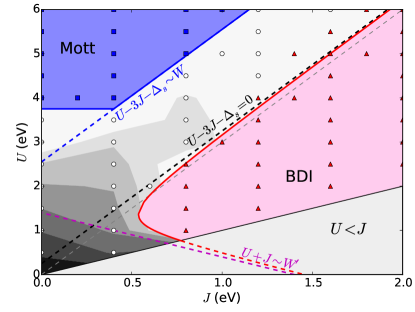
Both phase diagrams display two insulating phases separated by a metallic phase. In order to facilitate the understanding of the different regimes, it is useful to consider the physically important crossover line displayed as a black dashed straight line on the figure. This line is defined by comparing the energies, in the atomic limit, of the configuration in which two neighbouring nickel sites are each occupied by a single electron () versus the one in which full disproportionation takes place (, with the two electrons residing on the LB-nickel site). The energy of the former configuration is zero, while the one of the latter is . This yields the following atomic-limit estimate:
| (4) |
corresponding to the black dashed line displayed on both panels of Fig. 3. For the upper panel, corresponding to the orthorombic structure in which all sites are equivalent and , this reduces to . Below this line the smaller entry of the coupling constant matrix (i.e. ) becomes negative, corresponding to the low-energy description of a small or negative charge-transfer gap. For the monoclinic phase of LuNiO3 (bottom panel), we have used our LDA estimate eV in drawing the crossover line.
The region of the phase diagram well above this crossover line is quite conventional. As is increased, a Mott transition is encountered. For the orthorhombic structure, this is simply the Mott transition of a quarter-filled two-orbital system corresponding to the homogeneous filling of one electron per site. At , we find this transition to occur at eV, about twice the bandwidth . A non-zero value of the Hund’s coupling increases this critical value, in agreement with established knowledge Georges et al. (2013); van der Marel and Sawatzky (1988); de’ Medici (2011); de’ Medici et al. (2011), roughly according to (indicated as a straight blue line on the figure). For the monoclinic structure, the location of the Mott critical boundary is not very significantly affected. This is expected (see Sec. IV) in view of the rather small value of : in the regime , the difference in the on-site energy due to the bondlength disproportionation is a small effect and the kinetic energy is still set by the full bandwidth . In particular, for a typical physical value of eV likely to be appropriate for nickelates, we observe that the Mott transitions of the two structures occur at values of ’s which are quite close to each other. As a result, explaining that the orthorhombic structure is metallic while the monoclinic one is insulating would require fine-tuning of the interaction parameters. Furthermore, in this regime the large suppresses the charge disproportionation that is already present at the DFT level, yielding a Mott insulating state that is qualitatively like the Mott insulating solution for the orthorhombic phase. Hence, we conclude that the regime (above the dashed black crossover line) is not the relevant one for a proper low-energy description of nickelates. This theoretical consideration provides clear support to the fact that the metal-insulator transition of nickelates cannot be viewed as the homogeneous Mott transition of a quarter-filled band, as mentioned in the introduction.
Let us now turn our attention to the regime on the lower side of the crossover line. There we see that, for large enough , an insulating phase is obtained, which is characterized by a significant disproportionation of the occupancy between two neighboring nickel sites. For this reason, this phase is labeled ‘bond disproportionated insulator’ (BDI) on the phase diagram of Fig. 3 (one may also refer to it as a ‘site-selective Mott insulator’ as in Park et al. (2012), or as a ‘hybridization-wave insulator’).
For the monoclinic structure, where the symmetry between the two nickel sublattices is explicitly broken, this BDI phase has a much larger extension. It basically covers the whole triangular-shaped area contained between an upper boundary, which happens to be very close to the crossover line , and a lower boundary defined by the straight line (negative-slope dashed magenta line in Fig. 3). The latter expression is again easily rationalized by considering the atomic limit, this time for a half-filled two-orbital shell occupied by two electrons Georges et al. (2013). Indeed, in this case, the effective atomic gap is 222Denoting by the lowest energy of the configuration with electrons in the atomic limit, one has: ., and the relevant bandwidth is corresponding to the lower band manifold.
For the orthorhombic structure, the incipient BDI phase corresponds to a spontaneous breaking of the symmetry, in which two inequivalent nickel sublattices occur (see Fig. 9 below). In this phase a hybridization wave (or a modulation of covalency) develops on Ni-O bonds, which in reality would immediately lead to a corresponding modulation of bond lengths. It is interesting indeed that a homogeneous solution with all equivalent nickel sites becomes unstable when is too negative (and exceeds a critical value). This points to the extreme sensitivity of the system to disproportionation in the ‘small or negative charge-transfer’ regime. It also implies that lattice degrees of freedom are coupled to the electrons in an essential way in this regime.
An important observation, comparing the top and bottom panels of Fig. 3, is that the area covered by the BDI phase in the orthorhombic case is significantly smaller than in the monoclinic case. Although is small, it shifts the BDI boundary to the left by an appreciable amount. Hence, there is a rather extended region of coupling constants in which the orthorhombic structure is metallic, while the monoclinic one is an insulator (BDI). We propose that this is the physical region appropriate for a low-energy description of nickelates. This does not require fine-tuning of the low-energy coupling constants. In Sec. V, we will describe in more detail the behavior of several physical quantities obtained for the values eV and or eV, which lie within this region. These values were chosen for illustrative purposes and correspond to a rather standard value of for nickelates, leaving a more accurate determination of the appropriate low-energy parameters for future investigations.
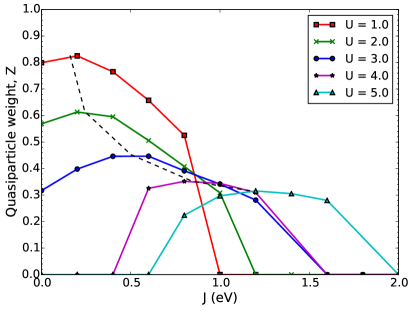
Finally, we briefly discuss the metallic phase separating the two insulating regions (Fig. 3, top panel). In Fig. 4, we display the quasiparticle weight 333The quasiparticle weight is calculated from the real-frequency self-energy as . throughout this metallic phase, as a function of , for several values of . Correspondingly, an intensity map of as a function of and is displayed in Fig. 3 using different levels of grey-shading. The quasiparticle weight decreases as both the Mott phase and the BDI phase are approached (Fig. 3). As a result, it displays a non-monotonous behaviour as a function of the Hund’s rule coupling (Fig. 4). Well to the left of the crossover line , increases as is increased. This is indeed the expected behavour for a quarter-filled correlated metal Georges et al. (2013). In contrast, as the disproportionation line is approached, passes through a maximum and then decreases as is increased, in line with the behaviour of a half-filled correlated metal Georges et al. (2013). The location where is maximum in the plane is indicated as a dashed curve on Fig. 3, which happens to lie well to the left of the disproportionation crossover line. This behaviour also implies, interestingly, that at larger the magnitude of increases as is increased. We note in passing that the parameter set eV for which more detailed calculations will be presented later in this article corresponds to a quasiparticle weight (inverse mass enhancement) (Fig. 4), a reasonable value for metallic nickelates Rajeev et al. (1991); Sreedhar et al. (1992).
In the larger regime, the BDI phase is surrounded by a metallic phase both on the small side and larger side. Hence, as is increased from weak-coupling in this regime, one encounters successively: a metallic phase at small , the BDI insulator, a metallic phase again, and finally the Mott insulating phase at large . The physical nature of the metallic phase in the ‘small or negative charge-transfer regime’ definitely deserves further investigation, using e.g. DMFT techniques. This is relevant, in particular, for a proper low-energy description of metallic LaNiO3.
IV Discussion and Qualitative Insights
The above analysis of the two structures of LuNiO3 reveal that even though is a small energy scale, it has a large effect on the phase diagram: the system is extremely sensitive to disproportionation in the regime when .
To better understand the origin of this sensitivity, we consider a simple model that captures the main features of the real system. The model involves two sublattices with on-site energies split by . Each site carries two orbitals, and the Hamiltonian reads:
| (5) |
where the interaction Hamiltonian is the same as before as given by Eq. (3). The difference in on-site energies induced by bond disproportionation in nickelates is described here by an explicitly introduced parameter . This allows us to study how physical properties change as is varied. In reference to nickelates, we will refer to sites and as LB and SB sites, respectively. We denote by the non-interacting bandwidth when ( for a semi-circular density of states).
Before proceeding to the results of DMFT calculations, let us perform a qualitative analysis of this model. Consider first the case of . A cartoon of the phase diagram is sketched in the top left panel of Fig. 5, with the phase boundaries being derived from qualitative estimates presented in more details in Appendix B. In the limit of large () the model can be viewed as a half-filled lattice of doubly occupied LB-sites connected via indirect hopping mediated by empty SB-sites. A key insight is that this effective hopping depends on the value of . A simple estimate from second order perturbation theory around the atomic limit (appendix B) yields:
| (6) |
Increasing the Coulomb repulsion thus has two antagonistic effects. On the one hand, it induces a Mott transition in this half-filled system. On the other hand, it decreases the energy separation between the LB and SB sites, thus enhancing and driving the system towards a metallic state. Such an ambivalent effect of results in a reentrant behaviour of the metal-BDI-metal transition apparent in Fig. 5: the metal to BDI critical boundary has two branches, a lower one (metal BDI) with critical and an upper one (BDI metal) with critical . A simple estimate for these critical values can be obtained by writing that the critical boundary corresponds to of the order of the effective bandwidth: . Hence, the upper branch of the critical boundary, for which is small, is given by: , while the lower branch for which is given by: . For more detailed expressions, see Appendix B. An important point is that there is a critical value of the site disproportionation energy for which , corresponding to the tip of the lobe of the BDI region on the upper left panel of Fig. 5. Equating the two expressions above, we see that is proportional to the bandwidth (when ). For , no transition to the BDI phase occurs and the system remains metallic (until eventually the Mott phase is reached).
The regime has an entirely different physics, dominated by the Mott transition of a quarter-filled band. The ground-state is now characterized by both LB and SB sites filled by one electron, with the hopping parameter being simply the bare hopping . The lowest-energy excitation is determined by the energy of moving an electron from a SB to a LB, which results in the effective interaction energy (while the energy cost of moving an electron from a LB to a SB site is ). The critical value of is then determined by the bandwidth , which leads to (boundary of the Mott phase in the top left panel of Fig. 5).
Let us now consider a finite Hund’s coupling which, as we shall see, has a major effect on the phase diagram (Fig. 5, top right panel). The crossover line between the quarter-filled and half-filled regimes (which is also the upper asymptotic boundary of the BDI phase at large ) now reads , as discussed in the previous section. Correspondingly, the Mott critical boundary in the quarter-filled region is simply shifted according to . More drastic changes occur in the half-filled regime . Indeed the effective Coulomb energy in this regime is , so that the metal to BDI phase boundary is now given by the criterion: . This is the same expression as the one for , but with crucial renormalizations of the parameters: . Hence, the Hund’s rule coupling effectively increases the site disproportionation energy by . critical disproportionation is dramatically reduced down to , as compared to the case. As a result, there is a critical value of the Hund’s coupling, , such that for the BDI instability takes place already at , which means that in this regime the small or negative charge-transfer metal is spontaneously unstable to site disproportionation.
Let us now turn to numerical simulations of Hamiltonian (5). We performed calculations within DMFT using for simplicity a Bethe lattice (i.e. a semi-circular density of states of width when ). In this case, the DMFT self-consistency relation reads, for each sublattice:
| (7) | |||
| (8) |
where () are the Green’s function of the self-consistent bath for each site, and the corresponding local (impurity) Green’s function. The latter are obtained from using the CT-QMC solver. The hopping parameter eV is chosen to give the bandwidth value eV, very close to that of nickelates. The temperature is set to eV-1.
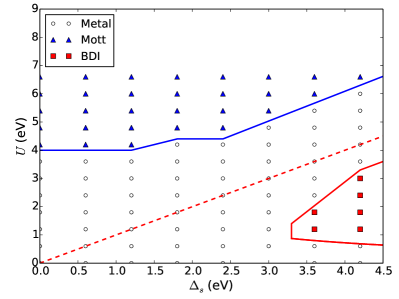
The resulting phase diagrams for and eV (a value relevant for the nickelates) are presented in the bottom left and right panels of Fig. 5, respectively. Apart from some details, the numerical results agree very well with the qualitative analysis performed above, especially regarding the following features: i) the quarter-filled (Mott) and half-filled (BDI) regimes are separated by the crossover line ; ii) there is a critical value of the on-site disproportionation energy below which the system undergoes only a single, Mott-like, transition and above which there are generally three transitions as a function of ; iii) the value of is very sensitive to the Hund’s coupling . At some critical value of the Hund’s coupling (corresponding to ), the phase diagram becomes qualitatively different from that of the case. In particular, the metallic phase at becomes unstable with respect to the BDI phase for all values of . Only when sufficiently large suppresses the site disproportionation is the metallic phase stable, before eventually turning into the Mott phase as is increased further.
In relation to the nickelates, the model calculations reveal that the mechanism underlying the large sensitivity to observed in Fig. 3 is, in fact, tightly related to the effect of the Hund’s coupling on changing the position of the BDI phase boundary. We suggest that the nickelates are poised close to the value . In this regime, the system is highly sensitive to disproportionation, even for small . The estimate makes this a qualitatively reasonable range of parameters. This ties together two observations previously made in the literature: the relevance of the small or negative charge-transfer regime Mizokawa et al. (2000) and the importance of the Hund’s rule coupling Mazin et al. (2007).
V Experimental implications: spectroscopy, local magnetic probes
In this section, we discuss some physical implications of our low-energy description in connection with experiments. We do not aim at being quantitative in the present article. Indeed, the appropriate values of the low-energy parameters and will have to be determined ultimately by quantitative comparison to experimental data, which we leave for future work. Rather, we focus here on the main qualitative points.
V.1 Spectroscopy: photoemission, optics
V.1.1 Single-particle spectral functions
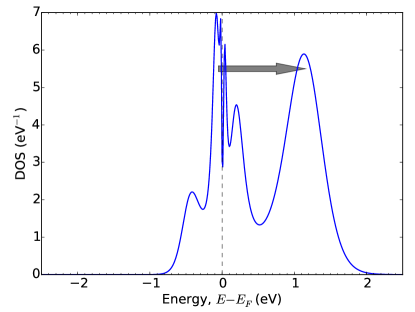
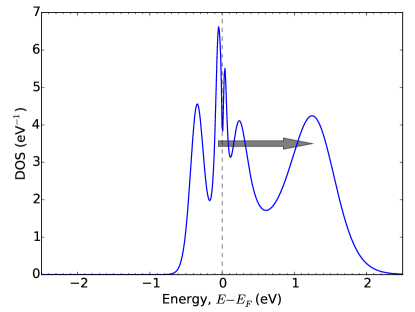
We display in Fig. 6 and Fig. 7 the momentum-integrated spectral function (total density of states) of the metallic state (orthorhombic structure) and of the insulating state (monoclinic structure) for two sets of interaction parameters: eV and eV. These results were obtained by analytically continuing the DMFT Monte-Carlo data to the real-frequency axis (for details, see Appendix A). These two sets of interaction parameters are illustrative of two different regimes for the insulating state. The first one is close to the lower side of the BDI lobe in Fig. 3 (bottom panel), so that the gap is controlled by the proximity to the lower critical boundary . The second one is close to the upper critical boundary and the bond-disproportionation crossover line , so that the gap is controlled by the proximity to this line.
Let us first turn our attention to the spectra of the metallic phase (Fig. 6 and Fig. 7, top panels). They display a peak centered around the Fermi level, corresponding to quasiparticle excitations. This quasiparticle DOS is narrowed down by correlation effects in comparison to the LDA DOS (Fig. 2, top panel), the narrowing being less pronounced for eV than for eV, in line with the smaller value of the quasiparticle weight for the latter ( and , respectively). Side peaks within the lowest (dominantly LB) band, spanning the energy window eV are also apparent. The most prominent spectral feature aside from the central quasiparticle peak is the large peak on the positive energy side, at about eV. This peak is separated from the QP peak by a pronounced dip at eV. The energy of this spectral feature does not depend very much on the value of . Indeed, in Appendix A, we display for completeness the spectra for eV and we see that this high-energy peak is still well below eV in the metallic phase. Note that this large value of the effective is likely to be too large to describe nickelates properly. The dip at eV and prominent peak above this energy scale are already apparent in the LDA DOS of Fig. 2. The dip corresponds to the crossing points between the two band manifolds which are subsequently split-off by the bond disproportionation, and the high-energy peak corresponds to the empty states which form the upper manifold. We observe that the LDA DOS displays another dip at eV corresponding to another set of crossing points in the LDA bandstructure. It may be that such a dip should also be present in the presence of correlations, but that the analytical continuation procedure smears out spectral features and is thus insufficient to reveal it.
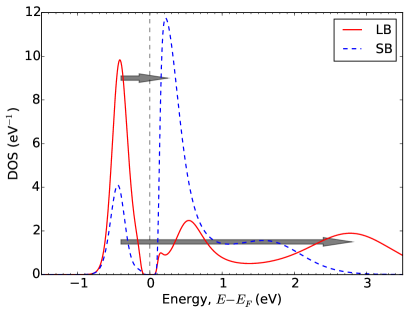
We now turn to the spectra in the bond-disproportionated insulating state, displayed for each type of sites (LB and SB) in Fig. 6 and Fig. 7 (bottom panels, see also Fig. 11 in the Appendix). Below the insulating gap, the spectra display a lower Hubbard band (LHB) corresponding to the removal of a single electron. In the extreme limit of occupancy, this LHB would be entirely of LB nature, and no LHB would be visible for SB sites. Because the charge imbalance is not complete, both sites display a LHB, but its spectral intensity is indeed larger for LB sites, as expected.
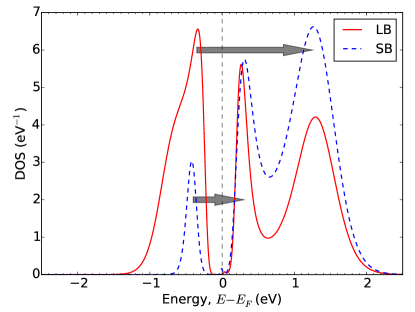
The positive energy states, corresponding to the electron addition spectrum, displays a richer structure. Both the SB and LB spectra reveal two marked spectral features on the positive energy side. Let us designate these two positive-energy spectral peaks for LB sites by and , in increasing order of energies (similarly, , ). By comparing Figs. 6, 7 and 11, we observe that the position of the peaks and are always similar. In contrast, the energy of and are different in general. The energy of is around eV, with little dependence on . At the same time, the energy of clearly increases with . Coincidentally, the energy of and are approximately equal for the parameter set eV, but this does not hold true for the other cases.
V.1.2 Interpretation of the spectral features
A simple analysis in the atomic limit allows us to understand the nature of these spectral features, starting from the extreme limit in which the ground state is . Removing an electron on a LB site corresponds to a transition energy between the final and initial states:
| (9) | |||||
which sets the position of the lower Hubbard band with respect to the Fermi level . Similarly, adding an electron on a LB site (upper Hubbard band for LB sites) corresponds to:
| (10) | |||||
and adding an electron to an SB site yields:
Hence, the energy separation between the LHB and the upper Hubbard band (electron addition peak) corresponding to a LB site reads, in the atomic limit:
| (11) |
while, for a SB site:
| (12) |
Not surprisingly, we recover the two key energy scales discussed above: corresponds to the effective for a half-filled orbital and controls (when compared to ) the lower critical boundary of the BDI state, while is the energy scale controlling bond disproportionation which sets the disproportionation crossover line as well as the upper critical boundary of the BDI state.
These considerations allow us to unambiguously identify the highest of the two LB spectral features, , as the corresponding upper Hubbard band. Indeed its separation from the LHB is quite well approximated by (yielding , and eV for Fig. 6, Fig. 7 and Fig. 11, respectively). This separation is indicated by the longest plain grey arrow on these figures. The above estimate for the UHB of SB sites is also in reasonable agreement with the electron addition peak of highest intensity on SB sites, with an estimated value , and eV for Fig. 6, Fig. 7 and Fig. 11, respectively (also depicted as a plain grey arrow on these figures). We observe that this highest-intensity peak corresponds to the feature for the eV case (Fig. 6), but to the feature for the two other cases. The existence of a second peak (besides the UHB) in the SB spectra, separated by a dip from the other SB spectral peak is, in our opinion, due to the structure of the DOS of the SB upper band manifold already visible at the LDA level. Indeed, we observe that the separation between the two SB spectral features is always of order eV, which is of a magnitude similar to the separation of the two peaks of the upper manifold in the LDA DOS.
The fact that eV and eV are approximately equal for eV explains that the and (UHB) features are, coincidentally, located at approximately equal energies in this specific case. The condition for such a coincidental overlap of the two LB- and SB- UHB is, in the atomic limit from Eqs. (11,12): . For , the LB-UHB lies above the SB-UHB, while the opposite holds true when .
V.1.3 Consequences for optical spectroscopy
These considerations have direct consequences for optical spectroscopy, which can be anticipated by comparing the top and bottom panels of Fig. 6 and Fig. 7 in order to understand how the optical spectra of nickelates change through the MIT. We only provide a qualitative discussion here, leaving a detailed calculation of optical spectra and comparison to experiments for future work.
Optical spectroscopy involves particle-hole transitions, hence energy differences between the main spectral features of the one-particle spectral function displayed in these figures. Of course, these transitions are weighted by matrix elements of the current, which require a detailed calculation of the band velocities (transport function). The current is an inter-site process, which will dominantly couple LB to SB sites, so that we should direct our attention to the energy differences between LB and SB spectral features in the one-particle spectra.
In the metallic phase, we expect the optical conductivity to consist of two main spectral features. A Drude peak at low-energy (with reduced weight ) involving near Fermi level transitions, and an additional feature at eV (indicated by the plain arrow on the top panels of the figures, and rather independent of ), corresponding to the optical transitions between the states near Fermi level and the states forming the upper band submanifold, as discussed above.
In the insulating state, we expect generically three spectral features above the absorption edge set by the gap. The lowest-energy one corresponds to transitions from the LHB to the /lowest spectral feature (indicated by the shortest arrow in the bottom panel of the figures). The highest-energy one corresponds to transitions from the LHB to the highest of the two high-energy spectral features (i.e. for , the LB-UHB, excitation), indicated by the longest arrow on the figures. An intermediate energy optical feature corresponds to the transition between the LHB and the lowest of the two high-energy spectral features (dashed arrow on the figures). As discussed above, the intermediate and high-energy optical transition merge when (as in Fig. 6), leaving only two peaks above the absorption edge.
Hence, the distinctive signature of the MIT is expected to be the splitting of the eV peak in the metallic phase into two (or three) peaks, one of lower and one of higher energy (Figs. 6 and 7). Indeed, such a splitting has been observed in recent optical spectroscopy experiments Ruppen et al. (2014). We propose that our low-energy theory provides a theoretical interpretation of this experimental discovery, and hope to support this claim by explicit calculations of optical spectra in future work.
V.2 Local magnetic moments, NMR and relation to charge disproportionation
We now discuss the consequences of the bond disproportionation for the local magnetic properties of the SB and LB sites in the paramagnetic insulating phase (BDI). As pointed out in Refs. Mizokawa et al. (2000); Mazin et al. (2007); Park et al. (2012); Johnston et al. (2014), in the extreme / picture, one expects the SB octahedra to carry no magnetic moment and the LB ones to carry a full moment. Indeed, in this picturue the spin- moment (corresponding to two electrons with parallel spins in different orbitals in the Ni configuration) on SB octahedra is screened by the two ligand holes, while no such screening takes place on the LB sites. The analogy to a mixed Kondo-insulator (SB sites)/Mott insulator (LB sites) state was emphasized in Ref. Park et al. (2012).
Reproducing such a behaviour is a challenge to any low energy description that does not include explicitly the oxygen states. Here, we show that our low-energy two-orbital model does achieve this goal in the regime .
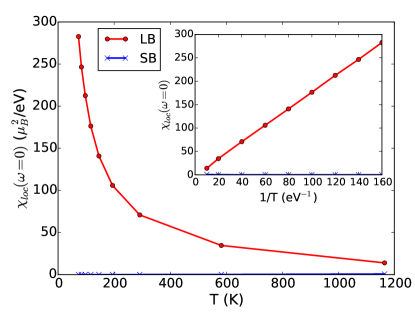
To support this claim, we have calculated the local spin-spin correlation on both the LB and SB sites. In Fig. 8 (top panel), we display this correlation function as a function of imaginary-time in the BDI phase at a temperature eV K. In the bottom panel of the same figure, we display the zero-frequency value of the local susceptibility as a function of temperature. These data clearly signal the presence of a fluctuating local moment on LB sites: does not decay at large (), and follows a Curie law . The corresponding value of the local moment obtained from a fit to is . In contrast, on SB sites and have a very small temperature-independent value, signalling the absence of a local moment.
Obviously, the detection of a clear separation between moment-carrying LB octahedra and non-magnetic (or at least reduced moment) SB octahedra would be a smoking gun for the physical picture proposed in earlier works and for the low-energy description introduced here. Further studies of the insulating phase of nickelates in the range using local magnetic probes such as NMR or muon-diffraction, or inelastic neutron scattering is therefore highly desirable.
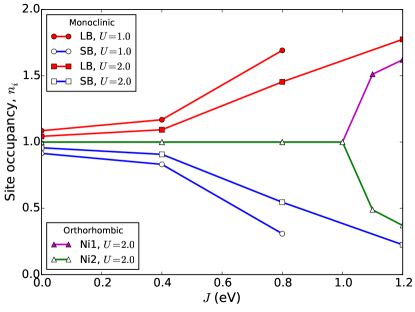
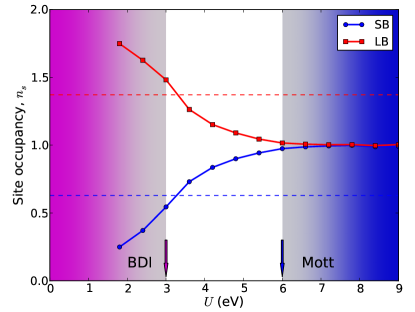
Finally, we show the evolution of the LB and SB site occupancies as a function of in Fig. 9. The charge disproportionation is clearly enhanced as one approaches the BDI phase. In contrast, it is suppressed as one moves towards the Mott phase, as indicated by a smaller difference of the site occupancies for the larger value of . It is important to note that the occupancies should not be interpreted as indicative of the valence of nickel atoms because the orbitals are antibonding linear combination of the Ni and O orbitals. As the states have substantial O character, the disproportionation of the occupancy could primarily be the result of a change in occupation of the O states (ligand holes). Some disproportionation of the atomic Ni charge cannot be ruled out within our low energy model, however.
Furthermore, the charge of an ion in a solid compound with strongly covalent bonds is not a well-defined quantity. This implies that x-ray or neutron scattering experiments do not distinguish whether the disproportionation takes place within the atomic-like Ni orbitals, states in the small or negative charge transfer regime, or the antibonding states. Probes such as polarized soft x-ray absorption (XAS) or resonant inelastic x-ray scattering (RIXS) spectroscopy are actually sensitive to the occupancy and symmetry of the antibonding valence states, since in those spectroscpies an electron is transferred from a core state into such an empty state. Therefore, we believe that available experimental results Bodenthin et al. (2011); Wu et al. (2013) usually interpreted as ‘charge’ disproportionation or ‘charge’ ordering are actually consistent with a disproportionation of the occupancies.
In our low-energy description of the nickelates, the bond disproportionation plays an essential role in the electronic properties. This strong coupling between the lattice and electronic properties should also manifest in the phonon properties. In particular, the zone-center Raman mode corresponding to the expansion and compression, respectively, of alternate sets of corner-shared NiO6 octahedra of the orthorhombic phase should show a large and increasing linewidth as the temperature is lowered down to . In addition, this phonon mode should soften and show an unstable behavior upon reaching .
VI Conclusion and Perspectives
We have used combined DFT+DMFT calculations to construct and study in detail a low-energy model for the rare-earth nickelates that describes the metal-insulator and orthorhombic-monoclinic structural transitions observed in these materials. The DFT calculations show that the manifold is well separated and quarter-filled in the high-temperature orthorhombic phase. The major effect of the bond disproportionation in the low-temperature monoclinic phase is to split the manifold into two sub-manifolds. This reduces the average degeneracy and the effective bandwidth. We capture these features of the electronic structure by constructing a simple model with only two orbitals per Ni site and a parameter that describes the difference in energy between the states at the two bond-disproportionated Ni sub-lattices. Although we explicitly construct this model for LuNiO3, our model is generic and applicable to other members of the rare-earth nickelates family.
We solve this model using DMFT calculations for a wide range of values of the on-site Coulomb repulsion and Hund’s rule coupling for the physically relevant small values of , as well as for larger values. We find that the physics of nickelates can be consistently accounted for in the regime where is small or negative, without a fine tuning of the interaction parameters. In particular, a bond-disproportionated paramagnetic insulating state is stabilized for a wide range of interaction parameters in this regime. Furthermore, we find that in this regime and for large enough (but realistic) values of , the metallic state is spontaneously unstable to disproportionation. This rationalizes the large sensitivity to bond-length disproportionation observed in these materials.
Our minimal theory demonstrates that the MIT of nickelates cannot be viewed as the Mott transition of a homogeneously quarter-filled band. Furthermore, it emphasizes that a small or negative charge transfer energy, a sizeable Hund’s coupling and a strong coupling to lattice effects through bond-length disproportionation are essential to the physics, hence confirming and unifying the proposals of previous authors Mizokawa et al. (2000); Mazin et al. (2007); Park et al. (2012); Johnston et al. (2014).
The main advantages of the minimal low-energy description proposed here is its universality: it can easily be applied to other nickelates and other materials with similar physics. Quantitative calculations using DMFT for this low-energy model are considerably simpler than a full-fledge DFT+DMFT treatment involving both transition-metal and ligand states, and are free of the ambiguities associated with double-counting. The one-particle part of the low-energy Hamiltonian can be easily adapted to the specific material of interest using standard electronic structure and Wannier functions techniques. Furthermore, as demonstrated in this article, the main aspects of the phase diagram and underlying physics of this low-energy model can be rationalized and explained using simple qualitative arguments.
In contrast, the coupling constants and entering our theory are low-energy parameters that we did not attempt to derive from first principles. We would like to propose this as an important physical test of first-principle methods aiming at the determination of such low-energy parameters. Whether these methods can access the regime of small or negative charge transfer and whether they will support the view that nickelates (and other materials with similar physics) belong to this regime is an outstanding challenge.
Finally, we have outlined some experimental implications of the low-energy effective theory proposed in this paper. Some of these appear to be consistent with very recent experimental findings from optical spectroscopy Ruppen et al. (2014). More theoretical and experimental work is obviously needed however to put our low-energy description to the test.
Acknowledgements.
We are grateful to Michel Ferrero for discussions and help with DMFT calculations, and to Dirk van der Marel for sharing with us his optical data prior to publication. We also acknowledge useful discussions with Sara Catalano, Stefano Gariglio, Marta Gibert, Jean-Marc Triscone and all other members of the Triscone group in Geneva, as well as with Leon Balents, Philipp Hansmann, Andrew J. Millis, Leonid Pourovskii, George Sawatzky and Michel Viret. Support for this work was provided by the Swiss National Science Foundation (grant 20021-146586 and NCCR-MARVEL), by a grant from the European Research Council (ERC-319286 QMAC), and by the Swiss National Supercomputing Centre (CSCS) under project ID s497.Appendix A Methods and technical information on the calculations
A.1 Electronic structure calculations
The electronic structure calculations presented in this article were obtained within the local density aproximation (LDA) using the general full-potential linearized augmented planewave method as implemented in the WIEN2k software package Blaha et al. (2001). Muffin-tin radii of , , and a.u. for Lu, Ni, and O, respectively, were used. An -point grid was used to perform the Brillouin zone integration in the self-consistent calculations. The planewave cutoff was set by , where is the planewave cutoff and is the smallest muffin-tin radius used in the calculations. The calculations were performed at experimental values of the lattice parameters and atomic positions, as given for LuNiO3 in Ref. Alonso et al. (2001) at a temperature of K for the orthorhombic structure and of K for the monoclinic structure. In the orthorhombic structure, the Ni-O-Ni angles are 145∘ and 143∘ along the plane and axis, respectively (they would be 180∘ in the hypothetical undistorted cubic structure). Similar values of the angles hold in the monoclinic structure. Such relatively large rotations induce a clear separation between the manifold of the Ni-bands and that of the Ni- ones and significantly reduce the bandwidth of the manifold (by approximately a factor of two, as compared to the cubic structure).
A.2 DMFT calculations
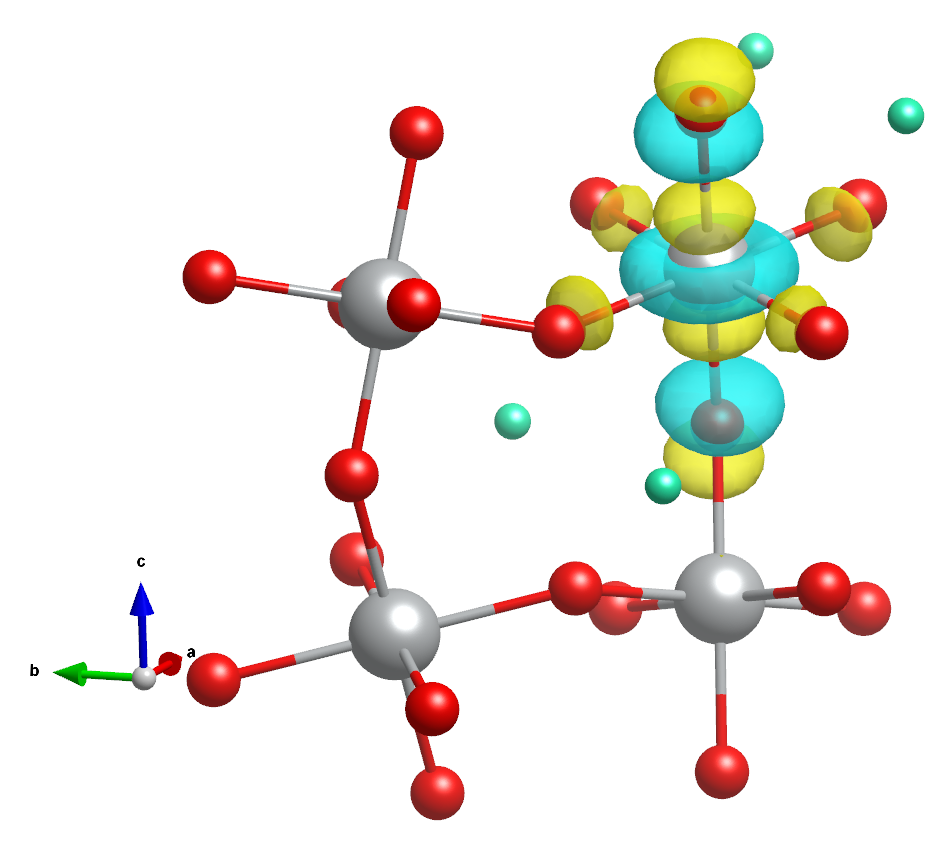
All DMFT calculations presented in this paper have been performed using the continuous-time hybridization expansion Monte Carlo solver Gull et al. (2011) as implemented in the TRIQS software library Ferrero and Parcollet . The local Green’s function have been sampled in Legendre basis Boehnke et al. (2011) and analytical continuation has been performed using a maximum entropy (MaxEnt) method. Combined DFT+DMFT calculations have been done by making use of two different interfaces: one based on maximally localized Wannier functions (MLWF) Marzari and Vanderbilt (1997); Mostofi et al. (2008); Marzari et al. (2012) constructed from the WIEN2k band structure and another one based on projector localized orbitals (PLO) Amadon et al. (2008) obtained from the Vienna ab-initio simulation package (VASP) Kresse and Joubert (1999); Kresse and Hafner (1993); Kresse and Furthmüller (1996) (VASP band structure have been calculated for the same structure parameters as given in the previous subsection, with the k-mesh containing points and the plane-wave cutoff being eV). Examples of the resulting Wannier functions are presented in Fig. 10. Both approaches, MLWF and PLO, lead to almost identical outcomes (including the band structure) and we have thus checked that our results and conclusions are not sensitive to a particular choice of the DFT+DMFT method.
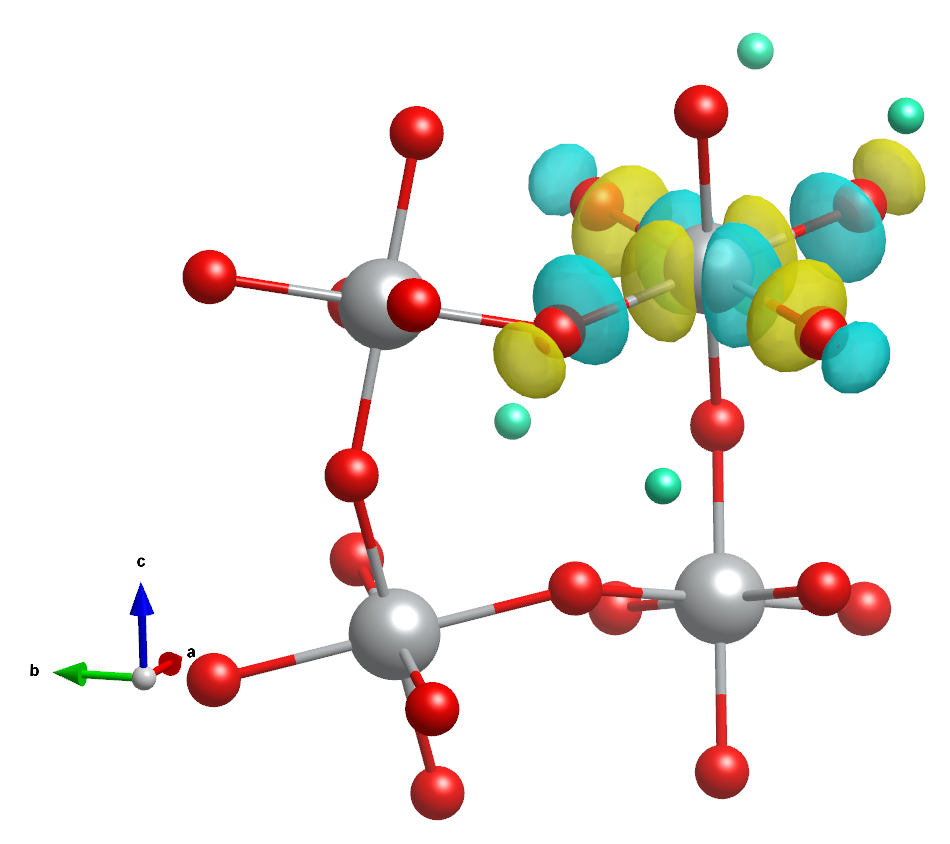
For MLWFs (PLOs) we have used an energy window of eV ( eV) which encloses the eight bands of the manifold, and obtain two Wannier functions per each Ni site, corresponding to the two -like orbitals. The spatial spreads of the MLWFs which were minimized using Wannier90 Mostofi et al. (2008) came out to be NiLB1: 4.32, NiLB2: 4.42, NiSB1: 4.17, NiSB2: 4.17 (in Å2).
Appendix B Qualitative analysis of the two-sublattice two-orbital model
We start from a Hamiltonian for a two-sublattice model with nearest- (NN), , and next-to-nearest-neighbor (NNN), , hoppings,
| (13) |
where the first summation is over pairs of NN sites , , belonging to the two different sublattices and , while the second summation is over pairs of next-to-nearest-neighbor (nnn) sites or belonging to the same sublattice. This Hamiltonian is slightly more general than Eq. (5) because it also includes the nnn hopping, introduced here to have a more physically meaningful limit ; we always assume that . The bare bandwidth can, thus, be still estimated (for a Bethe lattice) as for .
Consider first the case of . In the limit of large the model can be viewed as a half-filled lattice of doubly occupied LB-sites connected via indirect hopping mediated by empty SB-sites. At , the effective hopping is simply (provided that ), and the system is always metallic (with a small bandwidth). At finite the energy of the doubly occupied LB-sites is lifted by and the indirect hopping is now given by
| (14) |
with the corresponding bandwidth .
At some critical value the LB-sublattice will experience a Mott transition. For , this condition leads to a critical value . More generally, setting in Eq. (14) (and implicitly extending the range of validity of this formula to ) we get a quadratic equation for ,
| (15) |
leading to two solutions
| (16) |
with , , provided that . When , the equation has no real solutions implying that the system is metallic in the entire region .
In the limit we can estimate the two critical points as
| (17) | ||||
| (18) |
which emphasizes the physical meaning of the asymptotic phase boundary and also shows that in the limit the lower critical value is entirely determined by the nnn hopping.
This simple estimate provides us with an important insight into the peculiar behavior of the model for . The main conclusion is that the phase diagram (see the top left panel of Fig. 5) of such a system is characterized by two transitions Metal BDI and BDI Metal at and , respectively, provided that the site splitting is larger that some critical value . As an illustrative example, the evolution of the site occupancy with increasing for a model calculation (as described in Section IV)is demonstrated in Fig. 12. For smaller the system will remain metallic at all values of .
The above considerations can now be extended to . Now, in the large- limit the two electrons on LB-sites will occupy different orbitals, with the electron spins being aligned on one site and with the LB-sublattice being antiferromagnetically ordered. The effective hopping in this case is estimated as
| (19) |
and, importantly, the critical value of is determined by the relation appropriate for a half-filled band. The equation for now reads
| (20) |
where , with the two solutions
| (21) | ||||
| (22) | ||||
| (23) |
provided that . The upper asymptotic boundary is now shifted by compared to the case wtih and it is defined by the equation . As to the lower critical value it can now easily become negative implying that the metallic phase is unstable even for small values of (note, also, that the two-sublattice model becomes generally unstable whth respect to even stronger charge disproportionation for , as mentioned in the main text).
This solution reveals the drastic effect of on the behavior of the system. Indeed, the two roots in (23) are real provided: , with . One sees that the critical disproportionation is now dramatically reduced by . As a result, there is a critical value of the Hund’s coupling, , above which the system is expected to disproportionate spontaneously even at . The phase diagram for this case is sketched in the top right panel of Fig. 5.
References
- Torrance et al. (1992) J. B. Torrance, P. Lacorre, A. I. Nazzal, E. J. Ansaldo, and C. Niedermayer, Phys. Rev. B 45, 8209 (1992).
- Medarde (1997) M. L. Medarde, J. Phys.: Condens. Matter 9, 1679 (1997).
- Catalan (2008) G. Catalan, Phase Transitions 81, 729 (2008).
- Goodenough and Raccah (1965) J. Goodenough and P. Raccah, Journal of Applied Physics 36, 1031 (1965).
- Jaramillo et al. (2014) R. Jaramillo, S. D. Ha, D. M. Silevitch, and S. Ramanathan, Nature Physics 10, 304 (2014).
- Alonso et al. (1999) J. A. Alonso, J. L. García-Muñoz, M. T. Fernández-Díaz, M. A. G. Aranda, M. J. Martínez-Lope, and M. T. Casais, Phys. Rev. Lett. 82, 3871 (1999).
- Alonso et al. (2000) J. A. Alonso, M. J. Martínez-Lope, M. T. Casais, J. L. García-Muñoz, and M. T. Fernández-Díaz, Phys. Rev. B 61, 1756 (2000).
- Alonso et al. (2001) J. A. Alonso, M. J. Martínez-Lope, M. T. Casais, J. L. García-Muñoz, M. T. Fernández-Díaz, and M. A. G. Aranda, Phys. Rev. B 64, 094102 (2001).
- Piamonteze et al. (2005) C. Piamonteze, H. C. N. Tolentino, A. Y. Ramos, N. E. Massa, J. A. Alonso, M. J. Martínez-Lope, and M. T. Casais, Phys. Rev. B 71, 012104 (2005).
- Scherwitzl et al. (2009) R. Scherwitzl, P. Zubko, C. Lichtensteiger, and J.-M. Triscone, Appl. Phys. Lett. 95, 222114 (2009).
- Scherwitzl et al. (2010) R. Scherwitzl, P. Zubko, I. G. Lezama, S. Ono, A. F. Morpurgo, G. Catalan, and J.-M. Triscone, Adv. Mater. 22, 5517 (2010), ISSN 1521-4095.
- Scherwitzl et al. (2011) R. Scherwitzl, S. Gariglio, M. Gabay, P. Zubko, M. Gibert, and J.-M. Triscone, Phys. Rev. Lett. 106, 246403 (2011).
- Zubko et al. (2011) P. Zubko, S. Gariglio, M. Gabay, P. Ghosez, and J.-M. Triscone, Annu. Rev. Condens. Matter Phys. 2, 141 (2011).
- Rondinelli and Spaldin (2011) J. M. Rondinelli and N. A. Spaldin, Adv. Mater. 23, 3363 (2011).
- Hwang et al. (2012) H. Y. Hwang, Y. Iwasa, M. Kawasaki, B. Keimer, N. Nagaosa, and Y. Tokura, Nat. Mater. 11, 103 (2012), ISSN 1476-1122.
- Disa et al. (2013) A. S. Disa, D. P. Kumah, J. H. Ngai, E. D. Specht, D. A. Arena, F. J. Walker, and C. H. Ahn, APL Mater. 1, 032110 (2013).
- Liu et al. (2013) J. Liu, M. Kargarian, M. Kareev, B. Gray, P. J. Ryan, A. Cruz, N. Tahir, Y.-D. Chuang, J. Guo, J. M. Rondinelli, et al., Nat. Commun. 4, 2714 (2013), eprint 1311.4611.
- Zhou et al. (2000) J.-S. Zhou, J. B. Goodenough, B. Dabrowski, P. W. Klamut, and Z. Bukowski, Phys. Rev. Lett. 84, 526 (2000).
- Wang et al. (2012) X. Wang, M. J. Han, L. de’ Medici, H. Park, C. A. Marianetti, and A. J. Millis, Physical Review B 86, 195136 (2012), ISSN 1098-0121.
- Zhou and Goodenough (2004) J.-S. Zhou and J. B. Goodenough, Phys. Rev. B 69, 153105 (2004).
- Medarde et al. (1998) M. Medarde, P. Lacorre, K. Conder, F. Fauth, and A. Furrer, Phys. Rev. Lett. 80, 2397 (1998).
- Medarde et al. (1997) M. Medarde, P. Lacorre, K. Conder, J. Rodríguez-Carvajal, S. Rosenkranz, F. Fauth, and A. Furrer, Physica B 241, 751 (1997).
- Caviglia et al. (2012) A. D. Caviglia, R. Scherwitzl, P. Popovich, W. Hu, H. Bromberger, R. Singla, M. Mitrano, M. C. Hoffmann, S. Kaiser, P. Zubko, et al., Phys. Rev. Lett. 108, 136801 (2012).
- Staub et al. (2002) U. Staub, G. I. Meijer, F. Fauth, R. Allenspach, J. G. Bednorz, J. Karpinski, S. M. Kazakov, L. Paolasini, and F. d’Acapito, Phys. Rev. Lett. 88, 126402 (2002).
- Caytuero et al. (2007) A. Caytuero, H. Micklitz, M. M. Abd-Elmeguid, F. J. Litterst, J. A. Alonso, and E. M. Baggio-Saitovitch, Phys. Rev. B 76, 193105 (2007), ISSN 1098-0121.
- Medarde et al. (2008) M. Medarde, M. T. Fernández-Díaz, and P. Lacorre, Phys. Rev. B 78, 212101 (2008).
- Bodenthin et al. (2011) Y. Bodenthin, U. Staub, C. Piamonteze, M. García-Fernández, M. J. Martínez-Lope, and J. A. Alonso, J. Phys.: Condens. Matter 23, 036002 (2011).
- Demourgues et al. (1993) A. Demourgues, F. Weill, B. Darriet, A. Wattiaux, J. Grenier, P. Gravereau, and M. Pouchard, Journal of Solid State Chemistry 106, 330 (1993).
- Mizokawa et al. (2000) T. Mizokawa, D. I. Khomskii, and G. A. Sawatzky, Phys. Rev. B 61, 11263 (2000).
- Mizokawa et al. (1991) T. Mizokawa, H. Namatame, A. Fujimori, K. Akeyama, H. Kondoh, H. Kuroda, and N. Kosugi, Phys. Rev. Lett. 67, 1638 (1991).
- Mizokawa et al. (1994) T. Mizokawa, A. Fujimori, H. Namatame, K. Akeyama, and N. Kosugi, Phys. Rev. B 49, 7193 (1994).
- Ushakov et al. (2011) a. V. Ushakov, S. V. Streltsov, and D. I. Khomskii, J. Phys.: Condens. Matter 23, 445601 (2011), ISSN 1361-648X.
- Park et al. (2012) H. Park, A. J. Millis, and C. A. Marianetti, Phys. Rev. Lett. 109, 156402 (2012).
- Park et al. (2014) H. Park, A. J. Millis, and C. A. Marianetti, Phys. Rev. B 89, 245133 (2014).
- Lau and Millis (2013) B. Lau and A. J. Millis, Phys. Rev. Lett. 110, 126404 (2013).
- Johnston et al. (2014) S. Johnston, A. Mukherjee, I. Elfimov, M. Berciu, and G. A. Sawatzky, Phys. Rev. Lett. 112, 106404 (2014).
- Goodenough (1996) J. B. Goodenough, J. Sol. State Chem. 127, 126 (1996).
- Mazin et al. (2007) I. I. Mazin, D. I. Khomskii, R. Lengsdorf, J. A. Alonso, W. G. Marshall, R. M. Ibberson, A. Podlesnyak, M. J. Martínez-Lope, and M. M. Abd-Elmeguid, Phys. Rev. Lett. 98, 176406 (2007).
- Lee et al. (2011a) S. B. Lee, R. Chen, and L. Balents, Phys. Rev. Lett. 106, 016405 (2011a).
- Lee et al. (2011b) S. B. Lee, R. Chen, and L. Balents, Phys. Rev. B 84, 165119 (2011b).
- Glazer (1972) A. M. Glazer, Acta Cryst. B 28, 3384 (1972).
- Glazer (1975) A. M. Glazer, Acta Cryst. A 31, 756 (1975).
- Marzari and Vanderbilt (1997) N. Marzari and D. Vanderbilt, Phys. Rev. B 56, 12847 (1997).
- Mostofi et al. (2008) A. A. Mostofi, J. R. Yates, Y.-S. Lee, I. Souza, D. Vanderbilt, and N. Marzari, Comput. Phys. Commun. 178, 685 (2008), ISSN 0010-4655.
- Marzari et al. (2012) N. Marzari, A. A. Mostofi, J. R. Yates, I. Souza, and D. Vanderbilt, Rev. Mod. Phys. 84, 1419 (2012).
- Pruschke and Bulla (2005) T. Pruschke and R. Bulla, Eur. Phys. J. B 44, 217 (2005).
- Aryasetiawan et al. (2004) F. Aryasetiawan, M. Imada, A. Georges, G. Kotliar, S. Biermann, and A. I. Lichtenstein, Phys. Rev. B 70, 195104 (2004), ISSN 1098-0121.
- Biermann et al. (2003) S. Biermann, F. Aryasetiawan, and A. Georges, Phys. Rev. Lett. 90, 086402 (2003).
- Georges et al. (2013) A. Georges, L. de’ Medici, and J. Mravlje, Annu. Rev. Condens. Matter Phys. 4, 137 (2013), eprint http://arxiv.org/abs/1207.3033.
- van der Marel and Sawatzky (1988) D. van der Marel and G. A. Sawatzky, Phys. Rev. B 37, 10674 (1988).
- de’ Medici (2011) L. de’ Medici, Phys. Rev. B 83, 205112 (2011).
- de’ Medici et al. (2011) L. de’ Medici, J. Mravlje, and A. Georges, Phys. Rev. Lett. 107, 256401 (2011).
- Rajeev et al. (1991) K. Rajeev, G. Shivashankar, and A. Raychaudhuri, Solid State Comm. 79, 591 (1991).
- Sreedhar et al. (1992) K. Sreedhar, J. M. Honig, M. Darwin, M. McElfresh, P. M. Shand, J. Xu, B. C. Crooker, and J. Spalek, Phys. Rev. B 46, 6382 (1992).
- Ruppen et al. (2014) J. Ruppen, J. Teyssier, S. Catalano, M. Gibert, J.-M. Triscone, and D. van der Marel (2014), in preparation.
- Wu et al. (2013) M. Wu, E. Benckiser, M. W. Haverkort, A. Frano, Y. Lu, U. Nwankwo, S. Brück, P. Audehm, E. Goering, S. Macke, et al., Phys. Rev. B 88, 125124 (2013).
- Blaha et al. (2001) P. Blaha, K. Schwarz, G. K. H. Madsen, D. Kvasnicka, and J. Luitz, WIEN2K, An Augmented Plane Wave + Local Orbitals Program for Calculating Crystal Properties (Karlheinz Schwarz, Techn. Universität Wien, Austria, 2001).
- Gull et al. (2011) E. Gull, A. J. Millis, A. I. Lichtenstein, A. N. Rubtsov, M. Troyer, and P. Werner, Rev. Mod. Phys. 83, 349 (2011).
- (59) M. Ferrero and O. Parcollet, TRIQS: a Toolbox for Research on Interacting Quantum Systems, http://ipht.cea.fr/triqs.
- Boehnke et al. (2011) L. Boehnke, H. Hafermann, M. Ferrero, F. Lechermann, and O. Parcollet, Phys. Rev. B 84, 075145 (2011).
- Amadon et al. (2008) B. Amadon, F. Lechermann, A. Georges, F. Jollet, T. O. Wehling, and A. I. Lichtenstein, Phys. Rev. B 77, 205112 (2008).
- Kresse and Joubert (1999) G. Kresse and D. Joubert, Phys. Rev. B 59, 1758 (1999).
- Kresse and Hafner (1993) G. Kresse and J. Hafner, Phys. Rev. B 47, 558 (1993).
- Kresse and Furthmüller (1996) G. Kresse and J. Furthmüller, Phys. Rev. B 54, 11169 (1996).
- Momma and Izumi (2011) K. Momma and F. Izumi, J. Appl. Crystallogr. 44, 1272 (2011).