Spinning like a Blue Straggler: the population of fast rotating Blue Straggler stars in Centauri 111Based on observations collected at the ESO-VLT under the programs 077.D-0696(A), 081.D-0356(A) and 089.D-0298(A).
Abstract
By using high-resolution spectra acquired with FLAMES-GIRAFFE at the ESO/VLT, we measured radial and rotational velocities for 110 Blue Straggler stars (BSSs) in Centauri, the globular cluster-like stellar system harboring the largest known BSS population. According to their radial velocities, 109 BSSs are members of the system. The rotational velocity distribution is very broad, with the bulk of BSSs spinning at less than 40 km s-1 (in agreement with the majority of such stars observed in other globular clusters) and a long tail reaching 200 km s-1. About 40% of the sample has sin i 40 km s-1 and about 20% has sin i 70 km s-1. Such a large fraction is very similar to the percentage of of fast rotating BSSs observed in M4. Thus, Centauri is the second stellar cluster, beyond M4, with a surprisingly high population of fast spinning BSSs. We found a hint of a radial behaviour of the fraction of fast rotating BSSs, with a mild peak within one core radius, and a possibile rise in the external regions (beyond four core radii). This may suggest that recent formation episodes of mass transfer BSSs occurred preferentially in the outskirts of Centauri, or that braking mechanisms able to slow down these stars are least efficient in lowest density environments.
1 Introduction
Blue Straggler Stars (BSSs) are nowadays firmly established as an ”anomalous” class of stars populating any stellar environment, ranging from open star clusters (Johnson & Sandage, 1955; Mathieu & Geller, 2009), to globular clusters (Sandage, 1953; Ferraro et al., 1992, 2003; Piotto et al., 2004; Leigh et al., 2007), the Galactic field (Preston & Sneden, 2000), and dwarf spheroidal galaxies (Momany et al., 2007; Mapelli et al., 2009).
In the optical color-magnitude diagrams (CMDs) BSSs appear as objects brighter and bluer (hotter) than the normal turnoff (TO) stars, lying along an extension of the main-sequence (MS). Their position in the CMD (Ferraro et al., 2006a; Lanzoni et al., 2007a) and the direct spectroscopic and pulsation measurements (Shara et al., 1997; De Marco et al., 2005; Gilliland et al., 1998; Fiorentino et al., 2014), have shown that BSSs are more massive than normal TO stars. Two main scenarios have been proposed for their formation: direct stellar collisions (COL-BSSs; Hills & Day, 1976) and mass transfer activity between binary companions (MT-BSSs; McCrea, 1964), either due to stellar evolution or triggered by stellar interactions, possibly up to the complete coalescence of the two objects. The two mechanisms can possibly occur simultaneously in dense stellar systems, like globular clusters (GCs; Ferraro et al., 1993, 1997, 2009a; Dalessandro et al., 2013). Hence, these objects not only are the tangible proof of the (mild or violent) interactions occurring between stars in GCs, but they also offer the opportunity of investigating the internal dynamics of stellar systems (Ferraro et al., 2001; Mapelli et al., 2004, 2006; Lanzoni et al., 2007b, c; Dalessandro et al., 2008a; Sabbi et al., 2004; Beccari et al., 2006). In this respect one of the most recent exciting results has been obtained by Ferraro et al. (2012), who demonstrated that the BSS radial distribution can be used as a clock to measure the parent cluster dynamical age.
In spite of their importance, many issues concerning the BSS formation and properties are still open. In particular, one of the most challenging problems is the identification of observable features able to discriminate between the two formation channels. Negligible mixing between the inner cores and the outer envelopes is predicted for COL-BSSs (Lombardi et al., 1995) that should show normal C and O abundances. Conversely, MT-BSSs are expected to show C and O depletion on their surface (Sarna & De Greve, 1996), because the material should come from the inner regions of the donor star where the CNO-cycle occurred. Indeed this chemical signature has been observed in a sub-sample of BSSs in 47 Tuc (Ferraro et al., 2006a) and in M30 (Lovisi et al 2013a). Another interesting measurable BSS characteristic is the projected rotational velocity, sin i. Unfortunately, in this case the theoretical interpretative scenario is significantly more complex since both MT- and COL-BSSs are expected to rotate fast (Sarna & De Greve, 1996; Benz & Hills, 1987), but braking mechanisms are suggested to occur and slow down the stars, with timescales and efficiencies which are still unknown (Leonard & Livio, 1995; Sills et al., 2005).
From the observational point of view, most of the BSSs appear to be slow rotators (with rotation velocities lower than 40 km s-1) in all the GCs studied so far by our group, namely 47 Tuc (Ferraro et al., 2006a), NGC 6397 (Lovisi et al., 2010), M30 (Lovisi et al., 2013a) and NGC 6752 (Lovisi et al., 2013b). Even though the range of rotational velocities is larger than that spanned by normal MS stars in GCs (see e.g. Lucatello & Gratton, 2003), it is still compatible with that of the fastest rotating stars in ”normal” evolutionary sequences in GCs, namely horizontal branch stars redder than the Grundahl jump (Grundahl et al., 1999) with 8000 K12000 K (see Peterson et al., 1995; Behr et al., 2000a, b). Nevertheless, some outliers have been found in 47 Tuc, M30 and NGC 6397 (but not in NGC 6752): one BSS per cluster shows very high rotation, up to more than 90 km s-1. However, the most surprising result has been found for M4: out of the 20 BSSs investigated in this GC, Lovisi et al. (2010) identified 8 fast-rotating (FR) BSSs (with sin i 40 km s-1), corresponding to 40% of the studied sample. Indeed, this is the largest percentage of FR BSSs ever found in any GC.
Here we present the results obtained for a sample of BSSs in the stellar system Centauri. All the evidence collected so far (Lee et al., 1999; Pancino et al., 2000; Ferraro et al., 2004; Norris & Da Costa, 1995; Sollima et al., 2005; Origlia et al., 2003; Johnson & Pilachowski, 2010) suggest that Centauri is not a genuine GC222Note that only another GC-like stellar system with a similarly large metallicity spread has been found in the Galaxy: Terzan 5 in the Galactic Bulge (Ferraro et al., 2009b; Origlia et al., 2011, 2013)., but possibly the remnant core of a tidally disrupted dwarf galaxy (see e.g. Dinescu et al., 1999; Majewski et al., 2000; Bekki & Norris, 2006). This stellar system hosts the richest BSS population observed so far in a GC, with more than 300 candidates (Ferraro et al., 2006b). Its normalized BSS radial distribution is flat, suggesting that the system is not dynamically relaxed yet (Ferraro et al., 2012); note that a similar distribution has been found in only two other stellar systems: NGC 2419 (Dalessandro et al., 2008b) and Pal 14 (Beccari et al., 2011). This means that mass segregation had not enough time yet to be effective and stellar interactions are very unfrequent. For these reasons the BSS population of Centauri is thought to have mainly formed through MT activity in primordial binary systems (Ferraro et al., 2006b). This makes Centauri the ideal stellar system for investigating the properties of MT-BSSs.
Recently, Simunovic & Puzia (2014, hereafter SP14) measured rotational velocities for 49 BSSs in Centauri by using medium-resolution spectra (R10000) taken with the Inamori Magellan Areal Camera and Spectrograph (IMACS) multimode facility at the Baade Magellan telescope. They found a quite large distribution of sin i, peaked around 20-30 km s-1 and reaching about 170 km s-1. One of the most intriguing results of their work is a hint that the FR BSSs are more centrally concentrated with respect to slower BSSs. Moreover, a trend between rotational velocity and color (hence, temperature) has been claimed. Based on these results the authors suggested that the FR BSSs formed preferentially in the central regions and are also more massive than slow rotators.
As part of a systematic spectroscopic campaign aimed at studying the chemical and kinematicl properties of BSSs in GCs (see previous results in Ferraro et al. 2006a, Lovisi et al. 2010, 2013a,b), in this paper we present and discuss the rotation velocity distribution of 110 candidate BSSs in Centauri.
The paper is organized as follows: Section 2 describes the observations, followed in Section 3 by the derivation of the atmospheric parameters. The measurements of radial and rotational velocities are discussed in Section 4 and 5, respectively. Section 6 discusses the comparison between our results and those of SP14. Finally, Section 7 presents the discussion of the results and our conclusions.
2 Observations
The spectroscopic dataset analysed in this paper includes two samples of high-resolution spectra acquired with the multi-object spectrograph FLAMES-GIRAFFE (Pasquini et al., 2002) mounted at the Very Large Telescope of the European Southern Observatory (ESO):
-
1.
Dataset 1 — 73 BSSs observed with the gratings HR5A (R18500, ), HR14A (R18000, ) and HR15N (R17000, ), during the ESO periods 81 and 89 (PI: Ferraro). For each target 3 exposures of 3600 s with both HR14A and HR15N gratings, and 5 exposures of 3000 sec with the HR5A have been secured.
The targets have been selected from a photometric catalog obtained by combining high resolution images (through the and filters) acquired with the ACS camera on board of HST and wide-field images obtained with the ESO-WFI imager (through the and bands; see Ferraro et al., 2006b for the description of the photometric dataset). We conservatively excluded targets having close stellar sources of comparable or higher luminosity within , in order to avoid contamination of the spectra from close companion stars.
-
2.
Dataset 2 — 54 BSSs observed with the gratings HR2 (R19600, ) and HR4 (R20350, ) and retrieved from the ESO Archive (ESO period 77, PI: Freyhammer). 8 and 6 exposures of 1250 s each have been secured with the gratings HR2 and HR4, respectively. The coordinates of the targets have been cross-correlated with our photometric catalog, in order to put all the targets in the same astrometric and photometric systems. We checked that all the targets are not contaminated by bright companions. A total of 17 BSSs are in common between the two datasets.
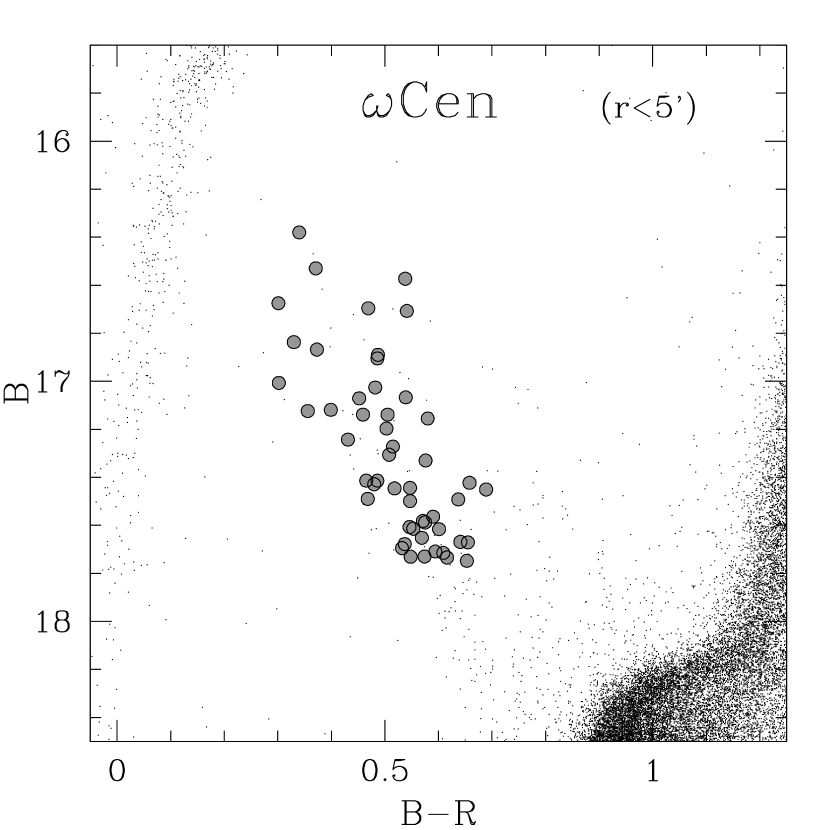
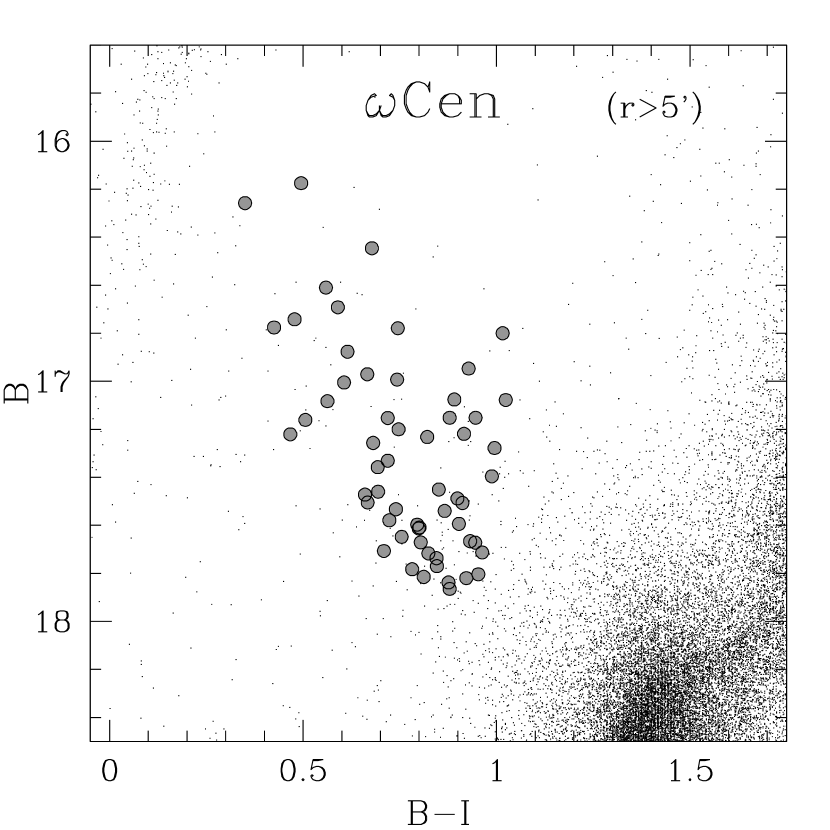
The position of the observed targets in the CMDs is shown in Figures 1 and 2. Both the datasets have been reduced with the version 2.9.2 of the GIRAFFE ESO pipeline333http://www.eso.org/sci//software/pipelines/ including bias-subtraction, flat-fielding, wavelength calibration and spectral extraction. For each grating, the sky contribution has been removed from each individual exposure by using a master-sky spectrum obtained as the median of all the sky spectra. Finally, for any given star the sky-subtracted spectra (corrected for radial velocity, RV; see Section 4) have been coadded together.
3 Atmospheric parameters and synthetic spectra
Atmospheric parameters (effective temperature and surface gravity) for our targets have been derived photometrically, by orthogonally projecting the stellar position in the CMDs on a set of theoretical isochrones with different ages (from 100 Myr to 5 Gyr), able to cover the entire extension of the BSS sequence in the CMD. In particular, we used isochrones from the Padova database (Bressan et al., 2012)444http://stev.oapd.inaf.it/cgi-bin/cmd, with metallicity Z=0.0006 and -enhanced chemical mixture (corresponding to [M/H] dex), and we assumed a distance modulus (m-M) mag and a color excess E mag (Ferraro et al., 2006b), suitable to best-fit the old, metal-poor ([Fe/H] dex; see e.g. Johnson & Pilachowski, 2010) component of Centauri with a 13 Gyr-isochrone. A microturbulent velocity of 0 km s-1 is adopted for all the targets, because of the shallow convective (or fully radiative) envelopes expected for these stars (note that different assumptions for the microturbulent velocity have no impact in the determination of RVs and sin i).
In order to measure RVs and sin i we made extensive use of synthetic spectra computed with the code SYNTHE (Sbordone et al., 2004; Kurucz, 2005), adopting the last version of the Kurucz/Castelli linelist for atomic and molecular transitions. The line-blanketed model atmospheres have been computed with the code ATLAS9 (Castelli & Kurucz, 2004), under the assumptions of Local Thermodynamic Equilibrium for all the species, one-dimensional, plane-parallel geometry and without the inclusion of the approximate overshooting in the flux computation. For each star an ATLAS9 model atmosphere has been generated adopting the appropriate stellar parameters of the target and assuming a metallicity [M/H]=–1.5 dex.
The synthetic spectra have been convolved with a Gaussian profile to reproduce the instrumental broadening of the different setups. The broadening for a given setup has been estimated by measuring the FWHM of bright unsaturated lines in the reference Th-Ar calibration lamp (following the procedure adopted by Behr et al., 2000a). Finally, rotational velocities have been taken into account by convolving the synthetic spectra with a rotational profile (Kurucz, 2005).
4 Radial velocities
RVs have been measured through the Fourier cross-correlation technique as implemented in the IRAF task fxcor (Tonry & Davis, 1979). For each star we used a synthetic spectrum computed with the appropriate stellar parameters. All the templates have been computed by assuming [M/H] dex: note that the assumption of higher metallicities according to the broad metallicity distribution of Centauri is not a critical issue and does not affect the measure of RV.
For the targets observed with HR5A, RVs have been derived mainly from the Mg II triplet at (visible in almost all the spectra observed with this grating) and other transitions when available. For the HR4, HR14A and HR15N setups, instead, we used the Balmer lines. RVs for the stars observed with the HR2 setup have been obtained from the photospheric Ca II K line. We paid special attention to exclude from the cross-correlation process the Ca II K interstellar line visible at km s-1 (van Loon et al., 2009) which is associated to gas a few kpc far along the line of sight of Centauri and could produce a mismatch in the identification of the main peak of the cross-correlation function.
Multiple RV measurements are available for 74 targets. We carefully verified that the values obtained from different gratings and in different epochs are consistent each other. By excluding 17 BSSs showing hints of RV variations larger than the estimated uncertainties (which typically are smaller than 1 km s-1), we find average differences always smaller than 1 km s-1 between two different gratings, and smaller that 1-2 km s-1 between two epochs In particular, we found an average difference between Dataset 1 and Dataset 2 of –0.30.6 km s-1 (=1.7 km s-1 ), thus guaranteeing a proper internal accuracy of our measures. By cross-correlating the target list with the catalog of variable stars identified by Kaluzny et al. (2004) and Olech et al. (2005), we find 27 SX Phe, 6 W UMa, 2 detached eclipsing binaries, 1 candidate ellipsoidal variable and 1 variable star with a period of days, but with no classification. Out of the 17 BSSs with hints of RV variations, 3 are classified as SX Phe and 3 as W UMa by Kaluzny et al. (2004) and Olech et al. (2005), while the remaining 11 do not show photometric variability. These findings demonstrate that our dataset is not suitable for studies of RV variability and the search for binary systems. We therefore limit to indicate (when available) the variable type in Table 1, together with the identification name in the catalogs of Kaluzny et al. (2004) and Olech et al. (2005). For the targets with multiple measurements we finally adopted the average value of RV, assuming as uncertainty the dispersion of the mean normalized to the root mean square of the number of available measures.
Our sample includes 109 BSS members of the cluster, providing a mean RV of km s-1 ( km s-1). Their coordinates, atmospheric parameters, and RVs are listed in Table 1. All but one of the observed targets have RVs between and km s-1, in good agreement with the systemic RV of Centauri, peaked at RV km s-1 (Sollima et al., 2009, but see also Mayor et al., 1997; Pancino et al., 2007; Monaco et al., 2010). Only one star belongs to the field: it has RV km s-1, compatible with that observed (see Figure 7 in Sollima et al., 2009) and expected (see the Galactic model of Robin et al., 2003) for the thin and thick disc stars in the direction of Centauri.
5 Rotational velocities
Projected rotational velocities have been measured by performing a -minimization between the observed spectra and a grid of synthetic spectra calculated with the atmospheric parameters of each program star and different values of sin i. Note that since abundance variations affect mainly the line core, while rotation alters the entire line profile, a correct fit of the entire line profile needs also the knowledge of the chemical abundances to properly reproduce the line depth. Thus, we used an iterative procedure to simultaneously measure abundance and sin i, and to provide a reliable fit of the entire line profile. Note that for all the stars we assumed a global metallicity [M/H] dex, leaving the abundance of the element under scrutiny to vary during the procedure. We checked the impact of this assumption by re-analyzing some stars adopting [M/H] and dex (according to the broad metallicity distribution of Centauri; see Johnson & Pilachowski, 2010). We found variations of sin i of about 0-1 km s-1.
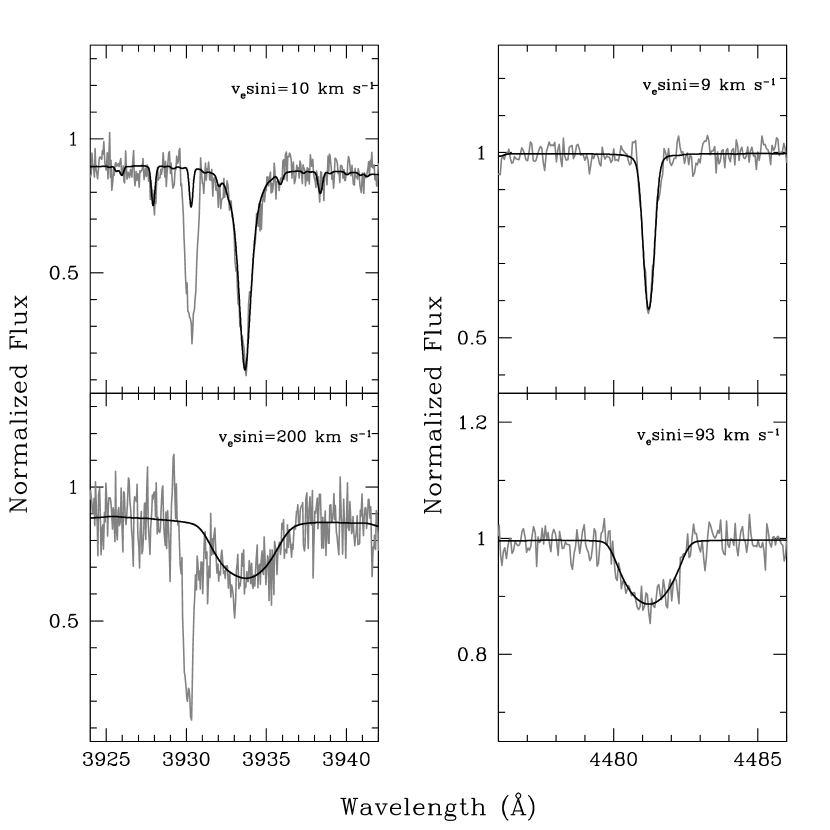
For stars in Dataset 1 we measured sin i from several different spectral lines (typically 5-10, depending on the signal-to-noise ratio), in order to have independent measures. Then the average value is assumed as final measure. For stars in Dataset 2, RVs have been measured from the Ca II K line. This feature is a robust diagnostic for BSS rotational velocities, because it is strong enough to be observable also in case of very high rotational velocity (while weaker features, as those used for the spectra of Dataset 1, can be unobservable for sin i 100 km s-1). Moreover its strength decreases when the surface temperature increases, making easier to disentangle the contribution of the rotational velocity from the intrinsic line profile. However, among the coldest stars (where the intrinsic width of the Ca II K line can make the measurement of low sin i more uncertain) other transitions are detectable and have been used to confirm the derived values of sin i. As discussed above, the interstellar Ca II K line has been masked in order to not affect the fitting procedure of the photospheric line. Fig. 3 shows examples of a few spectra in the Ca II K line spectral region (left panels) and the Mg II lines (right panels), with low and high rotational velocities. The interstellar Ca II K line, shifted by about km s-1, is clearly visible in the left panels.
Spectra observed with gratings HR4, HR14A and HR15N have not been used to determine the rotational velocities. This is because the only available features in these gratings are the and Balmer lines, which can be poor diagnostics of sin i, due to their intrinsic width, their high sensitivity to atmospheric parameters and their comparatively much lower sensitivity to rotation (see Sect. 6).
As quoted above, 17 stars have been found in common in the two datasets. The comparison of the two independent sin i measures allows an important check of consistency. The average difference between sin i for stars in common between Dataset 1 and 2 turns out to be quite small, km s-1 ( km s-1). Such a difference (consistent with zero km s-1 ) guarantees that no systematics are present in our analysis and its small rms uncertainty can be adopted as an estimate of the internal accuracy of our measurements. For stars for which two measurements of sin i are available, we assumed the mean rotational velocity. For two stars in common between the two datasets for which only lower limits are derived from the spectra of Dataset 1, we assumed the value obtained from Dataset 2. Finally, 5 stars available only in Dataset 1 show featureless spectra for the HR5 grating, and hence only lower limits can be derived by the comparison between observed and synthetic spectra. Finally, the external accuracy of our measures is demonstrated by the good agreement with the independent results of SP14 for 13 targets in common between the two datasets (see Sect. 6), and by the values we obtained for a sample of 24 sub-giant branch stars observed during the same runs discussed here (they are all consistent with zero km s-1, in agreement with the typical rotational velocity of stars in this evolutionary phase).
It is important to specify that the values of sin i are derived by assuming that the stellar atmospheric parameters do not vary with the star latitude. This is not totally true for very rapidly rotating stars, that are affected by the so-called gravity darkening (von Zeipel, 1924), usually expressed by a power law, (with ), implying that the equatorial regions are cooler than the poles (see also Espinosa Lara & Rieutord, 2011). This effect should lead to an underestimate of 10-20% of sin i for stars with relevant rotation ( km s-1), as O and B-type stars (see Towsend et al., 2004 and Ramirez-Agudelo et al., 2013). Our results do not include corrections for gravity darkening; however, this effect should only marginally affect the observed BSSs (since most of them rotate much more slowly than the OB-type stars), thus not modifying our conclusions on the sin i distribution.
Uncertainties in the fitting procedure of each individual line have been estimated by resorting to Montecarlo simulations, creating for some targets (representative in terms of atmospheric parameters and spectral quality) a sample of 1000 synthetic spectra with added Poissonian noise, and repeating the analysis. The typical uncertainties for slow-rotating stars range from 3 km s-1 up to 5 km s-1, according to the signal-to-noise ratio. For FR stars the uncertainties can reach 20 km s-1, in particular for the BSSs with sin i larger than 150 km s-1. For the stars for which sin i has been derived from different lines, we assumed as internal uncertainty the dispersion of the mean (weighted on the MonteCarlo uncertainties of each individual line) normalized to the square root of the number of lines. For the stars for which only one line has been used (as the majority of the targets of Dataset 2), the MonteCarlo uncertainty has been adopted.
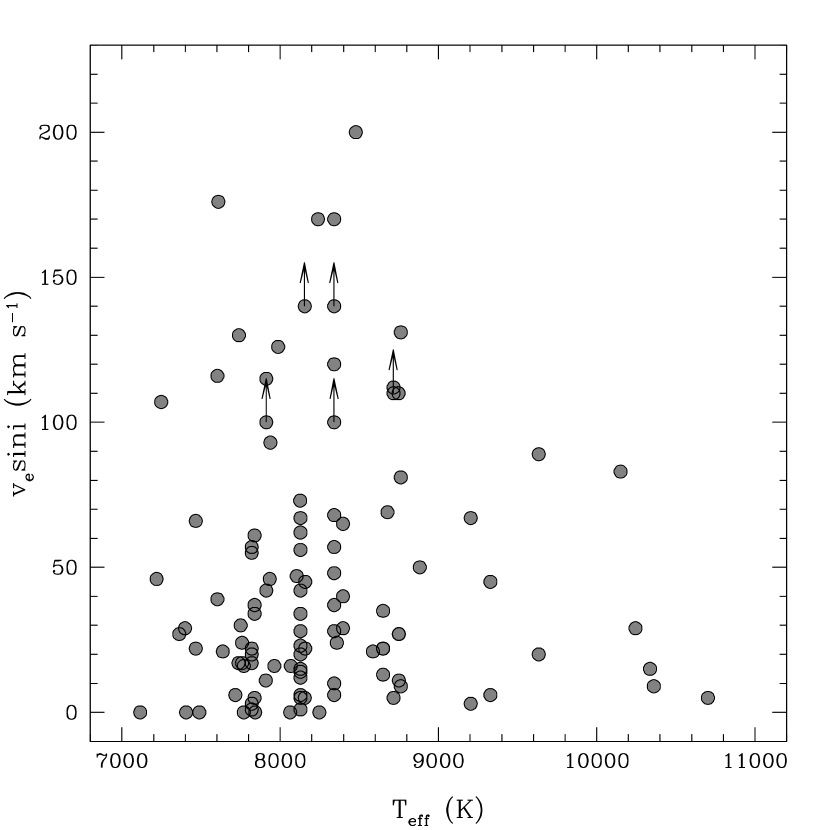
Fig. 4 shows the distribution of sin i for the entire BSS sample, with the lower limits for the five BSSs also shown with arrows. The distribution turns out to be very broad, with a main peak at low velocities (5-20 km s-1) and a long tail toward high sin i values (reaching 200 km s-1). Note that such large values are unusual and unexpected for normal GC stars, where the highest rotational velocities reach only values of -50 km s-1 and are observed among the Horizontal Branch stars hotter than the instability strip and colder than the Grundahl Jump (see e.g. Behr et al., 2000a, b; Lovisi et al., 2013a). Thus, BSSs populating the tail of the distribution certainly are the most FR stars observed in GCs. Instead, among the MS field stars the rotational velocity is a function of the temperature (Cortés et al., 2009), with sin i km s-1 for stars colder than K, while the sin i distribution covers a broad range, up to values larger than 200 km s-1 for hotter stars; note that the most rapidly rotating star discovered so far (namely VFTS102 in 30 Doradus, Dufton et al., 2011) is a O-type stars with a projected rotational velocity larger than 500 km s-1. However, as shown in Fig. 5 such a behaviour is not observed in our BSS sample. In particular, all the BSSs with sin i larger than 100 km s-1 have lower than 8800 K, while for higher temperatures the BSSs show rotational velocities lower than 90 km s-1. This provides additional support to the fact that BSSs do not behave as genuine MS stars.
6 Comparison with SP14
SP14 provide the rotational velocities of 47 BSSs in Centauri measured by using IMACS@Magellan spectra (R10000). In their work, the derivation of sin i is based on the penalized pixel fitting of Gauss-Hermite expansion of the line profile adopting as templates 12 spectra of stars with spectral type similar to that of the target BSSs, acquired with the ELODIE spectrograph at the Observatoire de Haute-Provence. Fourteen of our targets are in common with their sample. Fig. 6 shows the residuals between the rotational velocities measured in the two works. Apart from star #111709 (for which a large discrepancy of 140 km s-1 is found) and star #111909 (for which we provide only a lower limit), the average difference is (sin i)sin i km s-1, with a quite large dispersion about the mean ( km s-1). The residuals show a quite well defined trend with large differences (up to 35 km s-1) for low rotational velocities (sin i 20-30 km s-1) and a substantial agreement at large velocities. This suggests that the differences between the two works are essentially due to the relative low resolution of IMACS (which is about half the FLAMES one). As expected in fact at lower resolution is more difficult to correctly measure small sin i because the line profile is dominated by the instrumental broadening.
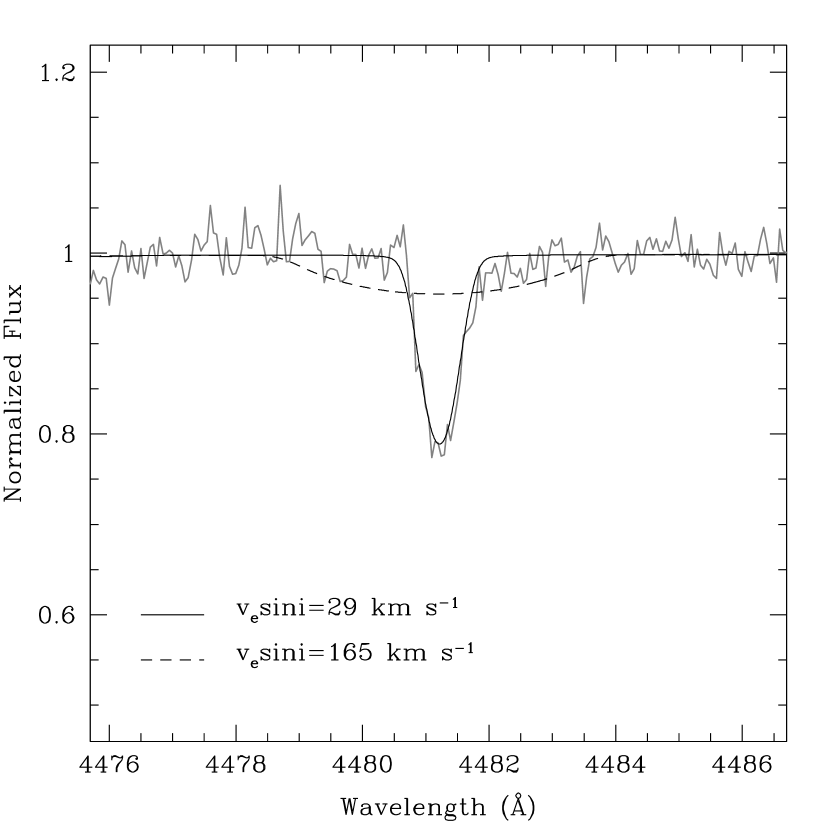
We investigated in detail the origin of the large difference in the rotational velocity of star #111709 measured in the two studies: sin i km s-1 in SP14, sin i km s-1 in our work. In Fig. 8 we show a portion of the spectrum of this star around the Mg II line at , with overimposed synthetic spectra calculated with the rotational velocity derived in our analysis (thin solid line) and in SP14 (thin dashed line). The comparison clearly demonstrates that the observed profile of the Mg II line cannot be reproduced with the large value of sin i quoted by SP14. We attribute such a discrepancy to the different lines used to measure the rotation velocity.
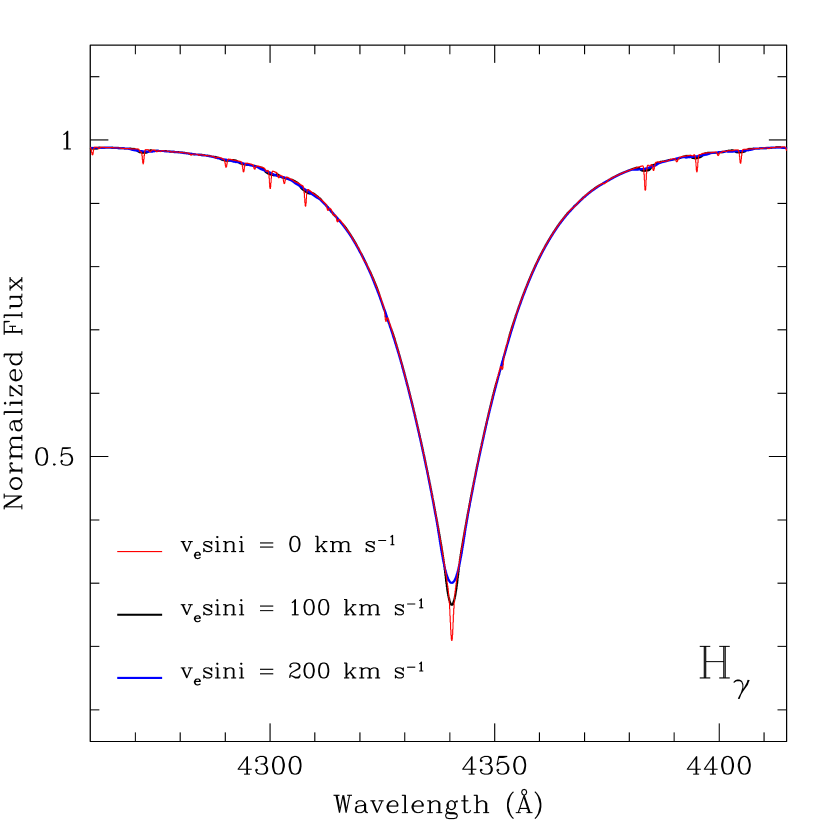
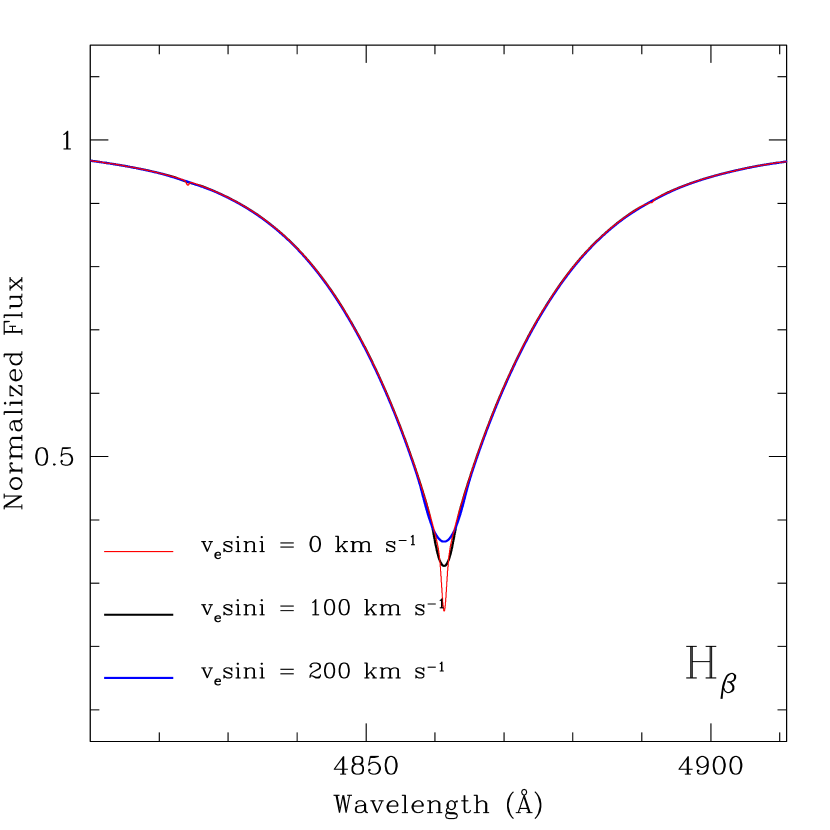
In fact, in the spectral ranges investigated by SP14 and at the relatively low spectral resolution of IMACS, metallic transitions very sensitive to rotation become weak or even disappear in hot stars like BSS #111709 ( K), and the only measurable lines are those of the Balmer series. In general, these lines are only marginally sensitive to rotation and suffer from several effects not easily modeled, nor well constrained. In fact, the detailed inspection of a grid of synthetic spectra computed with fixed atmospheric parameters and different values of sin i reveals that the core of the line is the only region of the Balmer profile sensitive to rotation. As an example, in Fig. 7 we compare synthetic spectra around the and Balmer lines, calculated by assuming the same atmospheric parameters ( K, logg) and by varying only the rotational velocity. As apparent, an increase of sin i from 0 km s-1 up to 200 km s-1, produces no effects on the FWHM and the wings of the lines (which are instead very sensitive to /log g variations, as discussed by Fuhrmann et al., 1993). The variations of the core depth are relatively small with respect to the assumed changes of sin i, and only a few pixels of the entire line profile can therefore be used. On the other hand, small variations of the atmospheric parameters lead to large variations of the entire line profile. Moreover, since the core of the Balmer lines forms in the most external layers of the photosphere, it can suffer from several effects which are not easy to take into account and that could vary from star to star (e.g., departures from the Local Thermodynamical Equilibrium, stellar winds, chromospheric activity, convective granulation). All these effects prevent the use of the Balmer lines as solid indicators of rotational velocity. In general, they only allow to roughly discriminate between slow and very fast rotating stars, with large uncertainties in the derived values of sin i (as clearly visible in Fig. 7).
At the temperature and gravity of BSS #111709, the Balmer lines show very large wings, and metallic feature sensitive to rotations could be hardly measurable, especially at moderate spectral resolution. This is the most likely explanation for the large discrepancy found between the value of sin i estimated by SP14 (from the Balmer lines), and the one we obtained from some metallic lines. Because of their lower effective temperatures, such a problem is significantly mitigated for the remaining stars in common between the two studies (see the inset in Fig. 6). We note that for the vast majority of the targets in Centauri, SP14 measured the rotational velocity from the spectral region around the and Balmer lines, and only for a small sub-set they also used the spectral regions around the Mg II line at and the Mg b triplet at . Thus, the rotational velocity of the hottest stars could be biased, if only Balmer lines were used in the analysis. However, given the general agreement between the two samples (Fig. 6), in the next section we also discuss the two datasets together (for the stars in common we adopted our FLAMES values because of the higher spectral resolution).
7 Discussion and Conclusions
In this work we presented the rotational velocities of 109 BSSs in Centauri. This is the largest homogeneous characterization of the rotational properties of the BSS population ever performed in a single stellar system.
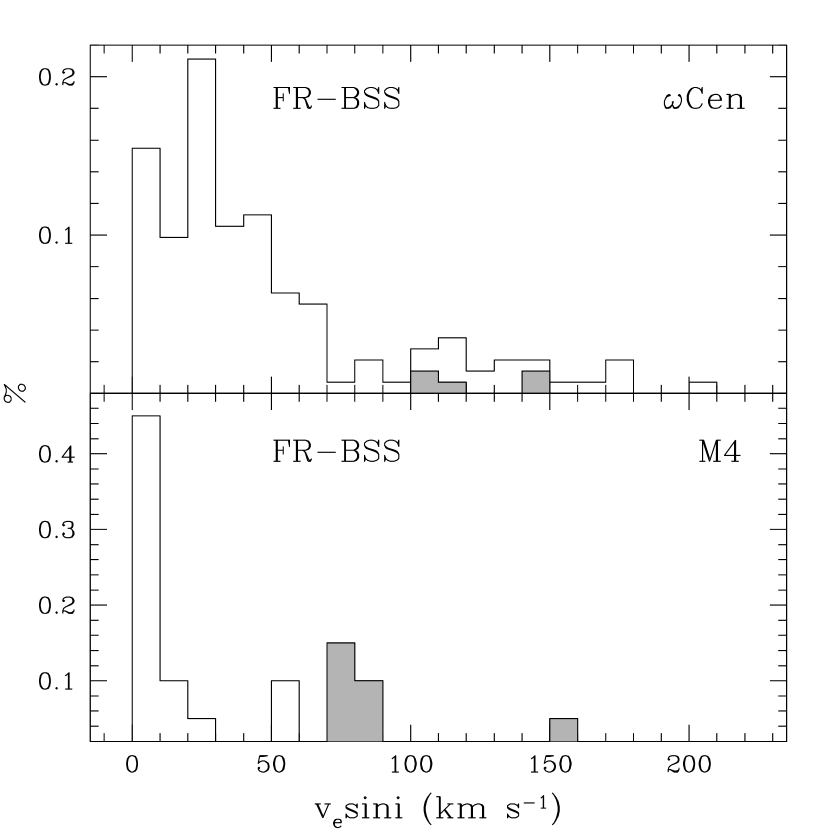
As shown in Fig. 4, the distribution of rotational velocities is peaked at low values (10-30 km s-1), with a long tail toward larger values. Indeed the fraction of BSSs populating the tail is considerable. By assuming sin i km s-1 as a reasonable threshold between slow and fast rotators (see also Lovisi et al. 2010), it turns out that 44 BSSs (out of the 109 observed) are FRs. This corresponds to % of the studied sample. Adding the BSSs analysed in SP14 and not in common with the FLAMES dataset, we obtain a total of 142 BSSs. The rotational velocity distribution of the combined sample is shown in the upper panel of Fig. 9. The overall shape well corresponds to that in Fig. 4, and also the fraction of BSSs spinning faster than 40 km s-1 remains unchanged (59 BSSs are FRs, corresponding to 40% of the entire sample). However, the distribution of sin i shown in Fig. 9 suggests that a higher velocity boundary for separating FRs may be more appropriate. Consistently with SP14, we thus assumed 70 km s-1 as a threshold value, finding that 28 out 142 BSS (20%) can be labelled as fast spinning BSSs. This is in agreement with the fraction obtained by considering our FLAMES sample alone, and with that quoted by SP14 for their dataset. Interestingly enough, the fraction of FR BSSs in M4 (Lovisi et al., 2010; see lower panel of Fig. 9 for a direct comparison) is very similar to that of Centauri, independently of the adopted boundary (40% with sin i=40 km s-1, and 30% with 70 km s-1), even though the total size of the sample is considerably smaller (including only 20 stars). Totally different results are obtained for the other GCs investigated so far, namely 47 Tuc, NGC 6397, M30 and NGC 6752 (Ferraro et al., 2006a; Lovisi et al., 2012, 2013a, 2013b, respectively), where the bulk of BSSs has sin i km s-1 and only one star per cluster (if any) has high rotational velocity (larger than 80-100 km s-1). Thus, besides M4, Centauri is the second cluster with a significant fraction of FR BSSs.
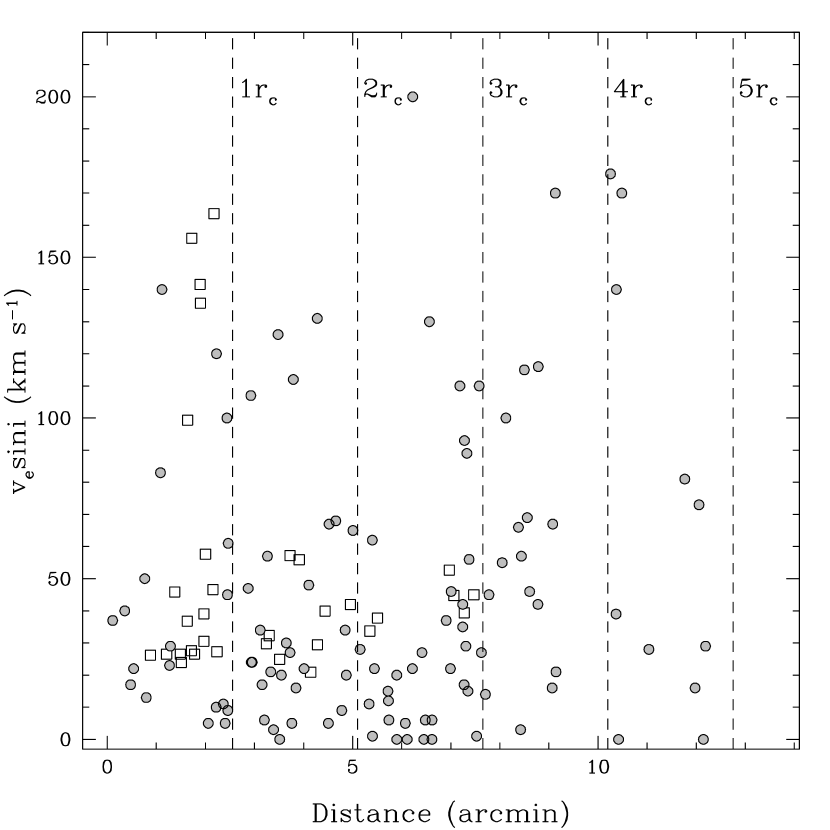
Interesting insights can be drawn also from the BSS spatial distribution. SP14 found that the FR-BSSs (with sin i km s-1) in Centauri are more segregated toward the center, with respect to the slowly rotating objects.555 We note that the distances quoted in SP14 have been calculated by neglecting the term cos(Dec). By taking this term into account and computing the correct distances, we find that all their targets are located within 3 (instead of ) from the center, and all the FR-BSSs but two (i.e., 7 out of 9) are positioned within (instead of ). While the targets in their sample cover only the inner , the combined dataset extends out to , corresponding to (the adopted cluster center and core radius are from Ferraro et al., 2006b: , , ). The distribution of sin i as a function of the distance from the cluster center is shown in Fig. 10 for our sample (grey circles) and for the additional targets from SP14 (empty squares). The ratio between the number of FRs and the total number of BSSs (/), measured in concentric annuli with radii equal to 1, 2, 3, 4 and 5 , is plotted in Fig. 11. Our measurements alone (solid circles), as well as the combined sample (empty triangles), show a trend with the distance from center. In agreement with the findings of SP14, the fraction of FRs is larger in the central regions than at ( and 0.11, respectively for the combined sample). A larger value is found in the most external regions, beyond , where the fraction of fast spinning BSSs reaches the 45% of the total. Because of the small number statistics of the sample (in particular for the outermost regions), the uncertainty in each single bin is large. In order to assess the statistical significance of this possible behaviour, we performed a Kolmogorov-Smirnov test between the radial distributions of the populations of fast- and slow-rotating BSSs, yielding a 20% probability that the two samples are extracted from the same parent distribution. Even if this test provides a statistical significance smaller than 2, a different radial distribution for FR and slow-rotating BSSs cannot be totally ruled out. Also, we checked this result against changing the coordinates of the cluster center according to the values quoted in the literature by Anderson & van der Marel (2010), van Leeuwen et al. (2000) and Noyola et al. (2008), finding no variations in the observed behavior. On the other hand, no similar trend is observed for M4, the other GC with a large population of FR BSSs. However, the size of the sample is very limited in that case and we cannot therefore exclude that also in M4 the fraction of fast rotating BSSs has a bimodal radial trend, with a significant rise outward.
Based on the flat BSS radial distribution observed in Centauri, Ferraro et al. (2006b) suggested that the vast majority of these stars (if not all) has a non-collisional origin and probably formed through MT in binary systems. On the other hand, theoretical models predict high rotational velocities for MT-BSSs, at least at the moment of their formation (Sarna & De Greve, 1996; Lombardi et al., 1995). The occurrence of subsequent processes, like magnetic braking or disk locking, might then slow down the stars. Thus it is reasonable to conclude that the high rotational velocity observed in the FR BSSs of Centauri is the observational confirmation that significant transfer of angular momentum occurs during the MT-BSS formation process. An additional support comes from the fact that all the 6 W Uma stars in our sample are FR BSSs (with sin i km s-1). These variables are compact binary systems experiencing an active phase of MT, and their evolution is thought to lead to the total coalescence of the two components, eventually forming a BSS (Vilhu, 1982). Note that W UMa stars with high rotational velocities have been found also in 47 Tuc (Ferraro et al., 2006a), M4 (Lovisi et al., 2010) and M30 (Lovisi et al., 2013b). Only two W UMa stars with slow rotational velocities have been observed (in 47 Tuc; see Ferraro et al., 2006a), and both show evidence of CO-depletion on their surfaces, which is interpreted as the chemical signature of the MT process. This might suggest that these stars have been caught when they are still accelerating toward very high rotational velocities: enough CO-depleted material was already transferred onto the secondary to be detectable in its atmosphere and the star rotational velocity is not yet too high to prevent the spectroscopic measurement of chemical abundances. Under the assumption that most of the BSSs in Centauri are generated by MT, the discovered FRs could either be recently formed BSSs (for which the braking mechanisms have not had enough time yet to be effective), or, for some unknown reason, they could have been able to preserve longer their initial high rotation. Indeed, no significant distinction between fast and slowly rotating BSSs pointing toward a different formation epoch has been observed in the CMD. On the other hand, the detailed efficiencies and time-scales of the braking mechanisms are still not known and therefore firm conclusions are hard to be drawn here. However, the observed radial distribution of fast and slow rotating BSSs, with a possible central peak and a significant outward rise of the fraction of fast spinning BSSs, seems to suggest that environment can play a role in this game. In particular, it could indicate either that recently formed MT-BSSs prevail in the outskirts of Centauri, or that braking processes are least efficient in the lowest density regions of the system. The slight increase observed within may suggest that stellar interactions can contribute to transfer angular momentum and accelerate BSSs (see also Lovisi et al., 2010 and SP14). So far, such a distribution has been detected only in Centauri and further determinations of rotational velocities for large samples of BSSs in other clusters are needed to provide a solid answer about the ubiquity of this phenomenon.
References
- Anderson & van der Marel (2010) Anderson, J., & van der Marel, R. P., 2010, ApJ, 710, 1032
- Beccari et al. (2006) Beccari, G., Ferraro, F. R., Possenti, A., et al. 2006, AJ, 131, 2551
- Beccari et al. (2011) Beccari, G., Sollima, A., Ferraro, F. R., et al. 2011, ApJ, 737, L3
- Behr et al. (2000a) Behr, B B., Cohen, J. G., & McCarthy, J. K., 2000, ApJ, 531, L37
- Behr et al. (2000b) Behr, B B., Djorgovski, S. G., Cohen, J. G., et al., 2000, ApJ, 528, 849
- Bekki & Norris (2006) Bekki, K. & Norris, J. E., 2006, ApJ, 637, L109
- Benz & Hills (1987) Benz, W. & Hills, J. G, 1987, ApJ, 323, 614
- Bressan et al. (2012) Bressan, A., Marigo, P., Girardi, L., Salasnich, B., Dal Cero, C., Rubele, S., & Nanni, A., 2012, MNRAS, 427, 127
- Castelli & Kurucz (2004) Castelli, F. & Kurucz, R. L., 2004, astro-ph:5087
- Cortés et al. (2009) Cortes, C., Silva, J. R. P., Recio-Blanco, A., Catelan, M., Do Nascimento, J. D. Jr., & De Medeiros, J. R., 2009, ApJ, 704, 750
- Dalessandro et al. (2008a) Dalessandro, E., Lanzoni, B., Ferraro, F. R., et al. 2008a, ApJ, 681, 311
- Dalessandro et al. (2008b) Dalessandro, E., Lanzoni, B., Ferraro, F. R., et al. 2008b, ApJ, 677, 1069
- Dalessandro et al. (2013) Dalessandro, E., Ferraro, F. R., Massari, D., et al. 2013, ApJ, 778, 135
- De Marco et al. (2005) De Marco, O., Shara, M. M., Zurek, D., Ouellette, J. A., Lanz, T., Saffer, R. A., & Spinsky, J. F., 2005, ApJ, 632, 894
- Dinescu et al. (1999) Dinescu, D. I., Girard, T. M., & van Altena, W. F., 1999, AJ, 117, 1792
- Dufton et al. (2011) Dufton, P. L. et al., 2011, ApJ, 743L, 22
- Espinosa Lara & Rieutord (2011) Espinosa Lara, F., & Rieutord, M., 2011, A&A, 533, 43
- Ferraro et al. (1992) Ferraro, F. R., Fusi Pecci, F., & Buonanno, R. 1992, MNRAS, 256, 376
- Ferraro et al. (1993) Ferraro, F. R., Pecci, F. F., Cacciari, C., et al. 1993, AJ, 106, 2324
- Ferraro et al. (1995) Ferraro, F. R., Fusi Pecci, F., & Bellazzini, M. 1995, A&A, 294, 80
- Ferraro et al. (1997) Ferraro, F. R., Paltrinieri, B., Fusi Pecci, F., et al. 1997, A&A, 324, 915
- Ferraro et al. (2001) Ferraro, F. R., D’Amico, N., Possenti, A., Mignani, R. P., & Paltrinieri, B. 2001, ApJ, 561, 337
- Ferraro et al. (2003) Ferraro, F. R., Sills, A., Rood, R. T., Paltrinieri, B., & Buonanno, R. 2003, ApJ, 588, 464
- Ferraro et al. (2004) Ferraro, F. R., Sollima, A., Pancino, E., et al. 2004, ApJ, 603, L81
- Ferraro et al. (2006a) Ferraro, F. R., et al., 2006a, ApJ, 647, L53
- Ferraro et al. (2006b) Ferraro, F. R., Sollima, A., Rood, R. T., Origlia, L., Pancino, E. & Bellazzini, M., 2006b, ApJ, 638, 433
- Ferraro et al. (2009a) Ferraro, F. R., Beccari, G., Dalessandro, E., et al. 2009a, Nature, 462, 1028
- Ferraro et al. (2009b) Ferraro, F. R., Dalessandro, E., Mucciarelli, A., et al. 2009b, Nature, 462, 483
- Ferraro et al. (2012) Ferraro, F. R., et al., 2012, Nature, 492, 393
- Fiorentino et al. (2014) Fiorentino, G., Lanzoni, B., Dalessandro, E., et al. 2014, ApJ, 783, 34
- Fuhrmann et al. (1993) Furhmann, K., Axer, M., & Gehren, T., 1993, A&A, 271, 451
- Gilliland et al. (1998) Gilliland, R. L., Bono, G., Edmonds, P. D., Caputo, F., Cassisi, S., Petro, L. D., Saha, A., & Shara, M. M., 1998, apJ, 507, 818
- Grundahl et al. (1999) Grundahl, F., Catelan, M., Landsman, W. B., Stetson, P. B., & Andersen, M. I., 1999, ApJ, 524, 242
- Johnson & Sandage (1955) Johnson, H. L., & Sandage, A. R. 1955, ApJ, 121, 616
- Johnson & Pilachowski (2010) Johnson, C. I., & Pilachowski, C. A. 2010, ApJ, 722, 1373
- Harris (1996) Harris, W. E., 1996, AJ, 112, 1487
- Hills & Day (1976) Hills, J. G., & Day, C. A., 1976, ApL, 17, 87
- Kaluzny et al. (2004) Kaluzny, J., Olech, A., Thompson, I. B., Krzeminski, W. & Schwarzenberg-Czerny, A., 2004, A&A, 424, 1101
- Kurucz (2005) Kurucz, R. L., 2005, Memorie della Societá Astronomica Italiana Supplementi, 8, 14
- Lombardi et al. (1995) Lombardi, J. C. Jr., Rasio, F. A., & Shapiro, S. L., 1995, ApJ, 445L, 117
- Leonard & Livio (1995) Leonard P. J. T., & Livio, M., 1995, ApJ, 447, L121
- Lanzoni et al. (2007a) Lanzoni, B., Sanna, N., Ferraro, F. R., et al. 2007a, ApJ, 663, 1040
- Lanzoni et al. (2007b) Lanzoni, B., Dalessandro, E., Ferraro, F. R., et al. 2007b, ApJ, 663, 267
- Lanzoni et al. (2007c) Lanzoni, B., Dalessandro, E., Ferraro, F. R., et al. 2007c, ApJ, 668, L139
- Lee et al. (1999) Lee, Y.-W., Joo, J.-M., Sohn, Y.-J., et al. 1999, Nature, 402, 55
- Leigh et al. (2007) Leigh, N., Sills, A., & Knigge, C. 2007, ApJ, 661, 210
- Lovisi et al. (2010) Lovisi, L., Mucciarelli, A., Ferraro, F. R., Lucatello, S., Lanzoni, B., Dalessandro, E, Beccari, G., Rood, R. T., Sills, A., Fusi Pecci, F., Gratton, R., & Piotto, G., 2010, ApJ, 719L, 121
- Lovisi et al. (2012) Lovisi, L., Mucciarelli, A., Lanzoni, B., Ferraro, F. R., Gratton, R., Dalessandro, E., & Contreras Ramos, R., 2012, ApJ, 754, 91
- Lovisi et al. (2013a) Lovisi, L., Mucciarelli, A., Lanzoni, B., Ferraro, F. R., Dalessandro, E., & Monaco, L., 2013a, ApJ, 772, 148
- Lovisi et al. (2013b) Lovisi, L., Mucciarelli, A., Dalessandro, E., Ferraro, F. R., & Lanzoni, B., 2013b, ApJ, 778, 64
- Lucatello & Gratton (2003) Lucatello, S., & Gratton, R. G., 2003, A&A, 406, 691
- Majewski et al. (2000) Majewski, S. R., Osrheimer, J. C., Kunkel. W. E., & Patterson, R. J., 2000, AJ, 120, 2550
- Mayor et al. (1997) Mayor, M., et al., 1997, AJ, 114, 1087
- Mapelli et al. (2004) Mapelli, M., Sigurdsson, S., Colpi, M., et al. 2004, ApJ, 605, L29
- Mapelli et al. (2006) Mapelli, M., Sigurdsson, S., Ferraro, F. R., et al. 2006, MNRAS, 373, 361
- Mapelli et al. (2009) Mapelli, M., Ripamonti, E., Battaglia, G., et al. 2009, MNRAS, 396, 1771
- Mashonkina et al. (2011) Mashonkina, L., Gehren, T., Shi, J.-R., Korn, A. J., & Grupp, F., 2011, A&A, 528, A87
- Mathieu & Geller (2009) Mathieu, R. D., & Geller, A. M. 2009, Nature, 462, 1032
- McCrea (1964) McCrea, W. H., 1964, MNRAS, 128, 335
- Momany et al. (2007) Momany, Y., Held, E. V., Saviane, I., Zaggia, S., Rizzi, L., & Gullieuszik, M., 2007, A&A, 468, 973
- Monaco et al. (2010) Monaco, L., Bonifacio, P., Sbordone, L., Villanova, S., & Pancino, E., 2010, A&A, 519, L3
- Noyola et al. (2008) Noyola, E., Gebhardt, K., & Bergmann, M., 2008, ApJ, 676, 1008
- Norris & Da Costa (1995) Norris, J. E., & Da Costa, G. S. 1995, ApJ, 447, 680
- Olech et al. (2005) A. Olech, W. Dziembowski, A. Pamyatnykh, J. Kaluzny, W. Pych, A. Schwarzenberg-Czerny, I.B. Thompson, 2005, MNRAS, 363, 40
- Origlia et al. (2003) Origlia, L., Ferraro, F. R., Bellazzini, M., & Pancino, E. 2003, ApJ, 591, 916
- Origlia et al. (2011) Origlia, L., Rich, R. M., Ferraro, F. R., et al. 2011, ApJ, 726, L20
- Origlia et al. (2013) Origlia, L., Massari, D., Rich, R. M., et al. 2013, ApJ, 779, L5
- Pancino et al. (2000) Pancino, E., Ferraro, F. R., Bellazzini, M., Piotto, G., & Zoccali, M. 2000, ApJ, 534, L83
- Pancino et al. (2007) Pancino, E., Galfo, A., Ferraro, F. R., & Bellazzini, M., 2007, ApJ, 661L, 155
- Pasquini et al. (2002) Pasquini, L., Avila, G., Blecha, A., et al. 2002, The Messenger, 110, 1
- Peterson et al. (1995) Peterson, R. C., Rood, R. T., & Corcker, D. A., 1995, ApJ, 453, 214
- Pietrinferni et al. (2006) Pietrinferni, A., Cassisi, S., Salaris, M. & Castelli, F., 2006, ApJ, 642, 797
- Piotto et al. (2004) Piotto, G., De Angeli, F., King, I. R., et al. 2004, ApJ, 604, L109
- Preston & Sneden (2000) Preston, G. W., & Sneden, C. 2000, AJ, 120, 1014
- Ramirez-Agudelo et al. (2013) Ramirez-Agudelo, O. H., et al., 2013, arXiv1309.2929
- Robin et al. (2003) Robin, A. C., Reylé, C., Derriére, S. & Picaud, S., 2003, A&A, 409, 523
- Sabbi et al. (2004) Sabbi, E., Ferraro, F. R., Sills, A., & Rood, R. T. 2004, ApJ, 617, 1296
- Sandage (1953) Sandage, A. R. 1953, AJ, 58, 61
- Sarna & De Greve (1996) Sarna, M. J., & De Greve, J.-P., 1996, QJRAS, 37,11
- Sbordone et al. (2004) Sbordone, L., Bonifacio, P., Castelli, F., & Kurucz, R. L., 2004, Memorie della Societá Astronomica Italiana Supplementi, 5, 93
- Shara et al. (1997) Shara, M. M., Saffer, R. A., & Livio, M., 1997, ApJ, 489L, 59
- Sills et al. (2005) Sills, A., Adams, T., & Davies, M. B., 2005, MNRAS, 358, 716
- Sollima et al. (2005) Sollima, A., Pancino, E., Ferraro, F. R., et al. 2005, ApJ, 634, 332
- Sollima et al. (2009) Sollima, A., Bellazzini, M., Smart, R. L., Correnti, M., Pancino, E., Ferraro, F. R., & Romano, D. , 2009, MNRAS, 396, 2183
- Simunovic & Puzia (2014) Simunovic, M., & Puzia, T. H., 2014, ApJ, 782, 49 (SP14)
- Tonry & Davis (1979) Tonry, J. & Davis, M., 1979, AJ, 84, 1511
- Towsend et al. (2004) Townsend, R. H. D., Owocki, S. P. & Howarth, I. D., 2004, MNRAS, 350, 189
- van Leeuwen et al. (2000) van Leeuwen, F., Le Poole, R. S., Reijns, R. A., Freeman, K. C., & de Zeeuw, P. T., 2000, A&A, 360, 472
- van Loon et al. (2009) van Loon, J. Th., Smith, K. T., McDonald, I., Sarre, P. J., Sharp, R. G., 2009, MNRAS, 399, 195
- Vilhu (1982) Vilhu, O., 1982, A&A, 109, 17
- von Zeipel (1924) von Ziepel, H., 1924, MNRAS, 84, 665


| ID | Ra | Dec | RV | sin i | Dataset | Variable | ||
|---|---|---|---|---|---|---|---|---|
| (J2000) | (J2000) | (K) | (km s-1) | (km s-1) | ||||
| 6365 | 201.6079938 | -47.4235140 | 8762 | 4.33 | 221.8 | 9 | 1 | — |
| 6452 | 201.6147225 | -47.4540869 | 7770 | 4.29 | 220.7 | 0 | 2 | — |
| 15741 | 201.6117617 | -47.4889112 | 9204 | 4.15 | 214.6 | 3 | 1 | — |
| 15822 | 201.5894328 | -47.4673384 | 8762 | 4.33 | 226.4 | 131 | 1 | — |
| 15913 | 201.5705488 | -47.4571373 | 8128 | 4.29 | 226.7 | 28 | 1 | V217 (SX) |
| 25168 | 201.6458578 | -47.5029603 | 8158 | 4.06 | 238.9 | 45 | 1 | — |
| 25256 | 201.6394925 | -47.4735261 | 8341 | 4.16 | 241.3 | 10 | 1 | — |
| 25497 | 201.6330705 | -47.4759309 | 7838 | 4.15 | 225.6 | 61 | 1 | — |
| 45771 | 201.6301436 | -47.5559363 | 7909 | 3.89 | 229.6 | 11 | 1–2 | — |
| 45842 | 201.6315878 | -47.5197093 | 9634 | 4.46 | 231.9 | 20 | 1 | — |
| 45881 | 201.6323122 | -47.5325120 | 8341 | 4.16 | 229.0 | 48 | 1–2 | NV310 (SX) |
| 45952 | 201.6438653 | -47.5175900 | 8128 | 4.29 | 244.6 | 34 | 1 | V198 (SX) |
| 45972 | 201.6188194 | -47.5173629 | 7770 | 4.29 | 216.1 | 16 | 2 | NV319 (SX) |
Note. — Identification number, coordinates, temperature, gravity, radial and rotational velocities, name of the spectroscopic Dataset and variable type for the observed BSSs with the corresponding name in the catalogs by Kaluzny et al. (2004) and Olech et al. (2005). A complete version of the table is available in electronic form.