Polarized Temperature Dependent Raman Study of Bi2Te3-Cr2Ge2Te6 heterostructure and the Ferromagnetic Insulator Cr2Ge2Te6
Abstract
Cr2Ge2Te6 has been of interest for decades, as it is one of only a few ferromagnetic insulators. Recently, this material has been revisited due to its potential as a substrate for Bi2Te3, a topological insulator. This enables the possibility of studying the anomalous quantum Hall effect in topological insulators, and a route to novel spintronic devices. To probe the compatibility of these two materials, we use polarized variable temperature Raman microscopy to study Bi2Te3-Cr2Ge2Te6 heterostructure as well as the phonon dynamics of Cr2Ge2Te6. We found the temperature dependence of the Cr2Ge2Te6 phonons results primarily from anharmonicity, though a small magneto-elastic coupling is also observed. Our results confirm the potential of Cr2Ge2Te6 as a substrate for topological insulators.
Cr2Ge2Te6 is a particularly interesting material since it is in the very rare class of ferromagnetic insulators, and possesses a layered, nearly two dimensional structure.Carteaux et al. (1995) Recently this material has been revisited due to its small lattice mismatch with the topological insulator Bi2Te3, making it an ideal candidate as a substrate for novel devices.Ji et al. (2013) Indeed, if Cr2Ge2Te6 has a strong magnetic exchange with the Bi2Te3 film, it is predicted to reveal the anomalous quantum hall state.Hasan and Kane (2010); Fu and Kane (2009); Alegria et al. (2014) This may enable future topological and spintronic devices. Nonetheless this requires cooling below the Tc of the Cr2Ge2Te6, and thus it is important to establish the compatibility between the two materials at low temperatures. Furthermore, since the materials are van-der-waals bonded, magneto-elastic coupling between them is a likely exchange pathway. Thus understanding the phonon dynamics in Cr2Ge2Te6 is crucial for determining its suitability as a potential substrate for topological devices.
Temperature dependent Raman scattering has been widely used to probe phonon dynamics as well as check the compatibility of compounds.Hushur, Manghnani, and Narayan (2009); Oznuluer et al. (2011); Lin et al. (2011) Indeed, one can monitor the phonons and their respective symmetry to ensure no major change in the lattice occurs upon cooling, by controlling the polarization of the excitation source and detected photons.Singh et al. (2006); Beekman et al. (2012) Also, the temperature dependence of the Raman scattering can uncover the magneto-elastic coupling.Pandey et al. (2013) In this letter, we first check the compatibility between Bi2Te3 and Cr2Ge2Te6 by performing Raman measurements at 293 K and 10 K on a Bi2Te3-Cr2Ge2Te6 heterostructure. Then, we focus on the polarized temperature dependent Raman spectra of Cr2Ge2Te6, which reveal no major changes in the lattice at low temperatures. Furthermore we find the phonon temperature dependence is primarily governed by anharmonicity, though there are also small magneto-elastic effects. Thus lattice compatibility between Bi2Te3 and Cr2Ge2Te6 is maintained at low temperatures, and the magneto-elastic effect may provide a route to coupling between the two.
The heterostructure in this study was grown by MOCVD deposition of Bi2Te3 on Cr2Ge2Te3. The single crystal Cr2Ge2Te6 was grown with high purity elements heated to 700oC. Detailed growth procedures of both materials can be found elsewhere.Ji et al. (2013) The Raman spectra on the heterostructure were taken in a backscattering configuration with a home-built Raman microscope. A Tornado Hyperflux U1 spectrometer with a cooled Andor iDus charge-coupled device(CCD) was used to record the data. Two Ondax Ultra-narrow-band Notch Filters were used to reject Rayleigh scattering. This also allows us to observe both Stokes and anti-Stokes Raman shifts. A solid-state 532 nm laser was used for the excitation. The sample was glued by silver paint onto a copper mount sitting in a commercial optical microscopy cryostat from Cryo Industries of America, Inc. A glass compensated Mitutoyo long working distance 50x (N.A.=0.42) objective was used for excitation as well as collection, resulting in a laser spot of 8 m in diameter. The laser power was kept fairly low (300 W) to avoid laser-induced heating. This was checked at 8 K by monitoring the anti-Stokes signal as the laser power was reduced. Once the anti-Stokes signal disappeared, the power was cut an additional . The spectra were recorded with a polarizer in front of the spectrometer.
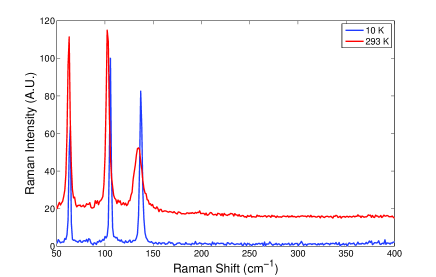
The Raman spectra from the Bi2Te3-Cr2Ge2Te6 heterostructure are shown in FIG.1. Only the phonons of Bi2Te3 are observed, since the penetration depth of Bi2Te3 (20nm) is much smaller than the thickness of the film (100nm). The phonon peaks of Bi2Te3 at 293 K agree very well with the literature.Li et al. (2012) As temperature decreases, the three phonons slightly harden and become sharper at 10 K, which we attribute to anharmonic renormalization. No new modes or dramatic changes in the spectra were observed. This suggests Cr2Ge2Te6 and Bi2Te3 are well matched.
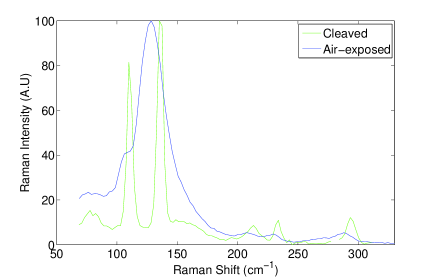
To confirm the compatibility of these two materials, we focused on the temperature dependent Raman spectra of Cr2Ge2Te6. This analysis was complicated by the oxidation of the Cr2Ge2Te6 surface. Indeed, it is well known that exposure to air can result in oxides on the surface that dominate the Raman spectra.Xia et al. (2009) The strong aging effect was also observed in Cr2Ge2Te6. In FIG.2 we show the Raman spectra of air-exposed and freshly cleaved Cr2Ge2Te6 samples. The air-exposed sample reveals fewer phonon modes, that are also quite broad, suggesting the formation of an oxide. A similar phenomena was also observed in other materials.Avachev et al. (2012)
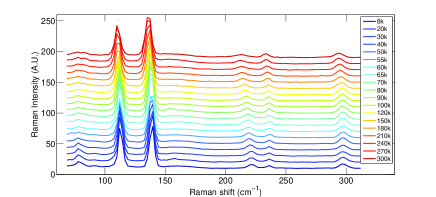
In FIG.3, we show the colinearly polarized(XX) Raman specta of Cr2Ge2Te6 from room temperature to 8 K. The sharpness of the phonon peaks indicates the high quality of the crystal. From the plot, we can see that there are six phonon peaks visible in the whole temperature range. At 8 K, their center frequencies are 78.7 cm-1 ,113.0 cm-1, 138.8 cm-1 ,221.4 cm-1, 236.1 cm-1 and 297.4 cm-1. While the small temperature induced shifts in the phonons suggests no major change in lattice constant, as discussed below, we can also search for symmetry breaking by looking at the polarization dependence.
From group theory analysis, the space group of single crystal Cr2Ge2Te6 is R-3 (No.148). The point group is C3i. There are six inequivalent irreducible representations in the C3i point group. They are Ag, E1g, E2g, Au, E1u and E2u respectively. All irreducible representations for the C3i point group are one dimensional. However E1g and E2g are inequivalent conjugate representations. In this case, if the time reversal symmetry is not broken, the eigenstates of E1g and E2g representation are degenerate. This holds for E1u and E2u representations as well. In the Cr2Ge2Te6 unit cell, there are 10 atoms which gives 30-phonon branches at the point of the Brillouin zone. The 30 phonon branches are = Au + E1u+ E2u and = 5Ag + 4Au + 5E1g + 4E1u+ 5E2g + 4E2u respectively. Because, the space group R-3 has inversion symmetry, theoretically all the optical modes are either IR-active or Raman-active. The IR-active modes are 4Au + 4E1u + 4E2u and the Raman-active modes are 5Ag + 5E1g + 5E2g. Here, the letter A means the phonon is non-degenerate and E means the phonon is double-degenerate for the reason explained above. We expect to see 10 Raman-active modes, because the E1g and E2g mode are not distinguishable by energy. In the Raman spectra (Fig. 3), 6 modes were observed, the other four phonons might be too weak or out of our spectra range.Jandl, Cavellin, and Harbec (1979)
To analyze the polarization dependence, it is instructive to consider the relationship between the Raman tensor for a given mode (R) and the measured intensity IR,
| (1) |
where , are the polarization of the out-going and the incoming photon respectively. The Raman tensors of phonon of Ag, E1g and E2g symmetry are shown below.
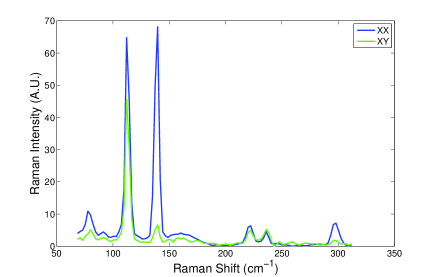
From the Raman tensor, we know that all three modes should be visible in the colinear polarized(XX) geometry and the Ag modes should vanish in crossed polarized(XY) geometry (note the absence of off diagonal elements in A1g). To gain insight into the symmetry of the modes, we compare the spectra taken at 8 K in XX and XY configurations. As can be seen from FIG.4, only the two modes located at 138.8 cm-1 and 297.4 cm-1 vanish in XY configuration. Therefore these two modes are of Ag symmetry, and the other four modes are of Eg symmetry. Furthermore we confirmed the symmetry is maintained at all temperature measured (not shown).
In order to analyse the phonon temperature dependent behavior, we used the Lorentz model to fit each individual phonon peak at all temperatures. The mode located at 78.7 cm-1 has relatively low intensity between 100 K to 300 K, and thus was excluded from our fitting procedure. We show the resulting phonon frequencies in FIG.5, which all harden as temperature is decreased. This result is not surprising since the anharmonic interaction leads to a renormalization of the phonon self energy by both decay and fusion processes. However, the fusion process, where two or more phonons fuse into a zone-center phonon, is usually very slow due to the low population of phonons at low temperature.Usher and Srivastava (1994) This indicates that the scattering is almost exclusively governed by the decay process. Ultimately, this results in a temperature dependent renormalization of the real (frequency) and imaginary (inverse lifetime) parts of the phonon self-energy. To further quantitatively analyze the anharmonic effect, we use a simple model which takes the cubic and quartic anharmonic decay into account. In this model, the temperature dependence of the phonon frequency is described by the formula,Balkanski, Wallis, and Haro (1983)
| (2) | |||
| (3) |
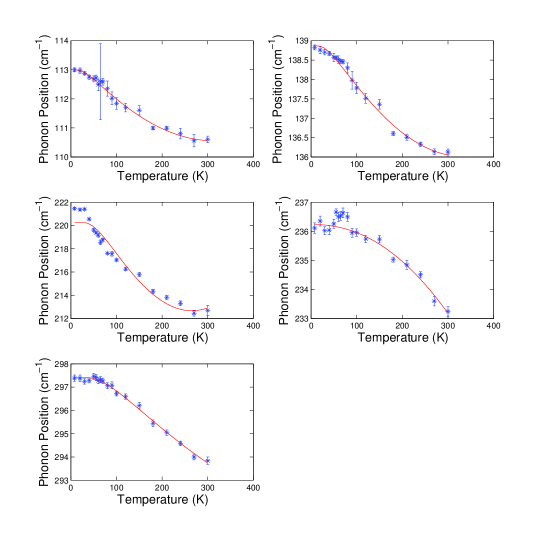
where is the phonon position at 0 K, T is the temperature, C,D are constants determined by the cubic and quartic anharmonicity respectively, x = /2 and y = /3. The first term in equation 3 describes the optical phonon decay into two phonons with opposite momenta and half the energy of the original phonon. The second term describes the optical phonon decay into three phonons with a third of the energy of the optical phonon. The results of fitting, the temperature dependence of the phonon shifts with equation 3 are shown in FIG.5. From the plot we can see the anharmonic interaction model works reasonably well for all but the 212 cm-1 mode. The resulting parameters for the anharmonic interaction are shown in Table.LABEL:fit_result. From the table we can see that the four-phonon interaction is much weaker, as is expected.Balkanski, Wallis, and Haro (1983) Below Tc, the mode at 212 cm-1 shifts more rapidly than the than the prediction of the anharmonic model. This is likely caused by magneto-elastic coupling in Cr2Ge2Te6.Pandey et al. (2013); Burch et al. (2008)
In summary, we verified the compatibility of Bi2Te3-Cr2Ge2Te6 heterostructure by Raman spectroscopy at 10 K and 293 K. The stability of the Cr2Ge2Te6 single crystal was also studied using polarized variable temperature Raman spectroscopy. Six phonons were observed and they were explained by anharmonic interaction. A weak sign of the magneto-elastic coupling has also been observed, suggesting an additional pathway for magnetic coupling between the two materials. Thus we have shown the utility of using Cr2Ge2Te6 as a substrate for future devices.
Work at the University of Toronto was supported by NSERC, CFI, and ORF.
| C | Error | D | Error | Error | |
|---|---|---|---|---|---|
| -0.835 | 0.138 | 0.032 | 0.0102 | 113.0 | 0.200 |
| -1.19 | 0.19 | 0.0525 | 0.0168 | 138.9 | 0.250 |
| -9.70 | 3.06 | 0.865 | 0.403 | 220.2 | 2.95 |
| -1.3 | 0.171 | 0.0203 | 0.0097 | 236.5 | 0.300 |
| -2.93 | 0.763 | 0.147 | 0.120 | 297.2 | 0.700 |
References
- Carteaux et al. (1995) V. Carteaux, D. Brunet, G. Ouvrard, and G. Andre, Journal of Physics: Condensed Matter 7, 69 (1995).
- Ji et al. (2013) H. Ji, R. A. Stokes, L. D. Alegria, E. C. Blomberg, M. A. Tanatar, A. Reijnders, L. M. Schoop, T. Liang, R. Prozorov, K. S. Burch, N. P. Ong, J. R. Petta, and R. J. Cava, Journal of Applied Physics 114, 114907 (2013).
- Hasan and Kane (2010) M. Hasan and C. Kane, Reviews of Modern Physics 82, 3045 (2010).
- Fu and Kane (2009) L. Fu and C. Kane, Physical Review Letters 102, 216403 (2009).
- Alegria et al. (2014) L. D. Alegria, H. Ji, N. Yao, J. J. Clarke, R. J. Cava, and J. R. Petta, Applied Physics Letters 105, 053512 (2014).
- Hushur, Manghnani, and Narayan (2009) A. Hushur, M. H. Manghnani, and J. Narayan, Journal of Applied Physics 106, 054317 (2009).
- Oznuluer et al. (2011) T. Oznuluer, E. Pince, E. O. Polat, O. Balci, O. Salihoglu, and C. Kocabas, Applied Physics Letters 98, 183101 (2011).
- Lin et al. (2011) J. Lin, L. Guo, Q. Huang, Y. Jia, K. Li, X. Lai, and X. Chen, Phys. Rev. B 83, 125430 (2011).
- Singh et al. (2006) M. K. Singh, H. M. Jang, S. Ryu, and M.-H. Jo, Applied Physics Letters 88, 042907 (2006).
- Beekman et al. (2012) C. Beekman, A. A. Reijnders, Y. S. Oh, S. W. Cheong, and K. S. Burch, Phys. Rev. B 86, 020403 (2012).
- Pandey et al. (2013) P. K. Pandey, R. J. Choudhary, D. K. Mishra, V. G. Sathe, and D. M. Phase, Applied Physics Letters 102, 142401 (2013).
- Li et al. (2012) D. Li, L. Li, D.-W. Liu, and J.-F. Li, physica status solidi (RRL) – Rapid Research Letters 6, 268 (2012).
- Xia et al. (2009) T.-L. Xia, D. Hou, S. C. Zhao, A. M. Zhang, G. F. Chen, J. L. Luo, N. L. Wang, J. H. Wei, Z.-Y. Lu, and Q. M. Zhang, Phys. Rev. B 79, 140510 (2009).
- Avachev et al. (2012) A. Avachev, S. Vikhrov, N. Vishnyakov, S. Kozyukhin, K. Mitrofanov, and E. Terukov, Semiconductors 46, 591 (2012).
- Jandl, Cavellin, and Harbec (1979) S. Jandl, C. Cavellin, and J. Harbec, Solid State Communications 31, 351 (1979).
- Usher and Srivastava (1994) S. Usher and G. P. Srivastava, Phys. Rev. B 50, 14179 (1994).
- Balkanski, Wallis, and Haro (1983) M. Balkanski, R. F. Wallis, and E. Haro, Phys. Rev. B 28, 1928 (1983).
- Burch et al. (2008) K. S. Burch, E. E. M. Chia, D. Talbayev, B. C. Sales, D. Mandrus, A. J. Taylor, and R. D. Averitt, Phys. Rev. Lett. 100, 026409 (2008).