Counter Data of the Cosmic Dust Analyzer aboard the Cassini spacecraft and possible “dust clouds” at Saturn
Abstract
We present the impact rates of dust particles recorded by the Cosmic Dust Analyzer (CDA) aboard the Cassini spacecraft. The “dust counters” evaluate the quality of an impact and give rise to the apparent density of dust particles in space.
The raw data is pre-selected and refined to a new structure that serves to a better investigation of densities, flows, and properties of interplanetary dust grains. Our data is corrected for the dead time of the instrument and corresponds to an assumed Kepler orbit (pointing of the sensitive area). The processed data are published on the website for the Magnetosphere and Plasma Science (MAPSview), where it can be correlated with other Cassini instruments.
A sample is presented for the Titan flyby on DOY 250/2006. We find that the dust density peaks at two times, at least, in a void region between Titan and Rhea. Such features may point to extended clouds of small particles drifting slowly in space. These density clouds seem to be stable for as long as several months or few years before dispersing.
keywords:
Saturn , Cassini , cosmic dust , CDA data analysis , dust clouds1 Introduction
The Cosmic Dust Analyzer (CDA) aboard the Cassini spacecraft is an instrument to study the physical and chemical properties of dust particles in the interplanetary space (Srama, Ahrens, Altobelli et al., 2004). It consists of two subsystems working separately:
-
1.
The main sensor is the Dust Analyzer (DA) designed to analyse the particles according to their speed, mass, charge, chemistry, and impact direction. It deploys a time-of-flight mass spectrometer. The sensitive area of the Impact Ionisation Detector (IID) is 0.0825 m2, and Chemical Analyzer Target (CAT) is 0.0073 m2.
-
2.
The High-Rate Detector (HRD) only counts the number of impacts with a frequency of up to 10,000 counts per second. It is a simple impact trigger with an area of 60 cm2.
The general purpose is to quantify the dust density in the interplanetary space during the spacecraft cruise as well as the dust environment at Saturn. A permanent mapping of all directions is not possible because of the fixed position of the CDA on a 3-axis stabilised spacecraft. However, a designated turntable of the CDA allows some re-directioning of the boresight (aperture axis).
We introduce the “dust counters” that serve to investigate local densities, particle flows, and their properties measured along the Cassini trajectory (Khalisi & Srama, 2012). The original data (raw data) of the CDA is stored in a MySQL database on a computer server at the Max-Planck-Institute for Nuclear Physics in Heidelberg, Germany, and Institute for Space Systems at the University of Stuttgart.
We wrote an IDL code that unites similar features in the pristine data. Additionally, the code returns useful graphics or correlates various physical parameters about the distribution of dust. Our code does not dispense the original data but serves as a helping tool if a more concise format is desired, e.g. for comparison with other instruments on Cassini. That pre-processed data can be accessed in the MAPSview database (Magnetosphere and Plasma Science) at http://mapsview.engin.umich.edu/.
2 Description of the Impact Counters
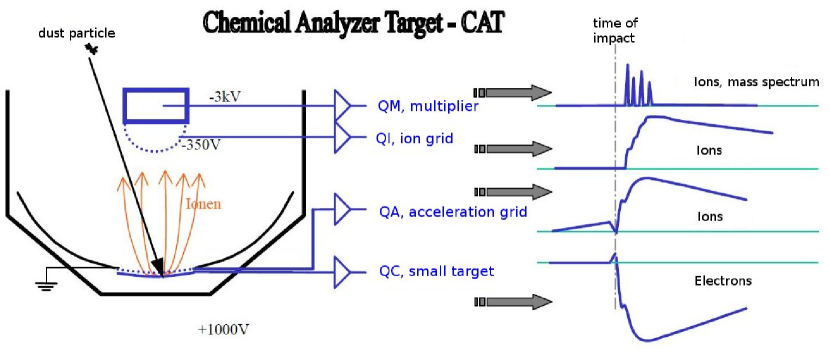
The “dust counters” are an array of 27 enumerators for certain impact properties valid after DOY 150/2005. Each event is analysed by the onboard flight software immediately after its occurrence. A dust grain hitting the sensitive area of the detector will produce various signals that are subject to a classification (Srama et al. 2006). For example, the QI-signal approximately indicates the impact energy as returned by the ion multiplier, while attributes like “charge” and “velocity” are exploited by the QP-signal at the entrance grid (Fig. 1). When spectral lines are present, the impact is supposed to have hit the CAT rather than the IID.
The combined properties of all electronic signals are interpreted by a decision making algorithm as such that the counters act like “containers” or “categories” for some common characteristics among the various dust particles. The most important quantity for decision is the QI-signal as given in column 3 of Table 1 as an example.
| cnt | name | QI [ C] | description | prior. | |
| 0 | A0 | (200 dn) | CAT big, 3 mass lines | 2 | |
| 1 | A1 | (170 dn) | CAT medium, 3 mass lines | 3 | |
| 2 | A2 | (130 dn) | CAT big, 2 mass lines | 4 | |
| 3 | A3 | (100 dn) | CAT medium, 2 mass lines | 5 | |
| 4 | A4 | ( 70 dn) | CAT small, 2 mass lines | 15 | |
| 5 | A5 | ( 45 dn) | CAT tiny, 2 mass lines | 17 | |
| 6 | A6 | ( 30 dn) | CAT small, no lines | 18 | |
| 7 | A7 | ( 20 dn) | CAT medium, relaxed | 16 | |
| 8 | I0 | (190 dn) | IID very big | 8 | |
| 9 | I1 | (160 dn) | IID big + fast | 9 | |
| 10 | I2 | (130 dn) | IID medium + fast | 10 | |
| 11 | I4 | ( 70 dn) | IID big + slow | 11 | |
| 12 | I5 | ( 45 dn) | IID medium + slow | 12 | |
| 13 | BO | both targets (QC + QT) | 22 | ||
| 14 | N1 | Noise: QI flare | signal on QI only | 1 | |
| 15 | S0 | spare: no function | 23 | ||
| 16 | A8 | ( 12 dn) | CAT tiny, 2 mass lines | 20 | |
| 17 | I3 | (100 dn) | IID small + fast | 13 | |
| 18 | I6 | ( 25 dn) | IID small + slow | 14 | |
| 19 | I7 | ( 14 dn) | IID tiny | 21 | |
| 20 | WO | ( 25 dn) | Wall impact medium | 6 | |
| 21 | W1 | ( 13 dn) | Wall impact tiny | 7 | |
| 22 | N0 | Noise: high baseline on QC | 19 | ||
| 23 | N2 | Noise: any other signals | 24 | ||
| 24 | T0 | Test pulse: o.k. | A1 | ||
| 25 | T1 | Test pulse: wrong | A2 | ||
| 26 | E0 | internal interrupt counter | – | ||
The algorithm is priority-sequenced (last column of Tab. 1). For example, the first check is whether the necessary signals are present at all, otherwise the event will be classified as “QI-flare” (N1, see below). Afterwards, the criteria for strong impacts on the CAT are checked and whether a spectrum exists (A0 – A3). If not, then the event must have occurred elsewhere (Wall, IID, etc.) but on the chemical target. After having passed that onboard algorithm, each impact event is assigned to one of the 27 counters (column 2) and gets a qualitative name, e.g. “big” or “slow” (column 4). A “strong” event can be caused by a massive but slow particle as well as a small and very fast particle. If the essential conditions of a special counter are met, its value is enhanced by 1, and the search terminates. If not, the next criteria are checked unless an appropriate counter will be found. Each impact is assigned to one unique counter. The objective of that style is to accumulate the particles with special features in order to compare their frequency of occurrence.
The classification scheme follows a threefold pattern:
-
1.
A0 – A8: counter names for the CAT. These are signals showing mass lines on the multiplier (QM signal) with a corresponding signal on the Chemical Analyser (QC signal); the impacts are further divided into 9 sub-classes (0 to 8) for large, medium, small responses as well as the number of line peaks on QM.
-
2.
I0 – I7: counter names for impacts on the IID; further division into 8 sub-classes (0 to 7) for fast and slow entrance velocities (QP signal at the entrance grid).
-
3.
others: ten more counters are for putative noise records, impacts on the non-sensitive area (“wall”), test pulses, and control modes.
The thresholds for the registration of a particle were changed throughout the mission to adjust for the ambiences of a particular occasion: dense regions, ring plane crossings, flybys at moons etc. For example, when flying through a dense cloud, the number of very small particles is high, and large impacts are rarely triggered. Then, the threshold was raised which resulted in a mode of lower sensitivity of the CDA. Therefore, the counters are a relative measure at different environments. This kind of local customisation is the main bias that we have to be aware of when using the data.
The counters were originally not meant for scientific use, but rather to roughly prioritize the events for the data readout from the spacecraft’s repository. The goal of altering thresholds was to select more important dust records for a transfer to Earth than noise events (Srama, 2009). The concept of the counters turned out to be interesting for correlations with properties that have been measured by other Cassini instruments.
3 Data Format for MAPSview
All counters are integer values. They are read out on a semi-regular time period of seconds (standard interval). Due to buffering effects and interrupts, this period can occur as fractions (e.g. 29 + 35 s or 24 + 40 s). However, multiples of 64 s can appear (128, 192, 256, etc.), when the CDA encountered failure times, or the downlink from the spacecraft was somehow affected. We rectified all interrupts smaller than 64 sec to ensure that no periods less than the “standard” is present in our data.
3.1 New counter groups
The original counter data of Table 1 are merged into 6 congeneric groups and later converted into dust densities. The six new groups are given in Table 2. We distinguish between impacts on the “CAT” and “IIT”. The so-called “wall” events happen when only the QP-signal at the entrance grid rises, but no others are noticeable; such a particle seems to have entered the CDA hitting the non-sensitive inner housing (wall). “qi” events are sudden flares on the ion collector (QI) without accompanying signals elsewhere; they cannot reliably be assigned to a particle impact. Other signals of unknown origin, mostly weak ones, are called “noise”. The last group, “iitbig”, is a subgroup of “iit” and receives special attention.
| Group name | Counters (after DOY 150/2005) |
|---|---|
| noise | B0 + N0 + N2 |
| wall | W0 + W1 |
| cat | A0 + A1 + A2 + A3 + A4 + A5 + A6 + A7 + A8 |
| iit | I0 + I1 + I2 + I3 + I4 + I5 + I6 + I7 |
| iitbig | I0 + I1 + I2 + I4 + I5 |
| qi | N1 |
| all | noise + wall + cat + iit + qi |
We combined relevant counters in order to simplify the analysis. Our goal is to investigate both a rougher mesh for the multiple kinds of particles and a concise time scale with accumulated impact events. Micrometre-sized dust particles are still rare in the environment of Saturn, therefore, it takes sometimes many hours of no sole impact (being regulated by the threshold for triggering).
3.2 Impact rates
Since our counter groups contain integer values that may or may not change within a standard time interval, we converted them into impact rates . They are calculated by
| (1) |
where and are the particle numbers in the corresponding interval of measurement . The evaluation the impact event and storing takes up to 1 second which is called the “dead time” of the instrument since it is insensitive to registrations of other events. This finite response time causes an error in the determination of the true dust density in space: In dense regions, when the instrument is expected to go into saturation (), the impact rate will systematically be underestimated.
Since the statistics of dust impacts is based on the Poisson process, a reconstruction of the “true” rate, , is possible as far as the statistical distribution of the impact times is known. The details of the correction procedure are discussed by Kempf (2008) and Kempf (2012). To correct for the dead time of the impact rates, we employ the simplified formula by Srama (2009, his equation 3.43):
| (2) |
where s is a correction factor that emerges from empirical tests as the most suitable compromise. This formula yields almost identical results as the exact solution by Kempf (2008). Only if the instrument runs into saturation with impact frequencies s-1, the error exceeds 20%. The rates in equation (2) are applied to each counter group (noise, wall, cat, etc.) and re-calculated at each time interval. For example, to get the real rate, , of the dust impacts on the IIT at a given time, we find . A cross-check of our data samples for showed an ample credibility with results obtained via housekeeping data of the spacecraft.
3.3 Sensitive area and dust ram
Two more parameters are necessary to obtain the spatial density of the dust particles: the sensitive area and the velocity of the spacecraft. Since Cassini is stabilised in 3 axes, the CDA has a field of view of depending on the spacecraft’s orientation in space (boresight). However, the CDA has got an own pivoting table. Its rotation is called “articulation” (0∘ to 270∘ with the zero-angle pointing to the rear of the spacecraft). It allows a re-alignment of the boresight to gain some independence from the direction of flight. The articulation is changed as needed, typically once or twice per day.
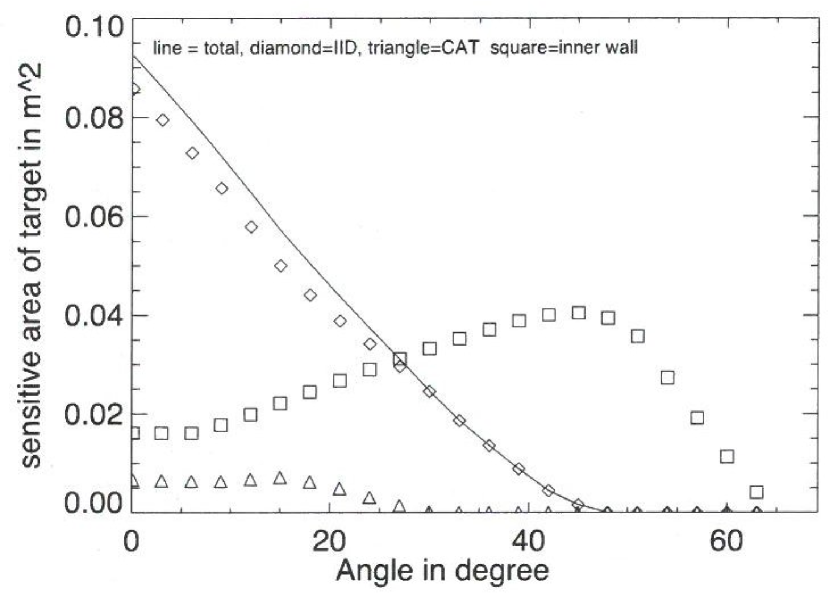
The sensitive area is shown in Figure 2. Calibration measurements with an isotropic flux of particles yield a decrease of sensitivity for increasing incidence angles. Impacts onto the non-sensitive housing (“wall impacts”) become predominant for angles . The measured rate is lowered when the axis of the instrument is turned by the angle , exibiting only its “effective area” to the particle flow. It is simply: , with being the total area of the CDA, which is = 0.09 m2. Obscuration by the ion collector in the focus was taken into account.
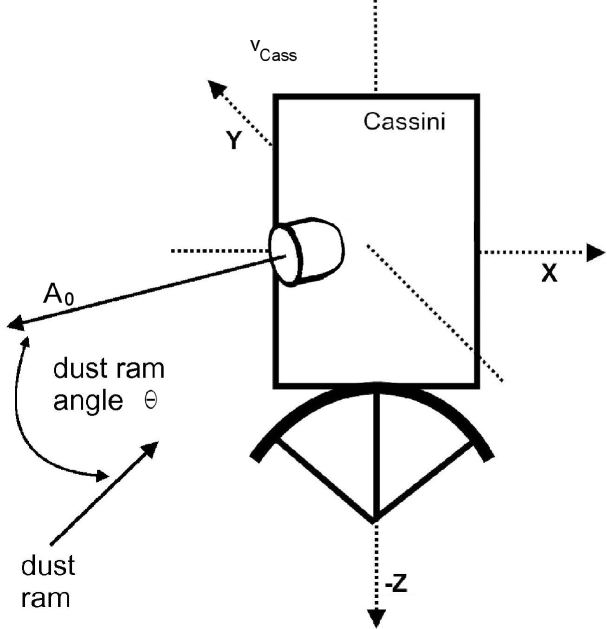
Note, that the articulation angle of the CDA does not contain information about the direction of dust flow! The particles can enter the CDA from any direction, since they could be part of a stream with unknown origin, or rubble piles, or stray bullets from a physical collision, or interlopers from interstellar space etc. Because of the lack of detailed information about the planetologic conditions, one assumption has to be made a priori, which is not necessarily true: The particle is supposed to have been on a circular prograde orbit around Saturn before hitting the CDA. That orbit marks the only trajectory to be reliably calculated. The angle between the boresight and the supposed flow of these particles is called the “dust ram angle” (Fig. 3). Thus, when the rate of wall impacts becomes abnormally high or events are registered while is zero, then the boresight of the CDA was aligned into a non-Keplerian direction.
3.4 Particle density
The velocity of the particles can be obtained from the difference of their Keplerian velocity and the speed of the spacecraft :
| (3) | |||||
| (4) |
where is the Gravitational constant, the mass of Saturn, and the distance of the particle from the planet’s center. is given in the ephemeris data of the Cassini mission. If the modulus deviates much from the particle velocity found through the QP-signal (cf. Chapter 2), then the particle would have been on a non-Keplerian orbit.
Finally, the local particle density is found as
| (5) |
where denotes the number of particles in the space volume ; is the dead time-corrected rate for each counter group as in eq. (2) within the interval . In case of , the density was set to zero. Since the dust records for most of the counter groups turn out to be rare events, we chose to provide only in our Table 3. Other sub-densities like , , etc. can be derived from eq. (5) using the corresponding and , respectively.
Table 3 shows an excerpt of the resulting matrix of impact rates and other parameters upon the alignment of the CDA for 40 minutes on the day 251/2006. We believe that such tables, structured for each day, comprehend the vast amount of spacecraft data to the more relevant details. The matrix is organised as follows:
-
1.
time of data readout, Julian Date, and the time leap , respectively;
-
2.
: number of registered impacts in the time interval ;
-
3.
six columns for the particle rates of each impact group of Table 2:
: rate of noise events
: rate of wall impacts
: rate of impacts on the CAT
: rate of impacts on the IID
: rate of very prominent impacts on the IID (sub-quantity of )
: rate of strong “flares” on the ion multiplier; -
4.
: the combined rate for all counters (without );
-
5.
: sensitive area; : dust velocity; and : particle density for all impacts registered ().
The complete set of our tables for the days 180/2005 to 109/2010 are publicly available at MAPSview (see Ch. 1).
| Date/Time | Jul.Day |
2006-251T04:57:31  2453986.7066123   64   36   0.000000   0.000000   0.000000   0.000000   0.000000   1.193634   1.193634   0.07187760  6187.6689  2.6838E-03
2006-251T04:58:35  2453986.7073531   64   42   0.000000   0.000000   0.000000   0.000000   0.000000   1.712887   1.712887   0.07187760  6190.0418  3.8498E-03
2006-251T04:59:39  2453986.7080938   64   39   0.000000   0.000000   0.000000   0.036576   0.000000   1.389905   1.426481   0.07187760  6190.0418  3.2061E-03
2006-251T05:00:43  2453986.7088345   64   40   0.000000   0.000000   0.000000   0.000000   0.000000   1.515151   1.515151   0.07187760  6192.4173  3.4041E-03
2006-251T05:01:47  2453986.7095753   64   42   0.000000   0.000000   0.000000   0.040783   0.000000   1.672104   1.712887   0.07187760  6192.4173  3.8484E-03
2006-251T05:02:51  2453986.7103160   64   45   0.000000   0.000000   0.000000   0.000000   0.000000   2.073733   2.073733   0.07187760  6194.7936  4.6573E-03
2006-251T05:03:55  2453986.7110567   64   41   0.000000   0.039277   0.000000   0.000000   0.000000   1.571092   1.610369   0.07187760  6194.7936  3.6166E-03
2006-251T05:04:59  2453986.7117975   64   40   0.000000   0.037879   0.000000   0.000000   0.000000   1.477273   1.515151   0.06967440  6197.1740  3.5090E-03
2006-251T05:06:03  2453986.7125382   64   39   0.000000   0.000000   0.000000   0.000000   0.000000   1.426481   1.426481   0.06967440  6197.1740  3.3037E-03
2006-251T05:07:07  2453986.7132789   64   45   0.000000   0.046083   0.000000   0.000000   0.000000   2.027650   2.073733   0.06967440  6199.5570  4.8009E-03
2006-251T05:08:11  2453986.7140197   64   41   0.000000   0.000000   0.000000   0.039277   0.000000   1.571092   1.610369   0.06967440  6199.5570  3.7281E-03
2006-251T05:09:15  2453986.7147604   64   43   0.000000   0.042409   0.000000   0.000000   0.000000   1.781170   1.823579   0.06967440  6201.9426  4.2201E-03
2006-251T05:10:19  2453986.7155011   64   41   0.000000   0.000000   0.000000   0.000000   0.000000   1.610369   1.610369   0.06967440  6201.9426  3.7267E-03
2006-251T05:11:23  2453986.7162419   64   43   0.000000   0.000000   0.000000   0.000000   0.000000   1.823579   1.823579   0.06967440  6204.3307  4.2185E-03
2006-251T05:12:27  2453986.7169826   64   40   0.000000   0.000000   0.000000   0.037879   0.000000   1.477273   1.515151   0.06967440  6204.3307  3.5050E-03
2006-251T05:13:31  2453986.7177234   64   42   0.000000   0.000000   0.000000   0.000000   0.000000   1.712887   1.712887   0.06967440  6206.7213  3.9609E-03
2006-251T05:14:35  2453986.7184641   64   37   0.000000   0.000000   0.000000   0.000000   0.000000   1.266256   1.266256   0.06967440  6209.1144  2.9270E-03
2006-251T05:15:39  2453986.7192048   64   45   0.000000   0.000000   0.000000   0.000000   0.000000   2.073733   2.073733   0.06967440  6209.1144  4.7935E-03
2006-251T05:16:43  2453986.7199456   64   45   0.000000   0.000000   0.000000   0.000000   0.000000   2.073733   2.073733   0.06967440  6211.5101  4.7916E-03
2006-251T05:17:47  2453986.7206863   64   40   0.000000   0.000000   0.000000   0.000000   0.000000   1.515151   1.515151   0.06967440  6211.5101  3.5009E-03
2006-251T05:18:51  2453986.7214270   64   37   0.000000   0.000000   0.000000   0.000000   0.000000   1.266256   1.266256   0.07187760  6213.9083  2.8351E-03
2006-251T05:19:55  2453986.7221678   64   44   0.000000   0.000000   0.000000   0.000000   0.000000   1.943463   1.943463   0.07187760  6213.9083  4.3513E-03
2006-251T05:20:59  2453986.7229085   64   40   0.000000   0.000000   0.000000   0.000000   0.000000   1.515151   1.515151   0.07187760  6216.3074  3.3910E-03
2006-251T05:22:03  2453986.7236492   64   43   0.000000   0.000000   0.000000   0.000000   0.000000   1.823579   1.823579   0.07187760  6216.3074  4.0813E-03
2006-251T05:23:07  2453986.7243900   64   36   0.000000   0.000000   0.000000   0.000000   0.000000   1.193634   1.193634   0.07187760  6218.7107  2.6704E-03
2006-251T05:24:11  2453986.7251307   64   40   0.000000   0.037879   0.000000   0.000000   0.000000   1.477273   1.515151   0.07187760  6218.7107  3.3897E-03
2006-251T05:25:15  2453986.7258715   64   40   0.000000   0.000000   0.000000   0.000000   0.000000   1.515151   1.515151   0.07187760  6221.1167  3.3884E-03
2006-251T05:26:19  2453986.7266122   64   39   0.000000   0.000000   0.000000   0.000000   0.000000   1.426481   1.426481   0.07187760  6221.1167  3.1901E-03
2006-251T05:27:23  2453986.7273529   64   41   0.000000   0.039277   0.000000   0.000000   0.000000   1.571092   1.610369   0.07187760  6223.5251  3.5999E-03
2006-251T05:28:27  2453986.7280937   64   42   0.000000   0.000000   0.000000   0.000000   0.000000   1.712887   1.712887   0.07187760  6223.5251  3.8291E-03
2006-251T05:29:31  2453986.7288344   64   44   0.000000   0.000000   0.000000   0.000000   0.000000   1.943463   1.943463   0.07187760  6225.9361  4.3429E-03
2006-251T05:30:35  2453986.7295751   64   40   0.000000   0.000000   0.000000   0.000000   0.000000   1.515151   1.515151   0.07187760  6228.3496  3.3845E-03
2006-251T05:31:39  2453986.7303159   64   42   0.000000   0.000000   0.000000   0.000000   0.000000   1.712887   1.712887   0.07187760  6228.3496  3.8262E-03
2006-251T05:32:43  2453986.7310566   64   37   0.000000   0.000000   0.000000   0.000000   0.000000   1.266256   1.266256   0.07187760  6230.7657  2.8274E-03
2006-251T05:33:47  2453986.7317973   64   39   0.000000   0.000000   0.000000   0.000000   0.000000   1.426481   1.426481   0.07187760  6230.7657  3.1852E-03
2006-251T05:34:51  2453986.7325381   64   33   0.000000   0.000000   0.000000   0.000000   0.000000   1.000606   1.000606   0.07187760  6233.1843  2.2334E-03
2006-251T05:35:55  2453986.7332788   64   35   0.000000   0.032154   0.000000   0.000000   0.000000   1.093248   1.125402   0.07187760  6233.1843  2.5119E-03
2006-251T05:36:59  2453986.7340195   64   36   0.000000   0.000000   0.000000   0.000000   0.000000   1.193634   1.193634   0.07187760  6235.6055  2.6632E-03
2006-251T05:38:03  2453986.7347603   64   36   0.000000   0.000000   0.000000   0.000000   0.000000   1.193634   1.193634   0.07187760  6235.6055  2.6632E-03
2006-251T05:39:07  2453986.7355010   64   39   0.000000   0.000000   0.000000   0.000000   0.000000   1.426481   1.426481   0.07187760  6238.0276  3.1815E-03
2006-251T05:40:11  2453986.7362418   64   37   0.000000   0.000000   0.000000   0.000000   0.000000   1.266256   1.266256   0.07187760  6238.0276  2.8241E-03
2006-251T05:41:15  2453986.7369825   64   38   0.000000   0.000000   0.000000   0.000000   0.000000   1.343706   1.343706   0.07187760  6240.4538  2.9957E-03
4 Data Example at a Titan Flyby
A sample of the data is shown in Figure 4. Cassini flew on its orbit no. 28 with an inclination of 15∘ to the ring plane. It came from the apokronium (DOY 240.80) aiming to the inner regions of the Saturnian system. From the middle panel it is visible that the aperture axis of the CDA was not pointing to the dust ram till DOY 250.83. Nevertheless, the instrument registered a few particles entering from any other direction, such that the impact rate (upper panel) dithered at low values s-1. From 250.83 to 250.88 the justification of the sensitive area changed according to the dust ram: The whole probe was turned or the articulation was modified, either of which will leave the same effect on the impact rate: it rose for a couple of minutes and vanished as sudden as it appeared.
On DOY 250.84, Cassini experienced a targeted flyby at Titan (T17) with a distance of 1000 km above its surface; this flyby event perishes inside that first narrow peak. Thereafter the sensitive area, , became better exhibited to the dust ram, and the dust rate rose by 4 orders of magnitude.
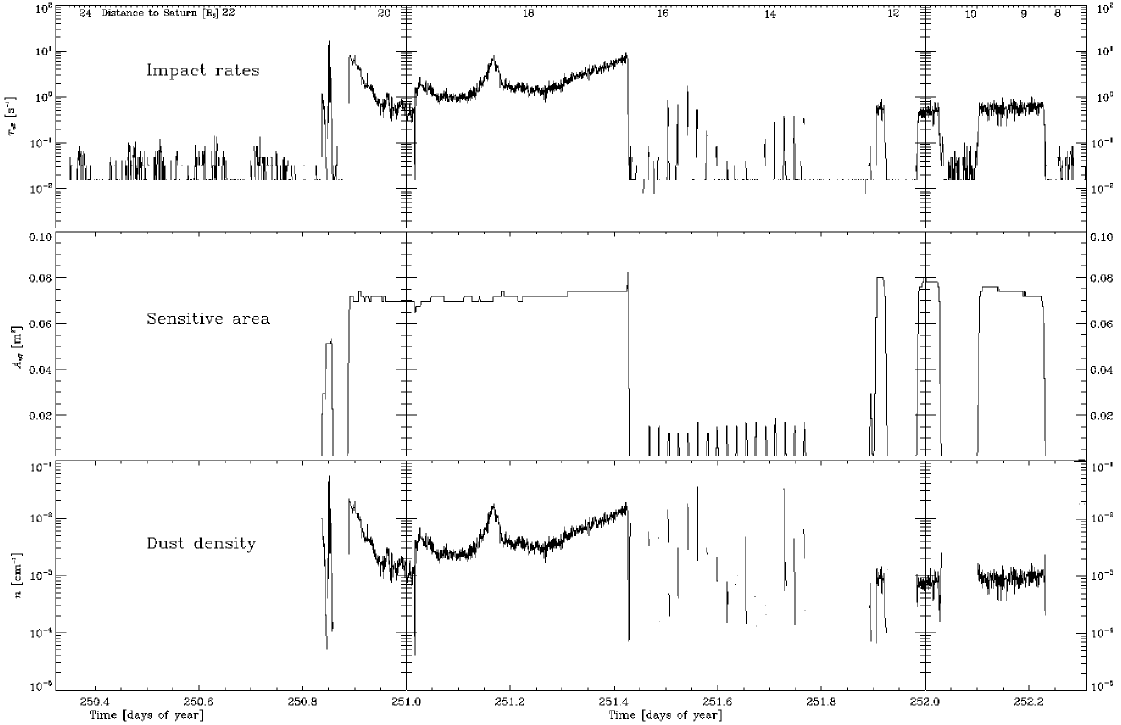
At DOY 250.89 the spacecraft crossed the ring plane from North to South. During such ring plane crossings the impact rate naturally swells to a high level. On its eccentric trajectory, Cassini headed for Saturn: It was to reach its perikronium at 3 RS on DOY 252.74 (not shown here).
Beyond DOY 251.42, the spacecraft began slowly rotating along its -axis, so, the boresight of the CDA became alternately exposed and hidden to the direction of the stream of particles. That created the periodical peaks in the impact rate in the upper panel (finishing at DOY 251.75). The density (lower panel) reflects the interplay of the oscillating impact rates and the lack of data due to .
Two conspicuous enhancements of the particle density are evident at DOYs 251.03 and 251.15, both of which happened at distances between 19.7 and 18.7 RS, respectively. This is a quite empty region, for the orbit of inner next moon Rhea ( RS) was still not reached till the end of the day (the moon itself was standing elsewhere on its orbit). More detailed analysis showed that most of these hits are “N2 counts” (see Table 1). A third, very broad enhancement can also be presumed from the bottom panel. It could have occurred at some time between DOY 251.50 and 251.70, after the beginning of the rotation of the spacecraft.
5 Coherent dust clouds in the E-ring
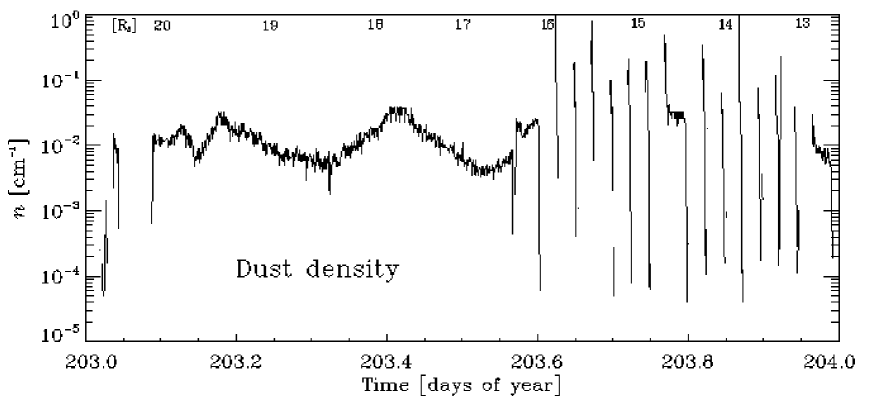
The two or three enhancements of particles in Figure 4 could perhaps be attributed to “dust clouds” or any other compressions of dust that might move in space. In the region of their occurrence, the orbit of any known moon is much too far for serving as an immediate source. It is instructive to see that Cassini might have flown through these “clouds” on its orbit no. 26. From Figure 5 it is visible that the same three enhancements (203.18, 203.40, and 203.8) were registered by the CDA. They were positioned about 1 closer to Saturn. By simple velocity computation we derive an outward drift of about 14 m/s. The second enhancement peak appears “widened” which might also be just an geometric effect of a slightly different trajectory.
During the subsequent orbits no. 27 and no. 29 the boresight of the CDA was unfavorable positioned, unfortunately, such that no measurements are available. The velocity of the cloud particles is far too low for stream particles that would originate from the planet itself (Hsu, Postberg, Kempf et al., 2011). However, our results will rather suit some less conspicuous flows released at much earlier times and now slowly floating through space. The only known source of submicron material in the E-ring is Enceladus at the radial distance of about 4 .
It might be speculative whether the clouds really originate from that moon and move outwards now. An implication of such an assumption will be that its geysers are subject to different phases of activity. Such temporary volcanos are only known from Jupiter’s moon Io, so far. The possible particle clouds from Enceladus would have to remain coherent for a long time, in this case at hand as long as two years.
Alternative explanations are even more speculative in our opinion, e.g.: origins from dusty rings like Janus-, Pallene-, G-ring, or even the F-ring that is heavily disturbed by its shepherd moons. Also, an origin from a dissolved comet is as unlikely as raised ejecta from an impact on an inner moon. To confirm the existence of such dusty clouds we look forward to finding further evidence for similar density enhancements at different locations.
Acknowledgments
E.K. wishes to thank the Klaus Tschira Foundation, Heidelberg, for the kindful support at grant no. 00.161.2010. We also thank Sascha Kempf for using his Browser software which enables to run this analysis, as well as the referees for their invaluable comments for improvement.
References
- Hsu, Postberg, Kempf et al. (2011) Hsu H-W, Postberg F, Kempf S, Trieloff M, Burton M, Roy M, Moragas-Klostermeyer G, Srama R: “Stream particles as the probe of the dust-plasma-magnetosphere interaction at Saturn”, Journal of Geophysical Research: Space Physics 116, Issue A9, CiteID A09215.
- Kempf (2008) Kempf S: “Interpretation of high rate dust measurements with the Cassini dust detector CDA”, Planetary and Space Science 56, p378–385, 2008.
-
Kempf (2012)
Kempf S: “The Cosmic Dust Analyser Data Handbook”
(cdaDataHB.pdf), 2012,
available in an electronic version at http://atmos.nmsu.edu/
data-and-services/atmospheres-data/Cassini/cda.html. -
Khalisi & Srama (2012)
Khalisi E, Srama R:
“Dust Counters onboard the Cassini spacecraft”,
European Planetary Science Congress, 2012,
http://adsabs.harvard.edu/abs/2012espc.conf..182K, EPSC2012-182. - Srama (2000) Srama R: “Vom Cosmic-Dust-Analyser zur Modellbeschreibung wissenschaftlicher Raumsonden”, PhD thesis, Technische Universität München, 2000.
- Srama, Ahrens, Altobelli et al. (2004) Srama R, Ahrens T, Altobelli N, + 41 co-authors: ”The Cassini Cosmic Dust Analyser”, Space Sci. Rev. 114, p465–518, 2004.
- Srama, Kempf, Moragas-Klostermeyer et al. (2006) Srama R, Kempf S, Moragas-Klostermeyer G, + 38 co-authors: “In situ dust measurements in the inner Saturnian system”, Planetary and Space Science 54, p967–987, 2006.
- Srama (2009) Srama R: “Cassini-Huygens and Beyond — Tools for Dust Astronomy”, Habilitation treatise at the University of Stuttgart, 2009.