Towards Non-spherical Radio Models
Abstract
Radio observations of novae in outburst are of particular interest due to the physical parameters that may be retrieved from fitting the radio light curves. Most models that have fitted previous data assumed spherical symmetry however, it is becoming more and more clear that this is not the case. We explore morpho-kinematical techniques to retrieve the free-free radio light curves of non-spherical models and explore the effects of a non-spherical outburst on the physical parameters. In particular, we find that we may have been over estimating the ejected masses in the outburst of non-spherical novae.
1 Introduction
Nova ejecta have been resolved in the optical with a myriad of structures (Hutchings 1972; Solf 1983; Slavin, O’Brien, & Dunlop 1995; Gill & O’Brien 2000; Harman & O’Brien 2003; Gill & O’Brien 1998; Woudt et al. 2009; Ribeiro 2014). For a few decades we have known that the outbursts are far from spherical. However, in the radio mostly spherically symmetric models of the outburst have been applied to observations. Most novae observed in the radio have been modelled as expanding, thermally emitting shells of ejecta, although some show evidence of non-thermal emission (Seaquist & Bode 2008). The radio outburst is of particular interest due to the fact that we can derive properties of the ejecta since it is optically thick at much lower densities than other wavelengths and it does not suffer extinction. This provides us with a measure of the total ejected mass, density profiles, and kinetic energy (Hjellming 1996). Initial attempts to interpret the different observed structures was performed by Hjellming (1996) on V1974 Cygni (1992). These were aided with resolved radio images of the nova both during the optically thick and thin stages, which placed constraints on the kinematic behavior of the shells.
2 Physics in shape111Available from http://bufadora.astrosen.unam.mx/shape/index.html
In shape (Steffen et al. 2011) we construct an object interactively in a 3D interface. The structure is then transferred to a 3D grid on which radiation transfer is computed via ray tracing to the observer. Radiation transfer is based on emission and absorption coefficients which are provided as a function of physical parameters such as density, temperature and wavelength. As the rays emerge from the grid, images and spectra are generated. Temporal evolution is simulated when a model of the structure’s expansion is provided. The time sequence of output is then generated automatically.
We input in the physics module the free-free emission () and absorption coefficients () at a given frequency (), which are simplified to (Kwok 2007):
We take = , the electron and ion densities, is the charge of the ion ( = 1 for a singly ionised atom) and is the Gaunt factor:
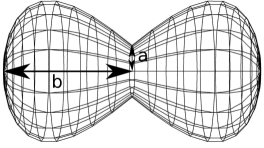
We then modify the object to be bipolar with a ratio of the major to minor axis of four (Figure 1). We explore different inclination angles, 0 degrees (the orbital plane is seen face on) and 90 degrees (the orbital plane is edge on). We assume a homologous expansion with a maximum velocity, , of 414 km s-1 electron temperature, , of 17000 K, ejected mass, , of 110-4 M and a 1/ density distribution, on a spherical symmetric shell where the thickness was determined so that the inner radius was 0.25 times that of the outer radius. This is the same set up as Heywood & O’Brien (2007) on their models to replicate the 6-cm MERLIN observations of nova V723 Cas.
3 Results
At first glance, Figure 2 (top) show our spherical model result with remarcable agreement with the model of Heywood & O’Brien (2007); both in terms of the peak flux and turn over time. The slight disagreement exists due to how the mass is being estimated using shape. Furthermore, we changed the central wavelength, to 21-cm (lower frequency) and as expected we have less flux and the lightcurve peaks later (solid black line).
In the bottom panel of Figure 2, we show the spherical model (dashed line) comparing with a bipolar at 90 degrees (solid black) and 0 degrees (solid gray). During the initial optically thick rise phase, the models have the same steep rise, (where 2), while the decline is much shallower for the bipolar models. The bipolar lightcurves also peak much later compared with the spherical model, while the bipolar at 0 degrees peaks even later at lower flux.


4 Discussion
The optically thick rise phase proceeds similarly in both the spherical and bipolar models. During the optically thin phase, in the spherical model, the ejecta becomes optically thin all throughout the sphere at the same time, yielding a steep decline; meanwhile in the bipolar case, material closer to the center of the explosion is much denser, and becomes optically thin later than the outer lobes. Furthermore, keeping all initial parameters the same, we find that the bipolar radio peak is much later than in the spherical case. These preliminary results demonstrates that we may have been over estimating the ejected masses in a few novae. Furthermore, we are at a time where optical emission line modelling, soon after outburst, are placing major constraints on the kinematic bahaviour of the shell (e.g., Hjellming 1996; Ribeiro et al. 2013), which can then be used as input for these radio models (see Ribeiro et al. 2014, for further details).
Acknowledgments
VARMR acknowledges the South African SKA Project for funding the postdoctoral fellowship at the University of Cape Town.
References
- Gill & O’Brien (1998) Gill, C. D., & O’Brien, T. J. 1998, MNRAS, 300, 221
- Gill & O’Brien (2000) — 2000, MNRAS, 314, 175
- Harman & O’Brien (2003) Harman, D. J., & O’Brien, T. J. 2003, MNRAS, 344, 1219
- Heywood & O’Brien (2007) Heywood, I., & O’Brien, T. J. 2007, MNRAS, 379, 1453
- Hjellming (1996) Hjellming, R. M. 1996, in Radio Emission from the Stars and the Sun, edited by A. R. Taylor and J. M. Paredes (San Francisco: ASP), vol. 93 of the ASP Conf. Ser., 174
- Hutchings (1972) Hutchings, J. B. 1972, MNRAS, 158, 177
- Kwok (2007) Kwok, S. 2007, Physics and Chemistry of the Interstellar Medium by Sun Kwok. University Science Books, (Sausalito, CA: University Science Books)
- Ribeiro (2014) Ribeiro, V. A. R. M. 2014, in Stella Novae: Past and Future Decades, edited by P. A. Woudt & V. A. R. M. Ribeiro, San Francisco: Astron. Soc. Pac.), vol. 490 of the ASP Conf. Series, these proceedings
- Ribeiro et al. (2014) Ribeiro, V. A. R. M., Chomiuk, L., Munari, U., et al. 2014, ApJ, 792, 57
- Ribeiro et al. (2013) Ribeiro, V. A. R. M., Munari, U., & Valisa, P. 2013, ApJ, 768, 49
- Seaquist & Bode (2008) Seaquist, E. R., & Bode, M. F. 2008, in Classical Novae, edited by M. F. Bode, & A. Evans (2nd ed. Cambridge: Cambridge Univ. Press), 141
- Slavin et al. (1995) Slavin, A. J., O’Brien, T. J., & Dunlop, J. S. 1995, MNRAS, 276, 353
- Solf (1983) Solf, J. 1983, ApJ, 273, 647
- Steffen et al. (2011) Steffen, W., Koning, N., Wenger, S., et al. 2011, IEEE Transactions on Visualization and Computer Graphics, 17, 454, arXiv:1003.2012
- Woudt et al. (2009) Woudt, P. A., Steeghs, D., Karovska, M., et al. 2009, ApJ, 706, 738