Distinguishing f(R) gravity with cosmic voids
Abstract
We use properties of void populations identified in -body simulations to forecast the ability of upcoming galaxy surveys to differentiate models of f(R) gravity from CDM cosmology. We analyze simulations designed to mimic the densities, volumes, and clustering statistics of upcoming surveys, using the public VIDE toolkit. We examine void abundances as a basic probe at redshifts 1.0 and 0.4. We find that stronger f(R) coupling strengths produce voids up to larger in radius, leading to a significant shift in the void number function. As an initial estimate of the constraining power of voids, we use this change in the number function to forecast a constraint on the coupling strength of .
keywords:
cosmology: simulations, cosmology: large-scale structure of universe1 Introduction
Modifications of gravity provide one way to explain the observed expansion of the universe. One such proposed theory is the f(R) class of models, which contain relatively simple modifications to General Relativity (GR). This particular model incorporates the chameleon mechanism (Khoury & Weltman, 2004) that screens the fifth force in high density regions while leaving it unscreened in low density regions, strengthening the force of gravity.
Studying these underdense regions, called voids, could provide a way to test f(R) gravity. Already voids have been used as a potential diagnostic for examining other models, such as coupled dark energy (Sutter et al., 2014). So far, current void-based studies of modified gravity (e.g., Li et al., 2012) have only focused on predictions for present-day conditions and ignored realistic survey effects. In this work, we mimic upcoming galaxy redshift surveys such as Euclid (Laureijs et al., 2011) and provide an initial estimate of the constraining power of void statistics.
2 Analysis and Results
We analyzed six simulation realizations from Zhao et al. (2011). Three models with differing values for structure formation in the universe, expressed by with values (F4), (F5), and (F6), were examined in addition to general relativity (GR). Each simulation box contained dark matter particles and had a cubic volume of 1.5 Gpc per side. For analysis we selected snapshots at redshifts and and subsampled the DM particles to a mean density of per cubic Mpc. This choice of redshift, density, and volume is designed to represent a typical space-based galaxy survey such as Euclid. Finally, we perturbed particle positions according to their peculiar velocities. We chose to ignore the effects of galaxy bias, as Sutter et al. (2013) demonstrated that watershed void properties are relatively insensitive to bias.
Voids were identified using the publicly available Void Identification and Examination (VIDE) toolkit (Sutter et al., 2014), which uses a substantially modified version of ZOBOV (Neyrinck, 2008). For this work, voids must be larger than the mean particle separation (in our case, Mpc) and have central densities higher than 0.2 of the mean particle density .
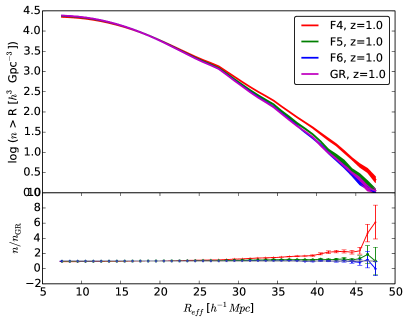
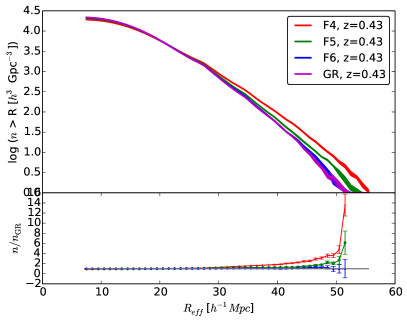
Figure 1 shows the cumulative number function from CDM and f(R) simulations at redshifts and . We can see that F4 clearly contains larger voids than in the CDM simulation at both redshifts. With weaker coupling strengths, one will notice that at high redshift, F5 and F6 are not able to separate from GR. At lower redshift, the F5 model becomes distinguishable at roughly the three sigma level from GR at radii as small as 35 Mpc. Even the F6 model around 45 Mpc separates from GR, albeit by a relatively small amount. The gain in large voids is balanced by a loss of small voids, implying that the fifth force is accelerating the dissipation of interior void walls.
3 Conclusions
These features align with what one would reasonably expect to see from the models. At higher redshift, the voids have not yet emptied out. Until the local densities pass a low enough threshold, the fifth force will remain screened, making the models appear identical to GR. Simultaneously, the modified gravity mechanism only affects particle acceleration, and so the differences grow larger with time. Thus the strongest force, F4, produces the greatest number of large voids.
An initial Fisher forecast places the constraint on measuring at roughly , indicating that for stronger fifth forces, a detection may well be possible, especially at lower redshift where there is more statistical power.
References
- Khoury & Weltman (2004) Khoury J., Weltman A., 2004, Phys. Rev. D, 69
- Laureijs et al. (2011) Laureijs R., Amiaux J., Arduini S., Auguères J. ., Brinchmann J., Cole R., Cropper M., Dabin C., Duvet L., Ealet A., et al., 2011, ArXiv:1110.3193
- Li et al. (2012) Li B., Zhao G.-B., Koyama K., 2012, Mon. Not. R. Astron. Soc., 421, 3481
- Neyrinck (2008) Neyrinck M. C., 2008, Mon. Not. R. Astron. Soc., 386, 2101
- Sutter et al. (2014) Sutter P. M., Carlesi E., Wandelt B. D., Knebe A., 2014, ArXiv e-prints
- Sutter et al. (2014) Sutter P. M., et al., 2014, ArXiv e-prints: 1406.1191
- Sutter et al. (2013) Sutter P. M., Lavaux G., Wandelt B. D. Hamaus N., Weinberg D. H., Warren M. S., 2013, ArXiv e-prints: 1309.5087
- Zhao et al. (2011) Zhao B., Li B., Koyama K., 2011, Phys. Rev. D, 83