EXO-200 Collaboration
Search for Majoron-emitting modes of double-beta decay of 136Xe with EXO-200
Abstract
EXO-200 is a single phase liquid xenon detector designed to search for neutrinoless double-beta decay of 136Xe. Here we report on a search for various Majoron-emitting modes based on 100 kgyr exposure of 136Xe. A lower limit of 1.21024 yr at 90% C.L. on the half-life of the spectral index = 1 Majoron decay was obtained, corresponding to a constraint on the Majoron-neutrino coupling constant of (0.8-1.7)10-5.
pacs:
23.40.-s, 21.10.Tg, 14.60.Pq, 14.80.VaI Introduction
Double-beta decay () is a rare radioactive transition between two nuclei with the same mass number A and with the nuclear charges Z different by two units. The process can only proceed when the initial even-even nucleus is less bound than the final one, and can only be observed when both are more bound than the intermediate odd-odd nucleus (or the decay to the intermediate nucleus is highly suppressed, as in 48Ca). Thus, in decay, two neutrons are transformed into two protons and two electrons simultaneously, with or without the emission of additional neutral particles.
Several modes of the decay are considered in the literature. The mode where two antineutrinos are emitted together with the electrons (the two neutrino decay ) is an allowed decay in the Standard Model that conserves total lepton number. This mode has been observed in several cases, in particular recently in 136Xe Ackerman et al. (2011); Gando et al. (2012a) with a half-life of yr Albert et al. (2014a). In contrast, there are alternative, so-far-unobserved, neutrinoless modes where the total lepton number is not conserved and whose existence requires that neutrinos are massive Majorana particles Schechter and Valle (1982). The simplest of such modes, the decay with the emission of two electrons, and nothing else, is a subject of an intense experimental search. In particular, for 136Xe half-life limits have most recently been set to yr Albert et al. (2014b) and yr Gando et al. (2013).
In this work we derive half-life limits for the neutrinoless modes of 136Xe in which one or two additional bosons, denoted as here, are emitted together with the electrons, schematically
| (1) |
or
| (2) |
The boson(s) emitted in the or modes is (are) usually referred to as “Majoron(s)”. Originally described as a Goldstone boson associated with spontaneous lepton number symmetry breaking, Majorons are possible dark matter candidates Lattanzi et al. (2013) and may be involved in other cosmological and astrophysical processes (e.g. Dolgov and Takahashi (2004); Das and Pulido (2011)). Although the original proposals by Gelmini and Roncadelli Gelmini and Roncandelli (1981) and Georgi et al. Georgi et al. (1981) are disfavored by precise measurement of the width of the Z boson decay to invisible channels The ALEPH Collaboration, The DELPHI Collaboration, The L3 Collaboration, The OPAL Collaboration, The SLD Collaboration, The LEP Electroweak Working Group, The SLD Electroweak and Heavy Flavour Groups (2006), other analogous models were proposed, free of this constraint, in which Majoron more generally refers to massless or light bosons that might be neither Goldstone bosons, nor required to carry a lepton charge (see Barabash (2004) and references therein).
The Majoron-emitting modes are experimentally recognizable by the shape of the sum electron spectrum , characterized by the spectral index ,
| (3) |
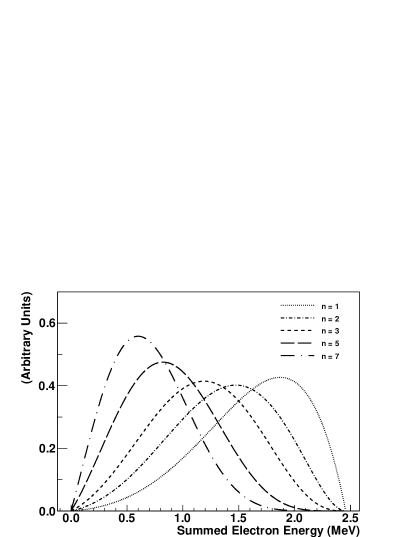
where , , , and are the energy and momentum for each of the two electrons and is the observable sum energy, is the total available energy, i.e. the decay Q value plus two electron masses, and the spectral index is an integer = 1, 2, 3, or 7. is the Fermi function that represents the effect of the nuclear (and atomic) Coulomb field on the wave function of the outgoing electron. All energies are in units of the electron mass and thus the function is dimensionless. Note that =5 for the observed decay. The normalized spectra for 136Xe and various spectral indices are illustrated in Figure 1.
It is beyond the scope of this paper to discuss the characteristic features of the different Majoron models that are discussed in Bamert et al. (1995); Hirsh et al. (1996). Generally, the half-life, effective Majoron-neutrino coupling constant , phase space integral, and the nuclear matrix elements are related by
| (4) |
where , is the axial coupling constant, for the emission of one (two) Majorons, and is the unnormalized phase space integral that depends on the model type, (see Table 1) and contains all the necessary fundamental constants. For completeness we show in Table 1 the most important characteristics of ten Majoron models considered in recent experimental decay searches Arnold et al. (2006); Gando et al. (2012b).
| Model type, | Number of Majorons emitted in decay, | Is the Majoron a Goldstone boson? | Lepton charge, | Spectral index, |
|---|---|---|---|---|
| IB | 1 | no | 0 | 1 |
| IC | 1 | yes | 0 | 1 |
| ID | 2 | no | 0 | 3 |
| IE | 2 | yes | 0 | 3 |
| IIB | 1 | no | -2 | 1 |
| IIC | 1 | yes | -2 | 3 |
| IID | 2 | no | -1 | 3 |
| IIE | 2 | no | -1 | 7 |
| IIF | 1 | no | -2 | 3 |
| “bulk” | 1 | no | 0 | 2 |
Table 2 shows the phase space integrals for different values of the spectral index for 136Xe. For numerical calculations it is important to employ accurate values of the Fermi function . The used in preparing this table was calculated by a code Vogel that fully includes the nuclear finite size and electron screening and, as recently recommended Kotila and Iachello (2012), evaluates F(Z,E) at the nuclear radius .
| Decay mode | n=1 | n=3 | n=3 | n=5 | n=7 |
|---|---|---|---|---|---|
| Const. | |||||
| 1.1110-15 | 4.0210-18 | 8.3210-18 | 3.8610-18 | 3.4410-17 |
II Detector description
The EXO-200 detector is a cylindrical single phase time projection chamber (TPC) filled with liquid xenon enriched to 80.6% in 136Xe. A detailed description of the detector is available elsewhere Auger et al. (2012). The detector is constructed from components carefully selected to minimize internal radioactivity Leonard et al. (2008). External radioactivity is shielded by 25 cm thick lead walls surrounding the detector on all sides. Additional passive shielding is provided by 50 cm of high purity cryogenic fluid 3M HFE-7000, http://www.3m.com filling the copper cryostat with a wall thickness of 5.4 cm that houses the TPC. The detector is located inside a clean room at the Waste Isolation Pilot Plant (WIPP) in Carlsbad, NM, USA, under an overburden of 1585 meters water equivalent Esch et al. (2005). The remaining cosmic ray flux is detected by an active muon veto system consisting of plastic scintillation panels surrounding the clean room on four sides. Energy deposited in the TPC by ionizing radiation produces free charge and scintillation light, which are registered by anode wire grids and arrays of avalanche photodiodes, respectively. The TPC allows for three-dimensional position reconstruction of energy depositions, providing further discrimination against gamma backgrounds. Charge deposits (clusters) in a given event that are spatially separated by 1 cm or more can be individually resolved. The event can then be classified as single-site (SS), or multi-site (MS), depending on the number of observed charge clusters. Based on Monte Carlo (MC) simulation, >90% of events are expected to be reconstructed as SS, while the energy-averaged fraction of SS gamma events is around 30%. Total energy of an event is determined by combining the charge and scintillation signals, which achieves better energy resolution than in each individual channel due to the anticorrelation between them Conti et al. (2003). Radioactive gamma sources are periodically deployed at several positions near the TPC to characterize the detector response and validate the MC simulation.
III Experimental data and analysis
The data set and event selection criteria used in this work are the same as in the recent search for the neutrino mediated decay Albert et al. (2014b). The data were collected between September 22, 2011 and September 1, 2013 resulting in the total of 477.600.01 live days. The fiducial volume is described by a hexagon with an apothem of 162 mm and absolute length coordinate values between 10 and 182 mm (with Z = 0 corresponding to the cathode location). This translates into a 136Xe mass of 76.5 kg, or 3.391026 atoms of 136Xe, and an exposure of 100 kgyr (736 molyr).
The calibrated energy is obtained as , where is the measured energy and , and are empirical constants. The measured energy is assumed to follow a conditional Gaussian distribution, with the following energy-dependent resolution: , where is interpreted as the electronic noise contribution, represents statistical fluctuations in the ionization and scintillation, and is assumed to be a position- and time-dependent broadening. In this analysis, both the energy scale and resolution are determined by fitting the full shape of true energy spectra, as generated by MC, to the corresponding calibration data. This minimizes potential biases caused by determining peak positions and widths using simplified analytical fit models. It allows one to constrain the calibration parameters by utilizing all mono-energetic gamma lines simultaneously in the presence of complex backgrounds due to Compton scatters, summation peaks, and passive detector materials. Before the fit, the MC energy spectrum does not include effects of the energy smearing observed with the detector (Figure 2). In the fitting process, the simulated energy spectra from MC are folded with the measured detector response. The resolution and calibration parameters are fitted simultaneously using a maximum likelihood fit. Similar procedures were used in our previous analyses (Albert et al. (2014a, b)) to calculate only the resolution parameters. The available source calibration data allows the above fit to be performed on a weekly basis under the assumption of = 0 and = 0. However, comprehensive calibration data acquired less frequently, but with increased statistics, is used to provide a time-averaged quadratic correction to the weekly calibration parameters. This correction is measured at the sub-percent level. The correction, as well as the time-averaged resolution parameters used in this analysis, is determined by maximizing a likelihood function that takes into account the livetime of physics runs.
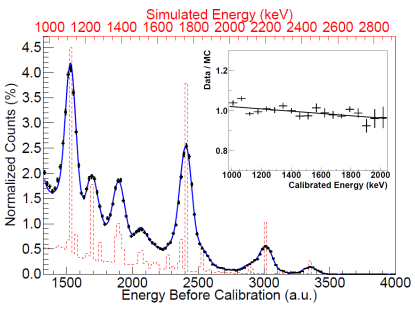
Probability density functions (PDFs) for signal and background components are created using a Monte Carlo simulation. Compared to the previous analyses, the MC was improved by substituting simplified modeling of the noise in the signal waveforms with real noise traces sampled from the data and by adjusting the amplitude of simulated signals to better match the data. This resulted in improved agreement between data and MC of the energy threshold for full position reconstruction and improved agreement in average SS fraction. A 5% discrepancy in the shapes of the energy distributions, however, remained. This discrepancy, which is included as a systematic error, manifests itself as an excess of SS events in the data over MC at energies around 1 MeV that gradually and linearly decreases with energy, eventually turning into a deficit (Figure 2). The PDFs are functions of the two observables: energy and standoff distance (SD). SD is defined as the distance between a charge deposit and the closest material that is not liquid xenon, other than the cathode, emphasizing separation between events originating outside and inside of the chamber. For a multi-site event, the smallest standoff distance among multiple charge clusters is used to define SD for the event. Components comprising the overall PDF model are the same as in Albert et al. (2014b) with the neutrino-mediated signal replaced by a Majoron-emitting decay. The parameters of the overall model are the event counts and SS fractions of individual components, and three variables representing normalization terms. The first normalization term is common to all components and is subject to uncertainty due to event reconstruction and selection efficiencies. The second normalization term is specific to the Majoron-emitting decay component and incorporates uncertainty due to discrepancy in shapes of Monte Carlo and data distributions. The third normalization term incorporates uncertainty due to background model incompleteness and applies to background components in the fit. The normalization terms are included in the PDF in a way analogous to the one described in Albert et al. (2014a).
An important parameter of the PDFs for -like components (e.g. ) is the “-scale”, which describes possible difference in energy scales of -like and -like (e.g. external backgrounds) events. The -scale variable is defined as an energy independent ratio of over energy scales. The -scale is of particular importance for this analysis because adding a -like component with continuous energy spectrum, such as , introduces correlation with the component and reduces the accuracy with which both the -scale and the Majoron components can be determined. While the central values of the -scale found for each mode, as well as for the case of no Majoron mode, are consistent with 1, the corresponding uncertainty increases the final error on each Majoron-emitting decay rate.
A negative log-likelihood function is formed between the data and the overall PDF with the addition of several Gaussian constraints Albert et al. (2014a) that incorporate systematic uncertainties determined by stand-alone studies. The following parameters are constrained by their corresponding errors, indicated in parentheses: SS fractions (4%), activity of radon in the liquid xenon (10%), common normalization term (8.6%), Majoron-specific normalization term (16% for spectral index n=1, 30% for other Majoron modes), background normalization term (20%) and relative fractions of neutron-capture related PDF components (20%). The methodology for determining the systematic errors follows the one described in Albert et al. (2014b). The fit is performed simultaneously for SS and MS events.
IV Results and conclusion
A profile likelihood scan is performed for each Majoron-emitting decay mode separately. The results are consistent with zero amplitude at less than 1 sigma for Majoron emitting modes with spectral indices 1, 2 and 3, and at 2.2 sigma for n=7, as determined with a toy MC study. As a consistency check, we compare the half-life of the decay extracted from the fits with additional Majoron components (added one at a time) to the result published previously Albert et al. (2014a). The half-life values are consistent within 2-3% for the Majoron-emitting decay modes with spectral indices 1,2 and 3, and within 12% for spectral index 7. Given that the uncertainty on the half-life in this measurement reaches 8% due to larger fiducial volume and additional correlation with the component, we consider these results to be in good agreement. The robustness of the Majoron fits was also checked against the existence of hypothetical backgrounds not included in the background model, in particular 110mAg and 88Y, which have gamma lines with energies close to the maxima of some of the Majoron modes. Additional fits were performed for each Majoron mode with each background included in the overall model (one at a time). The contribution of these components was found to be effectively constrained by the multi-site energy distribution, resulting in much less than 1 sigma impact on the Majoron fits. Figure 3 shows the dataset and the best-fit model for the case of the n=1 Majoron fit. The upper 90% C.L. limits on the number of decays for each of the four Majoron emitting modes are plotted on the figure all at once, as an illustration.
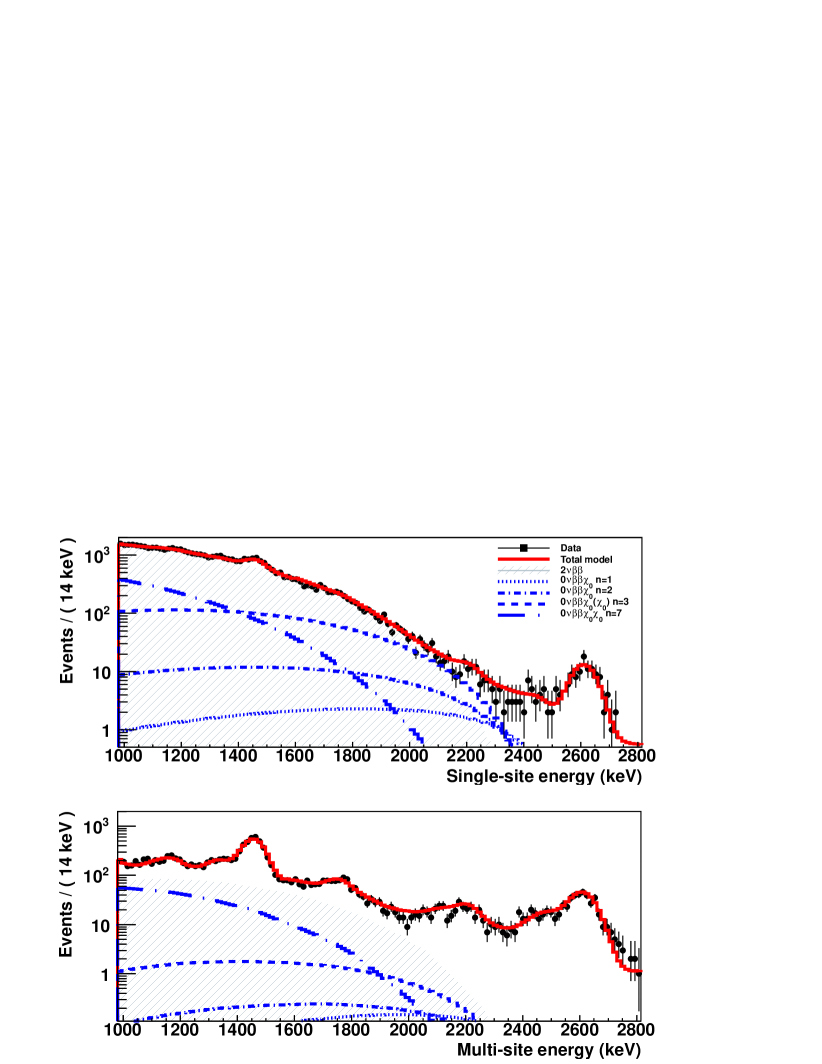
Table 3 summarizes the experimental 90% C.L. lower limits on half-lives and upper limits on the effective Majoron-neutrino coupling constants. Equation 4 is used to translate the half-lives into coupling constants, where the phase space factors are taken from Table 2, while the matrix elements are taken from Menéndez et al. (2009); Šimkovic et al. (2009) for the Majoron-emitting decay with n=1, and from Hirsh et al. (1996) for other modes. Note that the phase space factor for the n=1 Majoron is a factor of two larger in Hirsh et al. (1996) than in Doi et al. (1985) and Suhonen and Civitarese (1998). The factor of two is the correct choice, as was acknowledged in Doi et al. (1988) and is included in Table 2 Vogel .
| Decay mode | Spectral index, n | Model types | T1/2, yr | |
|---|---|---|---|---|
| 1 | IB, IC, IIB | 1.21024 | (0.8-1.7)10-5 | |
| 2 | “Bulk” | 2.51023 | – | |
| 3 | ID, IE, IID | 2.71022 | (0.6-5.5) | |
| 3 | IIC, IIF | 2.71022 | 0.06 | |
| 7 | IIE | 6.11021 | (0.5-4.7) |
The spread in the limits on the coupling constants in Table 3 for given Majoron mode stems from ambiguity in the matrix elements. The best limits on the coupling constant for the n=1 Majoron from a laboratory experiment come from NEMO-3 () Arnold et al. (2014) and KamLAND-Zen () Gando et al. (2012b). Note that the phase-space integral for the n=1 Majoron used by KamLAND-Zen is about a factor of two smaller than the most up to date value that we used. Therefore, in spite of having a weaker limit on the half-life for the n=1 Majoron (T yr at 90% C.L.), we report a similar limit on the coupling constant ( ). We note that applying the same phase space factor to the KamLAND-Zen’s half-life limit would translate it into the limit on the coupling constant of .
In conclusion, we report results from a search for Majoron-emitting double-beta decay modes of 136Xe with two years of EXO-200 data. No statistically significant evidence for this process is found. We obtain limits on the effective coupling constants comparable to the current strongest results by KamLAND-Zen Gando et al. (2012b) and NEMO-3 Arnold et al. (2014). The sensitivity to this and other exotic searches with EXO-200 could be improved in the future with a more precise calibration of the possible difference in and energy scales and the reduction of systematic differences between the spectral shapes in data and MC.
Acknowledgements.
EXO-200 is supported by DOE and NSF in the United States, NSERC in Canada, SNF in Switzerland, NRF in Korea, RFBR-14-22-03028 in Russia and DFG Cluster of Excellence “Universe” in Germany. EXO-200 data analysis and simulation uses resources of the National Energy Research Scientific Computing Center (NERSC), which is supported by the Office of Science of the U.S. Department of Energy under Contract No. DE-AC02-05CH11231. The collaboration gratefully acknowledges the WIPP for their hospitality.References
- Ackerman et al. (2011) N. Ackerman et al. (EXO-200 Collaboration), Phys. Rev. Lett. 107, 212501 (2011).
- Gando et al. (2012a) A. Gando et al. (KamLAND-Zen Collaboration), Phys. Rev. C 85, 045504 (2012a).
- Albert et al. (2014a) J. B. Albert et al. (EXO Collaboration), Phys. Rev. C 89, 015502 (2014a).
- Schechter and Valle (1982) J. Schechter and J. W. F. Valle, Phys. Rev. D 25, 2951 (1982).
- Albert et al. (2014b) J. B. Albert et al. (EXO-200 Collaboration), Nature 510, 229 (2014b).
- Gando et al. (2013) A. Gando et al. (KamLAND-Zen Collaboration), Phys. Rev. Lett. 110, 062502 (2013).
- Lattanzi et al. (2013) M. Lattanzi, S. Riemer-Sørensen, M. Tórtola, and J. W. F. Valle, Phys. Rev. D 88, 063528 (2013).
- Dolgov and Takahashi (2004) A. Dolgov and F. Takahashi, Nucl. Phys. B 688, 189 (2004).
- Das and Pulido (2011) C. R. Das and J. Pulido, Phys. Rev. D 84, 105040 (2011).
- Gelmini and Roncandelli (1981) G. Gelmini and M. Roncandelli, Phys. Lett. B 99, 411 (1981).
- Georgi et al. (1981) H. Georgi et al., Nucl. Phys. B 193, 297 (1981).
- The ALEPH Collaboration, The DELPHI Collaboration, The L3 Collaboration, The OPAL Collaboration, The SLD Collaboration, The LEP Electroweak Working Group, The SLD Electroweak and Heavy Flavour Groups (2006) The ALEPH Collaboration, The DELPHI Collaboration, The L3 Collaboration, The OPAL Collaboration, The SLD Collaboration, The LEP Electroweak Working Group, The SLD Electroweak and Heavy Flavour Groups, Phys. Rep. 427, 257 (2006).
- Barabash (2004) A. Barabash, Phys. Atom. Nucl. 67, 438 (2004).
- Bamert et al. (1995) P. Bamert, C. Burgess, and R. Mohapatra, Nucl. Phys. B 449, 25 (1995).
- Hirsh et al. (1996) M. Hirsh, H. Klapdor-Kleingrothaus, S. Kovalenko, and H. Päs, Phys. Lett. B 372, 8 (1996).
- Arnold et al. (2006) R. Arnold et al. (NEMO-3 Collaboration), Nucl. Phys. A 765, 483 (2006).
- Gando et al. (2012b) A. Gando et al. (KamLAND-Zen Collaboration), Phys. Rev. C 86, 021601 (2012b).
- (18) C. Burgess and J. Cline, in Proceedings of the First International Conference on Nonaccelerator Physics, Bangalore, India, 1994, edited by R. Cowsik (Singapore: World Scientific, 1995) .
- Mohapatra et al. (2000) R. Mohapatra, A. Peŕez-Lorenzana, and C. D. S. Pires, Phys. Lett. B 491, 143 (2000).
- (20) P. Vogel, (private communication).
- Kotila and Iachello (2012) J. Kotila and F. Iachello, Phys. Rev. C 85, 034316 (2012).
- Auger et al. (2012) M. Auger et al., J. Instrum. 7, P05010 (2012).
- Leonard et al. (2008) D. Leonard, P. Grinberg, P. Weber, E. Baussan, Z. Djurcic, et al., Nucl. Instrum. Methods. A 591, 490 (2008).
- (24) 3M HFE-7000, http://www.3m.com, .
- Esch et al. (2005) E.-I. Esch, T. Bowles, A. Hime, A. Pichlmaier, R. Reifarth, et al., Nucl. Instrum. Methods. A 538, 516 (2005).
- Conti et al. (2003) E. Conti, R. DeVoe, G. Gratta, T. Koffas, S. Waldman, et al., Phys. Rev. B 68, 054201 (2003).
- Menéndez et al. (2009) J. Menéndez, A. Poves, E. Caurier, and F. Nowacki, Nucl. Phys. A 818, 139 (2009).
- Šimkovic et al. (2009) F. Šimkovic, A. Faessler, H. Müther, V. Rodin, and M. Stauf, Phys. Rev. C 79, 055501 (2009).
- Doi et al. (1985) M. Doi, T. Kotani, and E. Takasugi, Prog. Theor. Phys. Supplement 83, 1 (1985).
- Suhonen and Civitarese (1998) J. Suhonen and O. Civitarese, Phys. Rep. 300, 123 (1998).
- Doi et al. (1988) M. Doi, T. Kotani, and E. Takasugi, Phys. Rev. D 37, 2575 (1988).
- Arnold et al. (2014) R. Arnold et al. (NEMO-3 Collaboration), Phys. Rev. D 89, 111101 (2014).