Combining ferromagnetic resonator and digital image correlation to study the strain induced resonance tunability in magnetoelectric heterostructures
Abstract
This paper reports the development of a methodology combining microstrip ferromagnetic resonance (MS-FMR) and digital image correlation (DIC) in order to silmuteanously measure the voltage-induced strains and the magnetic resonance in artificial magnetoelectric heterostructures (“magnetic films/piezoelectric substrate” or “magnetic films/flexible substrate/piezoelectric actuator”). The overall principle of the technique and the related analytical modelling are described. It is powerful to estimate the magnetostriction coefficient of ferromagnetic thin films and can be used to determine the effective magnetoelectric coefficient of the whole heterostructures in addition to the piezoelectric coefficient related to the in-plane voltage-induced strains. This methodology can be applied to system for which the strains are well transmitted at the different interfaces.
I Introduction
During the last decade, many groups have concentrated their effort on the study of ferromagnetic resonance (FMR) tunability through electric field strain induced MagnetoElectric (ME) coupling Fetisov2006 ; Srinivasan2010 . Many ME systems based on ferromagnetic/ferroelectric heterostructures have been developed, encompassing voltage-tunable microwave signal processing devices Subramanyam2013 ; Liu2013 ; Zavislyak2013 , magnetoelectric random access memory devicesNan2012 ; Yang2014 ; Fusil2014 ; Jin2014 and strain-control GMR devices Rizwan2013 ; Liu2011 ; Lei2013 . For all these kinds of systems, the properties are controlled via the elastic voltage-induced strains transmitted from the ferroelectric medium to the ferromagnetic one. Hence, the knowledge of the elastic strains must be known in order to predict the changes of magnetic state induced by applying voltages. Concerning magnetic thin films deposited on substrates, there are two ways to control the magnetization by applying voltage-induced strains : i) deposition of the film on a piezoelectric substrate Filippov2008 ; Thiele2007 ; Park2010 and ii) deposition of the film on a “non-piezoelectric” substrate and subsequent cementation on a piezoelectric actuator Pettiford2008 ; Brandlmaier2008_PRB ; Brandlmaier2008_PRB_Bis . In the first one, the in-plane strain transmission is generally good, the main disadvantage being to transfer existing process to piezoelectric substrates (PZT, PZN-PT, PMN-PT, …) ; in the second one, the main problem is the possibly bad in-plane strain transmission when the substrate is rigid (Si, GaAs, MgO, …), the total transmission being attained only with compliant substrates (polymers) Zighem_JAP2013 . In the two cases of full transmission (“film/piezoelectric substrate”, “film/polymer substrate/piezoelectric actuator”), the knowledge of the in-plane strains in the piezoelectric substrate or actuator is sufficient to know the in-plane strains in the whole system. In order to measure simultaneously the in-plane strains and ferromagnetic resonance in such systems, we have developed a methodology combining in situ microstrip ferromagnetic resonance (MS-FMR) with the Digital Image Correlation (DIC) technique. In this paper, we will show the general principle of the technique including the analytical formalism, before describing the experimental details. Then we will show an example of study on a “Finemet® film/Kapton® substrate/piezoelectric actuator” system highlighting the potentialities of the method. Especially, we will show that this technique is very efficient to determine the magnetostriction coefficient at saturation of the film, in complement to recently developed techniques for thin films, such as magnetoelastic measurement setup with a MOKE magnetometer Will2012 , substrate deflection method under magnetic field Bruckner2001 , laser Doppler vibrometry Varghesea2014 , applied whole wafer curvature Hill2013 , strain modulated ferromagnetic resonance Nesteruk2014 , or vibrating sample magnetometer coupled with bendingBuford2014 .
II Principle
II.1 Methodology
The voltage strain-induced magnetoelectric coupling in artificial multiferroic systems, consisting on a magnetic film deposited onto a piezoelectric substrate, is based on a two step process: i) the application of an electric field inside the piezoelectric medium induces mechanical deformations to the magnetic film via piezoelectric effect and ii) magnetostriction of the magnetic film induces a magnetoelastic anisotropy which can be strain(or voltage)-tunned in amplitude and direction. In these conditions, a quantitative evaluation of this indirect magnetoelectric coupling requires both the determination of the strains induced by the piezoelectric medium to the ferromagnetic film and the induced magnetoelastic anisotropy. These parameters can be evaluated with our experimental setup. Indeed, with our setup, when applying a voltage to the piezoelectric medium, it is possible to simultaneously measure the induced mechanical deformation and the magnetoelastic anisotropy thanks to a combination of digital image correlation and broadband ferromagnetic resonance techniques. Indeed, the uniform precession mode resonance field is directly linked to the magnetoelastic anisotropy when the film is submitted to external stresses. In these conditions, it is not only possible to measure an effective magnetoeletric coupling which do not necessary require the strains evaluation inside the magnetic film but also the magnetostriction coefficients. The following paragraph presents a basic analytical modelling of the resonance field variation as function of external applied stresses.
II.2 Theoretical background
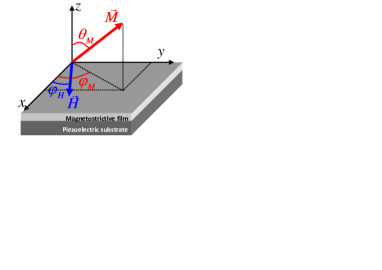
In this paragraph, the resonance field of the uniform precession mode of a magnetostrictive film submitted to in-plane external stresses is derived in the macrospin approximation (i. e. a uniform magnetization is considered). In our system, these in-plane stresses are applied by the piezoelectric medium to the ferromagnetic film (see figure 1). For simplicity, the magnetostrictive and elastic properties of this thin film are considered as isotropic (it will be the case in the studied system). With these assumptions (isotropic behavior and macrospin approximation), the magnetostriction coefficient, the Young’s modulus and the Poisson’s ratio of the thin film are scalars parameters. The magnetic energy of the thin film, using the coordinates system presented in Figure 1 can be written as:
| (1) |
Where the two first terms stand for the Zeeman and the dipolar contributions, respectively. The last term corresponds to the magnetoelastic anisotropy term and can be written as:
| (2) |
and being the in-plane principal stress tensor components while and stand for the polar and the azimuthal angles of the magnetization . Finally, is the isotropic magnetostriction coefficient at saturation of the thin film. The relation between the principal stress components (, ) and strains (, ) tensors is given by the isotropic Hook’s law where is the Young’s modulus and is the Poisson’s ratio:
| (3) | ||||
| (4) |
The resonance field of the uniform precession mode evaluated at the equilibrium is obtained from the following expression:
| (5) |
Where is the microwave driving frequency and is the gyromagnetic factor ( s-1.Oe-1). The different energy derivatives are evaluated for the equilibrium direction of the magnetization. For an in-plane applied magnetic field, the equilibrium polar angle is because of the large effective demagnetizing field associated with the planar film geometry and an explicit expression is obtained:
| (6) |
Here is the angle between the in-plane applied magnetic field and direction (see figure 1). The analysis can be simplified if the resonance field is larger than the magnetoelastic anisotropy field (). In this condition, the magnetization direction is almost aligned along the applied magnetic field (). The resonance field is thus given by:
| (7) |
The two first terms represents an almost constant shift in the resonance field baseline because and are found to be larger than the magnetoelastic and the magnetoelastic anisotropy field. The last term correspond to the angular variation of the resonance field due to the voltage induced magnetoelastic anisotropy field.
III Experimental Setup
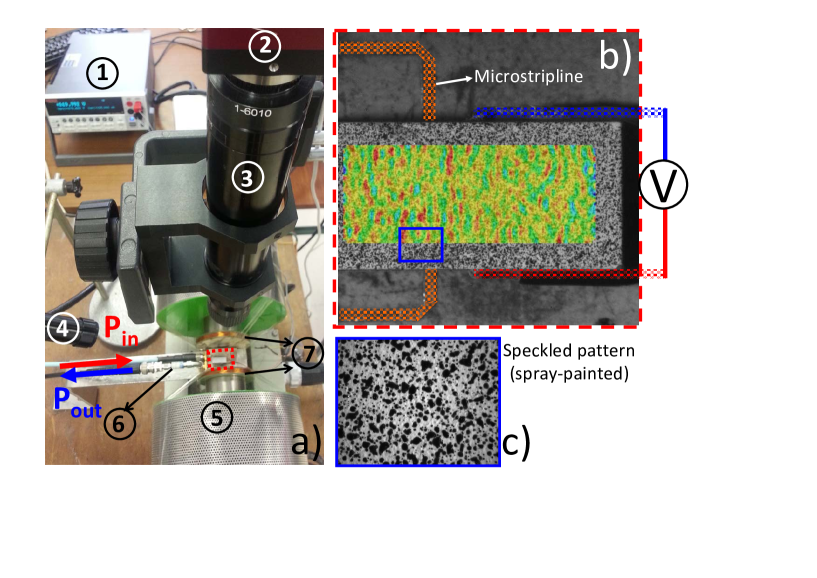
The experimental setup presented in figure 2 has been developed in order to in situ study the indirect magnetoelectric effect occurring in artificial magnetoelectric multiferroics heterostructures such as the ones presented in introduction. Our setup combines microstrip ferromagnetic resonance (MS-FMR) and digital image correlation (DIC) techniques. The MS-FMR characterization is performed with the help of a field modulated FMR setup using HP 83752B generator, operating in the 0.01-20 GHz frequency range, to generate a radio frequency field () of variable power (-100 dBm to +20 dBm). The sample (figure 2b)) is mounted on a 0.5 mm microstrip line (the film side is in direct contact with the microstripline) connected to the HP generator via a semi-flexible SMA cable and to a lock-in amplifier (Stanford research system SR830) to derive the field modulated measurements via a Schottky detector. The microstrip line (MS), composed of 0.5 mm Cu-strip grown on Cu-back side metalized Al2O3 substrate, is designed to have 50 Ohm characteristic impedance and broadband. The MS and the sample are inserted inside the gap of an electromagnet connected to a DC power supplier to generate in-plane magnetic fields up to 5 kOe with a resolution of 0.1 Oe. This external magnetic field is modulated at a frequency of 170 Hz with an amplitude varying from 1 to 8 Oe allowing lock-in detection to be used in order to increase the signal-to-noise ratio. This broadband MS-FMR offers a high sensitivity allowing to detect a net magnetic moment down to emu.
The piezoelectric media is connected to a Keithley power supplier (Model 2400) allowing to apply DC voltages in the range [-200 V;+200 V] with 0.001 V resolution. For each applied voltage, a MS-FMR spectrum and an image of the top surface of the sample are recorded (note that the spectrum recording takes from 1 minutes to several hours depending on the magnetic field step and on the total width of the spectrum). The images recording at each step will serve to determine the in-plane field strains. Furthermore, being given the initial “homogeneous” surface of the sample, a speckle pattern has been spray painted in order to generate a contrast which will serve to calculate the strain fields (an image of a typical speckled pattern (spray-painted) is presented in Figure 2c)). In our setup, the images are recorded thanks to a pixels CCD AVT-Pike f421b camera vertically positioned in the top of the surface sample. The objective lens has been chosen in order to be sufficiently far from the electromagnet (20 cm) with a field view around cm2 as shown on Figure2b). The strain fields calculations (from the different images) have been perfumed by digital image correlation. Several commercial and open source softwares based on digital image correlation technique are available (Ncorr Ncorr , Moire Opticist , Aramis Aramis , Matchid Matchid , Correli Correli , …) for the determination of strains fields. In the following illustrative results, the DIC calculations have been performed by using Aramis. Finally, it is worth to mention that this setup is piloted via a Labview program providing flexibility of a real time control of the magnetic field and the DC voltage sweeps, step and rate, real time data acquisition and visualization.
IV Illustrative results
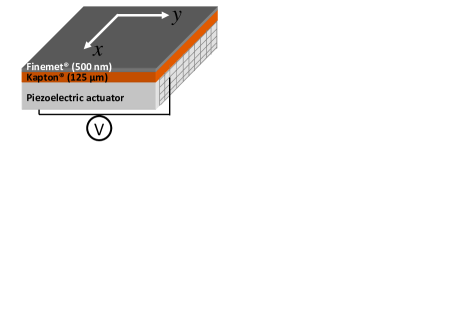
The methodology is illustrated with a “magnetic film/polymer substrate/piezoelectric actuator” system. Figure 3 presents a cross-section sketch of the fabricated heterostructure. An amorphous 530 nm thick Finemet® film has been deposited onto a 125 m thick polyimide flexible substrate (Kapton®) by radio frequency sputtering. The deposition conditions were a residual pressure of around 10-7 mbar, a working Ar pressure of 40 mbar and a RF power of 250 W. Prior to the Finemet® deposition, a 10 nm thick Ti buffer layer , was deposited on the substrate to ensure a proper adhesion of the Finemet® film. Finally, another 10 nm thick Ti cap layer was deposited on the top of the Finemet® film in order to protect it from oxidation. The composition of the film has been measured by EDS (Energy Dispersive Spectroscopy) and is close to that of the target (Fe73.5Cu1Nb3Si15.5B7) while the thickness of the film (530 nm) has been measured by Scanning Electron Microscopy. After deposition, the film/substrate system has been glued onto a piezoelectric actuator.
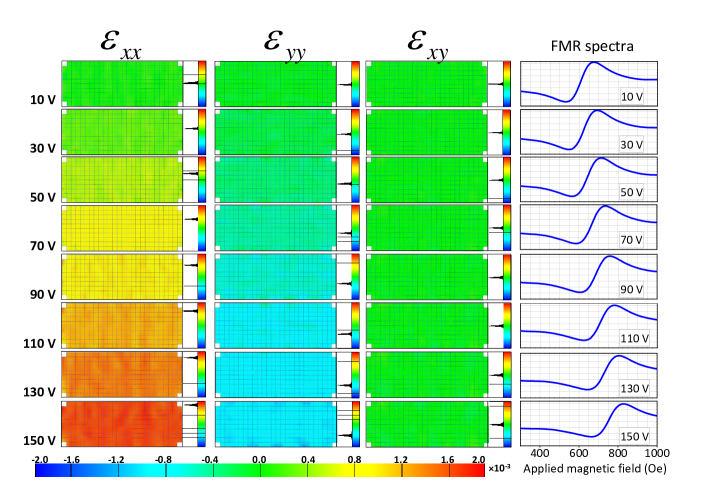
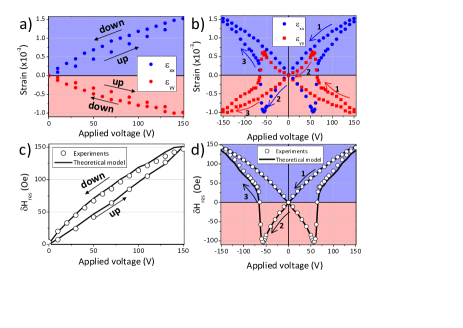
The figure 4 shows the map of the in-plane strains (, , ) for a few voltages applied to the piezoelectric actuator (from 0 V to V). For the three in-plane strain components, the whole distribution is estimated to be about so that the strain heterogeneities in the piezoelectric actuator are relatively weak. Obviously, to interpret the FMR results, we use the mean values of the elastic strains. When we apply a voltage, the mean values of and vary with , while the in-plane shear strain remains unchanged. This behavior is illustrated in figures 5-a and 5-b where the mean strains and are plotted as function of the voltage.
In 5-a, the curve corresponds to a simple electric loading-unloading (0V - 150V - 0V) ; the non-linearity of the curve is due to the specific piezoelectric behavior of the actuator, which is reversible. In figure 5-b, we show an unloading from 150V to -150V and a subsequent loading from -150V to 150V. We observe the so-called “butterfly” behavior that is due to polarization switching at about -60V during unloading and 60V during loading. In addition, we have checked that the analysis of and on the thin film gives same mean valuesZighem_JAP2013 . Thus, the transmission of the in-plane strains between the actuator and the surface of the film is close to .
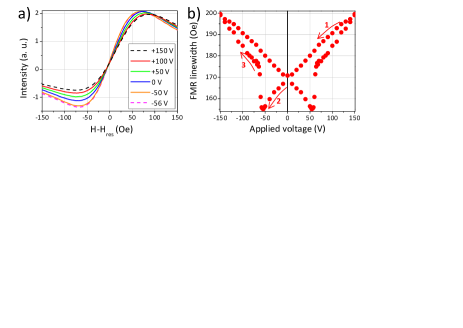
The voltage induced anisotropy has been studied in a specific configuration (magnetic field applied along axis). The influence of the applied voltage on the magnetic properties of the thin film has been probed by MS-FMR technique. Figures 5-c and 5-d show MS-FMR results obtained from experimental spectra recorded at 8 GHz with an applied magnetic field along the axis (i. e.) and for different applied voltages; typical experimental spectra are shown on figure 6-a. In these conditions, the deduced resonance fields are in a magnetic saturating regime so that we can deduce here the magnetostriction coefficient at saturation. It clearly appears that the resonance field increases with the applied voltage, which indicates that the axis is harder and the axis easier for the magnetization direction when a positive voltage is applied. This is consistent with a positive magnetostriction coefficient, as expected for amorphous Finemet® alloys Moulin2011 . The shift of the resonance fields as function of the applied voltage are presented in figures 5-c and 5-d and corresponds to the tests shown respectively in figures 5-a and 5-b for the strain analysis. Obviously, the observed non-linear and hysteretic variations of the resonance field is due to the variations of and as function of the applied voltage (see figure 3). In order to quantitatively bind the resonance field variations to the in-plane strains induced by the applied voltage, we can calculate the uniform precession mode frequency as function of the applied voltage (strain) by adding a magnetoelastic energy term to the total magnetic energy density of the film, as described previously. The solid lines in Figures 5-c and 5-d are fits to the experimental data calculated by using the parameters previously determined by MS-FMR ( s-1.Oe-1, emu.cm-3) and Brillouin light scattering ( GPa and ) Fillon2014 . Actually, the magnetostriction coefficient of the thin film is the sole parameter to be determined using this experiment and has been estimated to be , slightly lower that the bulk counterpart () Moulin2011 .
In addition, in figure 6-b, the FMR peak to peak linewidth (), defined as the field difference between the extrema of the sweep-field measured FMR spectra, is plotted as function of the applied voltage using 8 GHz driving frequency. This figure shows that is significantly enhanced by the applied voltage and interestingly presents similar behavior as the resonance field shift and the strain (5-b and 5-d) suggesting its correlation with the voltage induced strain. The modelling of the strain behavior of the FMR linewidth is out of this paper scope and will be addressed in forthcoming papers. However, this strain tuning of the FMR linewidth remains a simple and promising manner to artificially choose the desired damping depending on the aimed application.
V Conclusion and perspectives
We have shown a methodology that combines microstrip ferromagnetic resonance (MS-FMR) and digital image correlation (DIC) in order to study the voltage-induced strains effect on magnetic anisotropy in thin films. The elastic strains are measured on the actuator (or substrate) side while the magnetic resonance field is measured in the thin films. This technique allows determining the magnetostriction coefficient of the film and can also be used to determine the effective magnetoelectric coefficient of the whole system and the piezoelectric coefficient related to the in-plane voltage-induced strains. This methodology can be applied to system for which the strains are well transmitted at the different interfaces (“film/piezoelectric substrate” system or “film/polymer substrate/piezoelectric actuator” system). Moreover, the strain tuning of the FMR linewidth is promising for spintronics applications. Indeed, the magnetic damping controls how fast the magnetization reverses and therefore is interesting technological parameter.
Acknowledgements.
The authors gratefully acknowledge the CNRS for his financial support through the “PEPS INSIS” program (FERROFLEX project) and the Université Paris 13 through a “Bonus Qualité Recherche”.References
- (1) Y. K. Fetisov and G. Srinivasan, Appl. Phys. Lett. Appl. Phys. Lett. 88, 143503 (2006)
- (2) G. Srinivasan, Ann. Rev. Mater. Res. 40, 153-178 (2010)
- (3) G. Subramanyam, M. W. Cole, N. X. Sun, Thottam S. Kalkur, N. M. Sbrockey, G. S. Tompa, X. Guo, C. Chen, S. P. Alpay, G. A. Rossetti Jr., K. Dayal, L.-Q. Chen and D. G. Schlom , J. Appl. Phys. 114, 191301 (2013)
- (4) M. Liu, Z. Zhou, T. Nan, B. M. Howe, G. J. Brown and N. X. Sun, Adv. Mater. 25, 1435-1439 (2013)
- (5) I. V. Zavislyak, M. A. Popov, G. Sreenivasulu and G. Srinivasan, Appl. Phys. Lett. 102, 222407 (2013)
- (6) T. X. Nan, Z. Y. Zhou, J. Lou, M. Liu, X. Yang, Y. Gao, S. Rand, and N. X. Sun, Appl. Phys. Lett. 100, 132409 (2012)
- (7) Y. T. Yang, Y. Q. Song, D. H. Wang, J. L. Gao, L. Y. Lv, Q. Q. Cao and Y. W. Du, J. Appl. Phys. 115, 024903 (2014)
- (8) S. Fusil, V. Garcia, A. Barthelemy, M. Bibes, Ann. Rev. Mater. Res. in press, DOI: 10.1146/annurev-matsci-070813-113315 (2014)
- (9) T. Jin, L. Hao, J. Cao, M. Liu, H. Dang, Y. W., D. Wu, J. Bai, and F. Wei, Appl. Phys. Expr. 7, 043002 (2014)
- (10) S. Rizwan, S. Zhang, T. Yu, Y. G. Zhao and X. F. Han, J. Appl. Phys. 113, 023911 (2013)
- (11) M. Liu, S. Li, O. Obi, J. Lou, S. Rand and N. X. Sun, Appl. Phys. Lett. 98, 222509 (2011)
- (12) N. Lei, T. Devolder, G. Agnus, P. Aubert, L. Daniel, J.-V. Kim, W. Zhao, T. Trypiniotis, R. P. Cowburn, C. Chappert, D. Ravelosona and P. Lecoeur, Nature Com. 4, 1378 (2013)
- (13) C. Thiele, K. Drr, O. Bilani, J. Rödel, L. Schultz, Phys. Rev. B 75, 054408 (2007)
- (14) J. H. Park, J.-H. Lee, M. G. Kim, Y. K. Jeong, M.-A. Oak, H. M. Jang, H. J. Choi, and J. F. Scott, Phys. Rev. B 81, 134401 (2010)
- (15) D. A. Filippov, G. Srinivasan and A. Gupta, J. Phys. Cond. Matter 20, 425206 (2008)
- (16) C. Pettiford, J. Lou, L. Russell, and N. X. Sun, App. Phys. Lett. 92, 122506 (2008)
- (17) C. Bihler, M. Althammer, A. Brandlmaier, S. Geprägs, M. Weiler, M. Opel, W. Schoch, W. Limmer, R. Gross, M. S. Brandt and S. T. B. Goennenwein, Phys. Rev. B 78, 045203 (2008)
- (18) A. Brandlmaier, S. Geprägs, M. Weiler, A. Boger, M. Opel, H. Huebl, C. Bihler, M. S. Brandt, B. Botters, D. Grundler, R. Gross and S. T. B. Goennenwein, Phys. Rev. B 77, 104445 (2008)
- (19) F. Zighem, D. Faurie, S. Mercone, M. Belmeguenai and H. Haddadi, J. App. Phys. 114, 073902 (2013)
- (20) I. G. Will, A. Ding, and Y. B. Xu, Rev. Sci. Instr. 83, 064707 (2012)
- (21) W. Brückner, C. Lang and C. M. Schneider, Rev. Sci. Instr. 72, 2496 (2001)
- (22) R. Varghesea, R. Viswanb, K. Joshia, S. Seifikarc, Y. Zhoua, J. Schwartzc, S. Priyaa, J. Mag. Mag. Mater. 363, 179–187 (2014)
- (23) C. B. Hill, W. R. Hendren, R. M. Bowman, P. K. McGeehin, M. A. Gubbins and V. A. Venugopal, Meas. Sci. Tech. 24, 045601 (2013)
- (24) K. Nesteruk, R. Żuberek, S. Piechota, M. W. Gutowski and H. Szymczak, Meas. Sci. Tech. 25, 075502 (2014)
- (25) B. Buford, P. Daghat and A. Jander, J. Appl. Phys. 115, 17E309 (2014)
- (26) http://www.ncorr.com/
- (27) http://www.opticist.org/
- (28) http://www.gom.com/
- (29) http://www.matchid.org/
- (30) G. Besnard, F. Hild, S. Roux, Exp Mech 46, 789 (2006).
- (31) J. Moulin, I. Shahosseini, F. Alves, F. Mazaleyrat, Journal of Micromechanics and Microengineering 21, 074010 (2011)
- (32) A. Fillon, C. Jaouen, A. Michel, G. Abadias, C. Tromas, L. Belliard, B. Perrin, P. Djemia, Phys. Rev. B 88, 174104 (2014)