Viscoelastic transient of confined Red Blood Cells
Abstract
The unique ability of a red blood cell to flow through extremely small microcapillaries depends on the viscoelastic properties of its membrane. Here, we study in vitro the response time upon flow startup exhibited by red blood cells confined into microchannels. We show that the characteristic transient time depends on the imposed flow strength, and that such a dependence gives access to both the effective viscosity and the elastic modulus controlling the temporal response of red cells. A simple theoretical analysis of our experimental data, validated by numerical simulations, further allows us to compute an estimate for the two-dimensional membrane viscosity of red blood cells, Nsm-1. By comparing our results with those from previous studies, we discuss and clarify the origin of the discrepancies found in the literature regarding the determination of , and reconcile seemingly conflicting conclusions from previous works.
I Introduction
The study of blood flow properties is a highly active field of research, both experimentally Baskurt2 and theoretically Gompper1 ; Gompper2 ; Misbah1 . Identifying the relevant (bio)physical parameters controlling such properties is of great interest in the context of diagnosis of blood disorders, and also represents an important fundamental challenge in numerical and theoretical modeling of complex fluids. Blood is a suspension of cellular elements (Red and White Blood Cells, Platelets) in a carrier fluid (Plasma). It is known to behave as a non-Newtonian fluid, the complex rheology of which is mainly due to the presence of Red Blood Cells (RBC), its major cellular component Baskurt2 . The flow properties of blood are thus essentially governed by the concentration of RBCs (the so-called hematocrit), their mutual interactions, and their individual mechanical properties. Over the past fifty years, the latter have been the focus of numerous studies which aimed at characterizing or modeling the viscoelastic behavior of individual RBCs, and in particular that of the cell membrane which separates the outer suspending plasma from the inner cytoplasm Chien ; Hochmuth ; Kim ; Betz ; Fedosov ; Suresh1 ; Suresh2 ; Dimi . The membrane region comprises a lipid bilayer, an external glycocalyx layer, and an inner two-dimensional (2D) cytoskeleton composed of a spectrin network. The inner and outer layers are connected to the bilayer through transmembrane proteins. Mechanical properties of the membrane are typically described in terms of bending and expansion moduli of the bilayer, a 2D elastic shear modulus of the spectrin network (), and a 2D membrane viscosity () Hochmuth ; Kim .
Aside from their influence on bulk rheology, the membrane properties of RBCs are also of utmost importance in microconfined flows, i.e. in the microvascular network, where they control the ability of cells to adapt their shape and flow through channels having dimensions on the order of or smaller than the size of unstrained RBCs. Such a capacity of RBCs to flow through very small channels is central in their physiological function of oxygen delivery to tissue, and alterations of the viscoelasticity of RBCs are recognized to be associated with various pathologies Mohandas . In this context, in vitro studies of microconfined flows are currently viewed as a potential diagnosis tool to discriminate between healthy and pathological cells Kwan ; Guido1 ; Guido2 .
Along this line, several works have investigated the steady-state behavior of confined RBCs, from the theoretical Secomb2 ; Secomb3 , numerical Gompper3 ; Misbah2 ; Misbah4 and experimental Guido2 ; Stone ; Rosen ; Bit ; Hou points of view, in order to probe e.g. the influence of mechanical properties on cell shape or velocity. On the other hand, a limited number of studies have investigated the behavior of RBCs in transient situations. Early studies have investigated the relaxation of RBC deformation following the removal of an applied mechanical stress: the pioneer work by Hochmuth et al. focused on shape recovery in micropipette experiments Evans1 ; Baskurt and Meiselman later performed rheo-optical strain relaxation experiments upon cessation of shear of concentrated RBC suspension Baskurt , and Bronkhorst et al. pioneered the use of optical tweezers to conduct shape recovery experiments on single cells Bronkhorst . More recently, Guido and Tomaiuolo have performed measurements of RBC response time upon flow start in microchannels Guido1 , and Braunmüller et al. have investigated RBC shape relaxation using microfluidic tools Franke .
The above studies have provided consistent results for the timescale controlling shape relaxation (or establishment) of healthy RBCs: s. Moreover, chemical or physical treatments known to affect the mechanical properties of RBCs were observed to clearly modify this characteristic time Baskurt ; Guido1 . From such measurements, authors concluded that was indeed governed by the viscoelastic properties of RBCs. Following Evans and Hochmuth Evans2 , has been commonly related to the mechanical properties of the cell as: . Using typical values Nm-1 taken from the literature Evans1 ; Guido1 , a 2D membrane viscosity Nsm-1 has been computed from the measured Guido1 ; Guido2 ; Evans1 ; Baskurt . Puzzlingly, such studies of the transient response of RBCs conclude to a value of the membrane viscosity that contrasts with that coming from other groups of experiments, which rather yield Nsm-1 Chien2 ; Tran ; Rasia .
The origin of such a discrepancy between the few experimental determinations of the membrane viscosity is a long-standing issue and is still an open question. However, the membrane viscosity is often a required input parameter, either for experimental data analysis Fischer or in advanced numerical models of RBCs Secomb1 ; Suresh2 ; Gompper1 . In the perspective of, e.g., quantitative numerical studies of the flow behaviour of suspensions of RBCs, there is therefore a clear need for a more accurate knowledge of the membrane viscosity.
We address this question in the present paper. We present an analytical model that describes the shape evolution of a RBC in shear flow, which we validate using 3D numerical simulations. We use this framework to analyze the results of startup flow experiments. The latter are performed in the spirit of the study by Tomaiuolo and Guido Guido1 : we extend the work of these authors, and probe the effect on of (i) the flow strength, (ii) the viscosity of the suspending fluid (), (iii) a chemical treatment known to affect the intrinsic mechanical properties of RBCs.
We find that depends on the flow strength, and exploit this dependence to extract, in an original way, both the effective viscosity and the elastic modulus which govern the characteristic transient time of RBCs. We then demonstrate that such an effective viscosity is not identical to the membrane viscosity, but can be used to determine the actual . Doing so, we obtain a value of which is in good agreement with the low values reported by Tran-Son-Tay et al. Tran . By combining theoretical, numerical, and experimental efforts in this study of viscoelastic transients of RBCs, we are thus able to reconcile the seemingly conflicting results regarding membrane viscosity of RBCs.
II Theoretical framework
II.1 Qualitative discussion
The membrane of a RBC as well as the internal and external fluids are characterized by their respective viscosities , and , with , where designates the radius of a sphere having the same surface area as that of a RBC. RBC deformation due to external flow is accompanied by dissipation in the three fluids. Since one expects the slowest mechanism to govern the dynamics, this entails that the three regions act as dashpots in parallel, so that the total effective dissipation coefficient can be written as where , and are dimensionless numbers to be specified below. Shape deformation of a RBC occurs on a time scale (to be determined) of order and deformation is typically on the order of the RBC radius, , so that the viscous tension created by RBC deformation is of order (this is a force per unit length). This force counterbalances the combined effects of the force due to external flow, of order ( being a typical applied velocity), and of the non-dissipative part due to elasticity of the cell. The membrane is endowed with bending and shear elastic energy due to cytoskeleton. Calling the bending modulus (having the dimension of an energy), the typical force per unit length associated with it is of order . The shear elastic modulus is denoted as and represents a force per unit length (a 2D shear elastic modulus), so that total elastic force per unit length is of order . The force balance yields
| (1) |
Eq. 1 provides us with the typical time scale of deformation of a RBC. Let us rewrite (1) as
| (2) |
where
| (3) | |||
| (4) |
with , , and where and .
The different coefficients above (, , ) can only be determined numerically (see below). However, when the shape of a cell is not very far from a sphere, an analytical calculation is possible Misbah2006 ; Danker2007 ; Vlahovska2007 ; Lebedev2008 ; Vlahovska2011 ; Danker2009 . This has been done for the case of vesicles in a linear shear flow Lebedev2008 , taking into account , and , and yields , , and . A similar study has been performed for a Poiseuille flow Danker2009 , incorporating only the contributions of the outer and inner fluid viscosities, which provides and for the flow of a vesicle in a channel of internal radius 5 m, as it is the case in our experiments. We discuss in the following section our choice for these parameters.
II.2 Numerical simulations
We have performed a systematic numerical study of a model of RBC. The imposed flow is given by
| (5) |
where is the velocity at the center of the flow, the axis is along the flow direction, while the and axes are along the transverse directions. We consider here an unbounded flow. The curvature of the imposed Poiseuille flow alone, without the no-slip boundary conditions at the channel walls, has proven to account for several experimental facts provided that the RBC is not too confined, as shown in Coupier2012 . in Eq. 5 specifies at which distance from the center the imposed velocity falls to zero. was set equal to 5 m as in the experiments described below.
Numerical simulations for 3D model of RBC are based on the boundary integral method, as originally described for vesicles in Biben2011 . In a recent work Farutin2014 , we have extended this study to include membrane shear elasticity mimicking the spectrin network of RBCs (membrane viscosity is not accounted for at present). We have also made several new numerical improvements that allowed us to study very deflated shapes, as required for simulation of real RBCs. We only provide here the main results concerning numerical determination of shapes and relaxation time scales, while details of the numerical techniques can be found in Farutin2014 . The RBC model takes into account both bending and shear elasticity. The Helfrich model is adopted for the bending energy, while the shear elasticity of the cytoskeleton is described using a FENEM-like (Finite Extensibility Non-linear Elasticity) strain hardening model, which has revealed to capture some realistic features of RBCs (for details see Farutin2014 ).
The RBC was modeled as an inextensible membrane, endowed with a shear modulus Nm-1 and a bending modulus J. The stress-free state of the membrane was chosen as a biconcave shape with a surface area of m2 and a volume of m3 (i.e. m). Most simulations were performed using 5120 triangular elements to discretize the membrane (2562 vertices). The viscosity of the inner solution of the cell was chosen as mPas Betz . The viscosity of the suspending medium, , and the flow rate were varied as in the experiments. The elastic and geometrical parameters of the cell were chosen in order to get a model consistent with optical tweezers experiments Mills2004 . Several additional simulations were performed with different values of and in order to mimic the chemical treatment of the cell.
The characteristic time of the cell was determined by monitoring the transient behaviour of the cell velocity upon flow startup: in a manner similar to what has been used for experimental data analysis, we define the characteristic time as the time needed for the cell to reach 99% of its steady-state velocity.
III Materials and Methods
III.1 Materials
Fused silica capillaries of inner diameter 10 m and outer diameter 150 m were purchased from BGB Analytik (Germany). Polydimethylsiloxane (PDMS, Dow Corning Sylgard 184) was obtained from Neyco (France). Bovine Serum Albumin (BSA), Phosphate Buffered Saline (PBS) tablets, dextran of average molecular weight 40 kDa, and diamide were purchased from Sigma Aldrich (France). Solutions of PBS 0.01M and pH 7.4 were prepared using 18.2 Mcm ultrapure water.
The viscosity of PBS and PBS+dextran solutions was measured on a cone/plate rheometer (Anton Paar MCR301), and found to be mPas and 5 mPas respectively for pure PBS and PBS + 10%w of dextran 40kDa.
III.2 Preparation of blood samples
Blood samples from healthy donors were obtained through the Établissement Français du Sang (Grenoble) and stored at 4∘C until use. Red blood cells were extracted from whole blood by successive washes in PBS solution and centrifugation. After each centrifugation, the supernatant was pipetted out and PBS was added to refill the tube. The washing/centrifugation cycle was repeated three times.
RBCs were used as such, or after being exposed to diamide: using a protocol akin to that described in Stone , erythrocytes were incubated at room temperature for 30 minutes in a PBS solution containing 5mM of diamide, then washed in PBS before use in the flow cell.
III.3 Experimental Setup
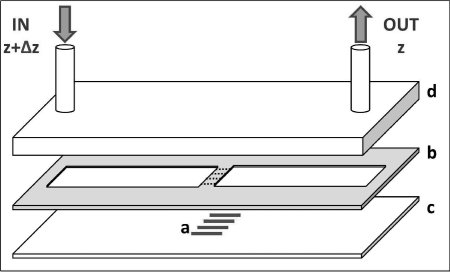
Experiments were performed using a custom-built flow cell composed of the following elements, as illustrated in Fig. 1: 4 silica capillaries were cut in 3-6 mm long segments and fitted into 4 grooves in the central band of a PDMS spacer. The spacer was then sandwiched between a glass coverslip and a clear polycarbonate plate, and the stack was clamped in an aluminum frame to ensure tight sealing of the cell. The inlet and outlet drilled into the polycarbonate upper plate were connected by silicone tubing to external reservoirs. A solenoid valve was connected between the inlet reservoir and the flow cell, in order to control the start-up of the flow, while the steady-state flow velocity was controlled by adjusting the height difference () between the liquid free surfaces in the inlet and outlet beakers. The response time upon startup of the whole setup (including valve, tubings and flow cell) was measured to be 10 ms (see Fig. 4a below).
 |
Before the experiments, the flow cell was filled with a PBS solution containing 0.2 %w BSA, in order to coat the inner walls of the capillaries and prevent spurious adhesion of the cells to the walls of the microchannels. A RBC suspension was then added to the inlet reservoir and the concentration adjusted with PBS so that the initial bulk hematocrit was less than 1%.
The flow cell was placed on the motorized stage of an inverted microscope (Olympus IX-71) equipped with a 100x oil-immersion objective. Image sequences of the flowing RBCs were acquired using a high speed camera (Phantom Miro4) at a frame rate of 4000 images per second.
III.4 Experimental data analysis
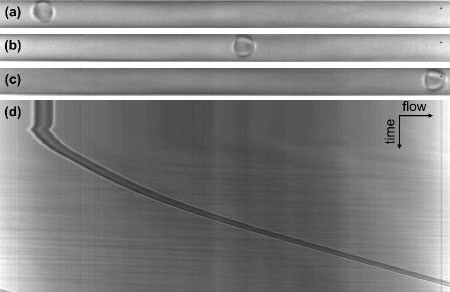
The recorded image sequences were analyzed using ImageJ software and Matlab toolboxes. Image stacks showing the position of a RBC inside the capillary as a function of time were opened with ImageJ and cropped in order to keep only a rectangular region of interest (ROI), of height 10 m and length 167 m, enclosing the lumen of the capillary focused at its midplane (see Fig. 2a-c). The intensity of each image in the stack was averaged over the height of the ROI, and the result of this averaging was plotted as a function of time, in order to obtain a space-time diagram (see Fig. 2d). Such a space-time plot was further processed with a gradient filter and finally thresholded, in order to obtain a binary image showing the position of the front and rear parts of the flowing red blood cell as a function of time. This binary image was then processed with standard Matlab tools in order to extract the position of the front or rear ends as a function of time, , from which the instantaneous velocity was computed. We have checked that no significant difference was obtained on when computed from the position of the front or rear end, and that the obtained results were quantitatively in agreement with velocity measurements performed using Particle Imaging Velocimetry (PIV) tools from ImageJ. The method described above has the benefit of being much less time consuming than PIV.
 |
The characteristic transient time () of RBCs upon flow startup was determined in two different ways:
(i) we have estimated from visual inspection of the time-dependent shape of RBCs, defining as the time above which no change in RBC shape was visible by eye;
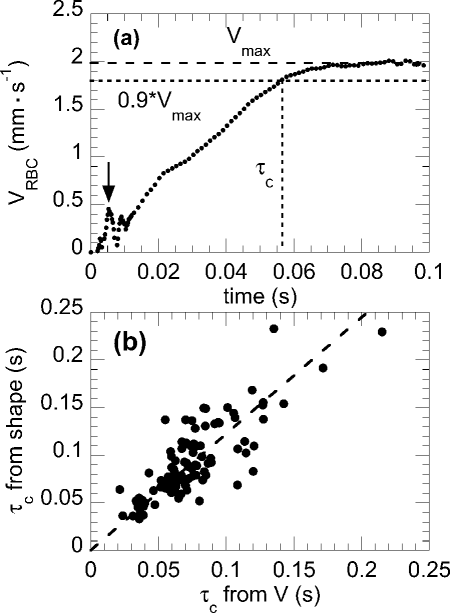
(ii) we have computed the transient time from RBC velocity, defining as the time required for a RBC to reach 90% of its steady-state velocity, as illustrated in Fig. 4a below.
IV Results
IV.1 Measurements of transient time
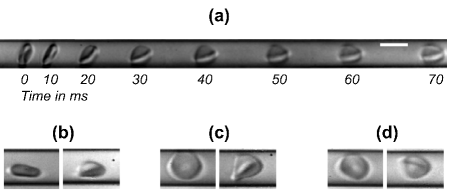
An example of cell behavior during flow startup is given in Fig. 3a. It can be seen that a RBC initially at rest in the channel gradually deforms with time, reaching a steady-state shape after a few tens of milliseconds. In the range of pressure drop explored in our work, the steady-state shape of the deformed RBC could be either parachute or slipper-like Skalak1969 ; Secomb1982 ; Misbah3 , as illustrated in Figs. 3b-d.
 |
The time dependence of the velocity of a RBC () is illustrated in Fig. 4a. From such curves we compute:
(i) the steady-state velocity of the cells (), which depends, as expected for a Poiseuille flow, linearly on the imposed pressure drop , as shown in the inset of Fig. 4a, and
(ii) the transient time as defined in Fig. 4a.
In Fig. 4b, we compare the characteristic time determined visually (from shape evolution) and from velocity transients, for all the data collected on RBCs suspended in PBS solution (the set of data corresponds to a total of about 100 cells). We find a good correlation between the times determined from the two methods, with computed from velocity being typically 20% smaller. This difference arises, to a large extent, from the criterion we use to define from velocity transients, which underestimates the time to actually reach steady-state by 10-20%.
 |
The results presented in the rest of the paper correspond to determined from velocity transients. Data are presented as average values for and , with error bars corresponding to one standard deviation, computed on groups of 8 to 12 RBCs.
IV.2 Dependence of on flow strength, external viscosity and diamide treatment
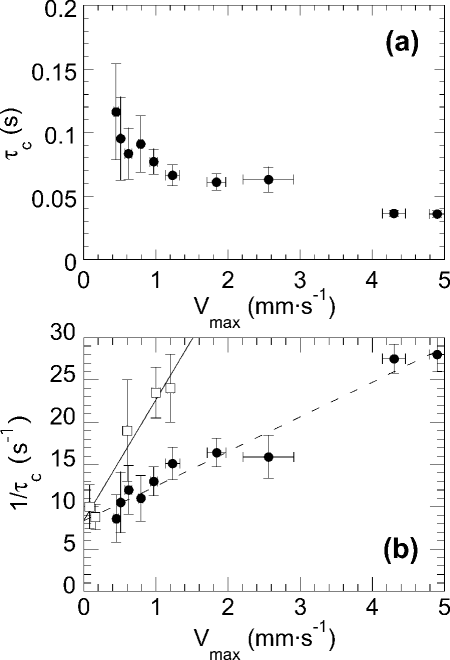
We observe that the characteristic time decreases as the flow strength increases. This is illustrated in Fig. 5a, for RBCs suspended in PBS solution, where it is seen that decreases from to 0.03 s as increases from 0.5 to 5 mms-1.
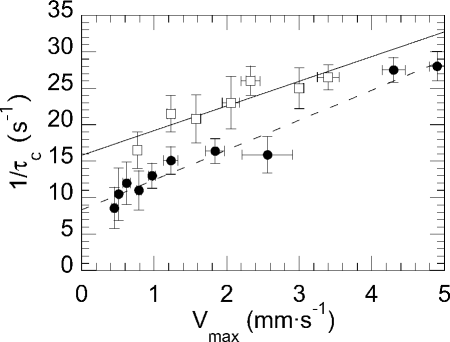
Plotting the inverse time as a function of , we find that exhibits a linear increase with the steady-state velocity (Fig. 5b).
Upon increasing the viscosity of the suspending medium from that of PBS solution ( mPas) to that of the 10%w dextran solution ( mPas), we observe that the dependence of on remains linear, with a greater slope than for RBCs suspended in PBS and a similar value of the intercept at zero velocity (Fig. 5b).
 |
Finally, we show in Fig. 6 the effect of diamide on transient time. It is seen that diamide-treated RBCs still exhibit an inverse transient time which increases linearly with , with an overall upward shift of the curve with respect to that obtained for healthy RBCs.
As discussed in detail below, all the above results are in good agreement with the simple heuristic argument given in section II.1.
 |
IV.3 Numerical results
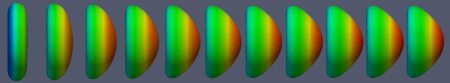
Fig. 7 shows a snapshot illustrating the temporal evolution of the shape of a RBC obtained from simulations, starting from a biconcave shape at rest.
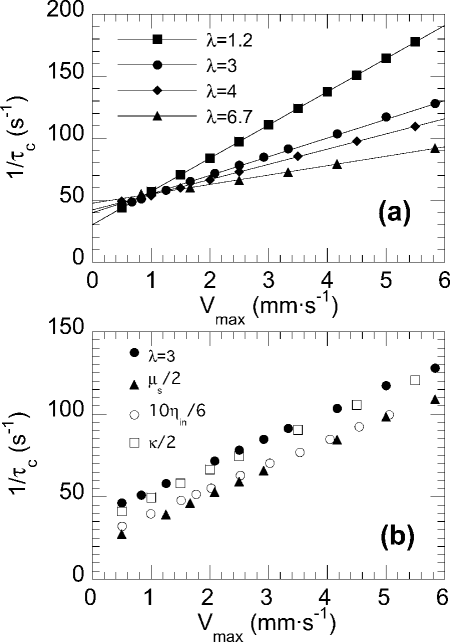
The inverse relaxation time is plotted in Fig.8 as a function of the steady-state velocity. is seen to vary linearly with the flow rate, and to display a stronger dependence on for lower viscosity contrasts , i.e. for larger (see Fig. 8a). There is no apparent deviation from linearity neither for weak nor for strong flows in the range of explored velocities, in qualitative agreement with experiments.
As shown in Fig. 8b, for a given viscosity contrast , changing the value of the inner fluid viscosity, , merely results in a vertical shift of the curve, without affecting the slope. Data corresponding to an inner viscosity can be obtained from results computed for by simply rescaling and by the ratio .
The effect of varying the shear or the bending modulus is illustrated in Fig. 8b. Decreasing by a factor of two leaves the slope of the curve essentially unchanged, and results in a twofold decrease of the intercept at zero velocity. Decreasing by a factor of two increases the slope by 10% and lowers the offset at zero velocity by about 15%.
V Discussion
V.1 Numerical and analytical results
Fig. 7 illustrates the ability of the numerical model to reproduce the shape evolution of a RBC upon startup of a Poiseuille flow: the shape transition from discocyte to parachute obtained numerically is consistent with experimental observations such as that shown in Fig. 3a.
There is a strikingly good qualitative agreement between the simulations and the model presented in section II: as inferred from a heuristic argument (Eq. 1), a linear dependence of on is predicted numerically, the slope of this linear dependence is controlled by the effective viscosity, hence by the ratio , while the elastic moduli affect only the value of at . The magnitude of the effects produced by varying either or indicates that the elastic behavior is essentially governed by (Fig. 8b).
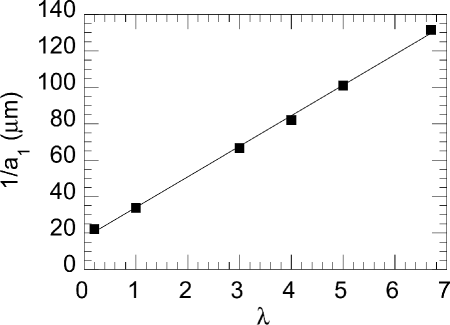
Such an agreement between numerics and theory prompts us to further exploit numerical simulations. Fig. 8a shows that the slope of , called in Eq. 2, depends on the viscosity contrast . In Fig. 9, we plot the inverse slope, , obtained from numerical simulations, as a function of . It is seen that increases linearly with . This is again fully consistent with theoretical predictions (see Eq. 3). A linear fit of therefore allows us to determine the parameters and , which set the relative contributions of and to the effective viscosity (see Eq. 3): we get m and m, which yields, with m, and . These values are to be compared with those predicted by theories, namely and for the case of a linear shear flow Lebedev2008 , and and for vesicles in a Poiseuille flow Danker2009 . The fair agreement between the parameters determined numerically and their theoretical values is all the more satisfactory that the analytical treatments proposed in Lebedev2008 and Danker2009 are based on spherical harmonics expansions that are strictly valid only for small deformations around a reference spherical shape, whereas numerical simulations handle the case of an initially biconcave, highly deflated, cell undergoing large deformations under flow. This provides strong support to the fact that analytical models such as those developed in Lebedev2008 and Danker2009 are robust and able to capture the main contributions to dissipation during vesicle flow.
On this basis, we will now analyze our experimental data within the proposed theoretical framework. Since numerical simulations account for more realistic shapes and deformations of the cells than theoretical models, we will use in the following the values of the parameters and determined from the numerical results. As far as the parameter is concerned, it cannot be determined from simulations since membrane viscosity is not included in the numerical model. Still, the reasonable agreement between the numerical and theoretical values obtained for and suggests that analytical parameters are of the correct order of magnitude, and we will therefore use the theoretical value Lebedev2008 . A more accurate estimate of , i.e. of the exact weight of in , would call for more advanced simulations accounting for membrane viscosity.
V.2 Interpretation of experimental results for healthy RBC
We first compare our results with those obtained by Tomaiuolo and Guido Guido1 : most of the results presented in their study have been obtained at a single steady-state velocity of 1 mms-1, at which s is found for healthy RBCs in PBS. At the same velocity, we measure a characteristic time s, which is in excellent quantitative agreement.
Besides, as predicted from a simple heuristic argument (see Eqs. 1 and 2), we find experimentally that is linear with (Fig. 5). Linear fits of the data obtained in PBS and PBS+dextran yield the values of the intercept at origin () and slope () reported in Table 1. We observe roughly a threefold increase in the slope when is multiplied by 3. Recalling that (Eq. 1), this suggests that is only marginally affected by the external viscosity for in the range mPas, hence that the contribution of to is weak. This is also consistent with the fact that the change in does not modify significantly the value of . In our experiments, the main effect of changing is therefore to affect the magnitude of the hydrodynamic forces () applied to the RBC.
From and , we compute the effective viscosity and elastic modulus which are given in Table 1. We thus get a value of mPas which is in good agreement with the one reported in a recent study by Betz et al., namely mPas Betz . The value of Nm-1 is consistent with that of 2.5Nm-1 reported for by Henon et al. Henon . This suggests that, in the experimental conditions used in the present study, is governed by the shear elastic modulus. This is in agreement with our numerical results, which show that the value of at is essentially controlled by (Fig. 8b).
Furthermore, from the values of and using Eq. 3, we make the following estimates for the membrane viscosity: mPas (see Table 1). From such an estimate, we conclude that, for an outer fluid viscosity in the physiological range ( mPas), and are the two major contributions to the effective viscosity: mPas . Finally, if we compute a 2D membrane viscosity as , we get Nsm-1.
To summarize, our results regarding the order of magnitude of are consistent with those from previous works on the transient response of RBCs Evans1 ; Guido1 ; Guido2 , but on the other hand we estimate a membrane viscosity which is about one order of magnitude lower than the values reported in these studies (i.e. Nsm-1 Evans1 ). However, we note that the latter are based on an analysis proposed initially by Evans and Hochmuth Evans2 , who developed a model assuming that the only dissipation relevant to RBC shape recovery is associated to the membrane viscosity. They thereby neglected dissipation in the inner and outer fluids, and estimated . By contrast, here we make no such assumption. We find that (i) the effective viscosity is a combination of , and , and (ii) each viscosity entering has a weight which is larger than 1 (). The latter point, which is an outpout of our theoretical and numerical analysis, is consistent with the ad hoc assumption made by Betz et al. in their modeling of membrane fluctuations Betz . Taking into account all the viscous contributions and their respective weights in our data analysis, we get values for in very good agreement with those reported by Tran-Son-Tay et al. Tran . These authors deduced from the tank-treading frequencies of RBCs under shear, using a model incorporating all dissipation sources, and obtained values which lie between 0.5 and 1.2 Nsm-1. Our work, fully consistent with the one of Tran-Son-Tay et al. Tran , thus strongly suggests that the assumption made by Evans and Hochmuth leads to an overestimate of and is at the origin of the apparent discrepancy between the reported values of RBC membrane viscosity.
| (mPas) | () | (mm-1) | (mPas) | (Nm-1) | (mPas) |
| 1.5 | |||||
| 5 |
V.3 Comparison between experiments and numerical simulations
Although numerical simulations show a linear dependence of on , in qualitative agreement with experiments, we observe that both the slope () and the extrapolated value of at zero velocity () predicted numerically are larger than the experimental values ( and ). This is shown in the summary table below (Table 2).
Following the data analysis proposed in the previous section, the difference in slopes can straightforwardly be attributed to the contribution of membrane viscosity to the effective viscosity. Indeed, we have used the numerical results regarding to determine the parameters and (Fig. 9), and then fitted the experimental data using Eqs. 2 and 3 in order to evaluate , so that the difference between the inverse slopes merely reads . Using the latter expression to compute yields exactly the same values reported before for the membrane viscosity.
Now, a much more stringent test is to check whether the difference in the offsets () can be attributed to the contribution of membrane viscosity, because in contrast to , was not used to determine parameters of the model. From Eq. 4, we expect:
| (6) |
In order to check the above equality, we estimate from Eq. (6) and compare it to the effective modulus determined in the previous section. Using the values of reported in Table 2 and of determined above, we get: Nm-1 respectively for ( mPas) and ( mPas). This is in quantitative agreement with the value of Nm-1 determined from experimental data, and therefore supports the fact that discrepancies between simulations and experiments are due to the missing contribution of membrane viscosity in the numerical model.
| () | (mm-1) | () | (mm-1) | |
|---|---|---|---|---|
| 4 | 42.1 | 12.3 | 8.3 | 4.1 |
| 1.2 | 30.3 | 26.8 | 8.4 | 14.0 |
V.4 Effect of diamide treatment
In Fig. 6, we see that treating RBCs with diamide mainly results in an upward shift of the curve , i.e. diamide-treated RBCs exhibit a shorter transient time than healthy ones. From a linear fit to the data, we obtain mPas and Nm-1. The major effect of diamide is therefore an increase of the effective elastic modulus , by roughly a factor of 2 with respect to healthy RBCs. Diamide is known to affect the spectrin network of RBCs, by creating crosslinks between proteins through the formation of disulphide bonds Fischer2 . Such a crosslinking process has been reported to induce a stiffening of RBCs Fischer2 ; Johnson ; Rodrigues ; Shin , via an increase in the membrane shear modulus Fischer2 . Our results concerning the effect of diamide on RBC transient time are therefore fully consistent with these previous studies. Furthermore, attributing the increase of to an increase in is consistent with the numerical results presented in section IV.3. However, Forsyth et al., from which we have adapted the protocol for diamide treatment in the present work, recently reported that, in microfluidics experiments relying on cell stretching during transient confinement in a channel constriction, no difference in elongation could be detected between healthy and diamide-treated RBCs Stone . We believe that the apparent contradiction between our finding and the conclusions of reference Stone merely arises from the very different time scales probed in the two studies. Indeed, while we characterize the effect of diamide by measuring the transient viscoelastic time of RBCs, of order ms, Forsyth et al. probe the elongation of RBCs during a transient confinement that lasts between 1 and 5 ms only (calculated from the flow speeds and constriction length reported in Stone ). The duration of confinement in the work of Forsyth et al. is therefore much shorter than the time required for RBCs to reach their steady shape. This, added to the fact that we have used both a slightly larger diamide concentration and treatment time in our study, is likely to be at the origin of the differences between our work and the one reported in Stone .
VI Conclusions
We have performed a study of the characteristic viscoelastic time of red blood cells. We have combined theory and numerical simulations in order to establish a framework for the analysis of flow startup experiments on RBCs confined into microchannels. We have obtained experimental values of in quantitative agreement with those from previous studies, measured either from flow startup Guido1 , relaxation after cessation of shear Baskurt , or micropipette experiments Evans1 . Moreover, we have shown that probing the dependence of on flow strength allows us to determine both the effective viscosity () and elastic modulus (), and have obtained values for these two quantities which are consistent with those from other works Betz ; Henon . Most importantly, we have shown that, in contrast to the assumption made by Evans and Hochmuth Evans2 and commonly used later Guido1 ; Guido2 ; Evans1 ; Baskurt , is not equal to the membrane viscosity . We have identified, from theory and simulations, the relative contributions of the membrane, inner () and outer () fluid viscosities to the overall effective viscosity, and used this in order to compute the value of the membrane viscosity from our experimental data. Doing so, we obtain in the range mPas, which translates into a 2D viscosity Nsm-1. We conclude that the difference of up to one order of magnitude that can be found in the literature regarding only results from the fact that assuming leads to overestimate by about a factor of ten. The present work thus reconciles previous contrasting reports about RBC membrane viscosity, and provides a range of values for which is in excellent quantitative agreement with the result of Tran-Son-Tay et al. Tran . Moreover, we have demonstrated that measuring as a function of flow strength provides valuable information not only on dissipation, but also on the elastic response of RBCs, and is sensitive to elasticity alterations such as those caused by diamide. This type of experimental investigations, analysed within the proposed framework, should therefore prove to be useful in discriminating how physical or biological factors may affect red blood cell elasticity or viscosity.
VII Acknowledgments
We acknowledge financial support from CNES (Centre National d’Etudes Spatiales), ESA (European Space Agency), and Université Franco-Allemande, Collège doctoral “Liquides Vivants” (AF).
References
- (1) Baskurt, O. K., and H. J. Meiselman, 2003. Blood rheology and hemodynamics. Semin. Thromb. Hemost. 29:435–503.
- (2) Fedosov, D. A., W. Pan, B. Caswell, G. Gompper, and E. Karniadakis, 2011. Predicting human blood viscosity in silico. P. Natl. Acad. Sci. USA 108:11772–11777.
- (3) Fedosov, D. A., H. Nogushi, and G. Gompper, 2014. Multiscale modeling of blood flow: from single cells to blood rheology. Biomech. Model. Mechanobiol. 13:239–258.
- (4) Ghigliotti, G., T. Biben, and C. Misbah, 2010. Rheology of a dilute two-dimensional suspension of vesicles. J. Fluid. Mech. 653:489–518.
- (5) Chien, S., 1987. Red cell deformability and its relevance to blood flow. Ann. Rev. Physiol. 49:177–192.
- (6) Hochmuth, R. M., and R. E. Waugh, 1987. Erythrocyte membrane elasticity and viscosity. Ann. Rev. Physiol. 49:209–219.
- (7) Kim, Y., K. Kim, and Y. Park, 2012. Measurement techniques for red blood cell deformability: recent advances. In T. E. Moschandreou, editor, Blood cell - An overview of studies in hematology, 167–194. Intech.
- (8) Betz, T., M. Lenz, J. F. Joanny, and C. Sykes, 2009. ATP-dependent mechanics of red blood cells. P. Natl. Acad. Sci. USA 106:15320–15325.
- (9) Fedosov, D. A., B. Caswell, and G. E. Karniadakis, 2010. A multiscale red blood cell model with accurate mechanics, rheology, and dynamics. Biophys. J. 98:2215–2225.
- (10) Li, J., G. Lykotrafitis, M. Dao, and S. Suresh, 2007. Cytoskeletal dynamics of human erythrocyte. P. Natl. Acad. Sci. USA 104:4937–4942.
- (11) Peng, Z., X. Li, I. Pivkin, M. Dao, and S. Karniadakis, G. E.and Suresh, 2013. Lipid bilayer and cytoskeletal interactions in a red blood cell. P. Natl. Acad. Sci. USA 110:13356–13361.
- (12) Dimitrakopoulos, P., 2012. Analysis of the variation in the determination of the shear modulus of the erythrocyte membrane: effects of the constitutive law and membrane modeling. Phys. Rev. E 85:041917.
- (13) Mohandas, N., and P. G. Gallagher, 2008. Red cell membrane: past, present and future. Blood 112:3939–3948.
- (14) Kwan, J. M., Q. Guo, D. L. Kyluik-Price, H. Ma, and M. D. Scott, 2013. Microfluidic analysis of cellular deformability of normal and oxydatively damaged red blood cells. Am. J. Hematol. 88:682–689.
- (15) Tomaiuolo, G., and S. Guido, 2011. Start-up shape dynamics of red blood cells in microcapillary flow. Microvasc. Res. 82:35–41.
- (16) Tomaiuolo, G., M. Barra, V. Preziosi, A. Cassinese, B. Rotoli, and S. Guido, 2011. Microfluidics analysis of red blood cell membrane viscoelasticity. Lab Chip 11:449–454.
- (17) Secomb, T. W., R. Skalak, N. Ozkaya, and J. F. Gross, 1986. Flow of axisymetric red blood cells in narrow capillaries. J. Fluid. Mech. 163:405–423.
- (18) Secomb, T. W., and Hsu, 1996. Analysis of red blood cell motion through cylindrical micropores: effects of cell properties. Biophys. J. 71:1095–1101.
- (19) Fedosov, D. A., M. Peltonmäki, and G. Gompper, 2014. Deformation and dynamics of red blood cells in flow through cylindrical microchannels. Soft Matter 10:4258–4267.
- (20) Kaoui, B., J. Harting, and C. Misbah, 2011. Two-dimensional vesicle dynamics under shear flow: effect of confinement. Phys. Rev. E 83:066319.
- (21) Thiébaud, M., Z. Shen, J. Harting, and C. Misbah, 2014. Prediction of anomalous blood viscosity in confined shear flow. Phys. Rev. Lett. 112:238304.
- (22) Forsyth, A. M., J. Wan, W. D. Ristenpart, and H. A. Stone, 2010. The dynamic behavior of chemically “stiffened” red blood cells in microchannel flows. Microvasc. Res. 80:37–43.
- (23) Rosenbluth, M. J., W. A. Lam, and D. A. Fletcher, 2008. Analyzing cell mechanics in hematologic diseases with microfluidic biophysical flow cytometry. Lab Chip 8:1062–1070.
- (24) Shevkoplyas, S. S., T. Yoshida, S. C. Gifford, and M. W. Bitensky, 2006. Direct measurement of the impact of impaired erythrocyte deformability on microvascular network perfusion in a microfluidic device. Lab Chip 6:914–920.
- (25) Hou, H. W., A. A. S. Bhagat, A. G. L. Chong, P. Mao, K. S. W. Tan, J. Han, and C. T. Lim, 2010. Deformability based cell margination-A simple microfluidic design for malaria-infected erythrocyte separation. Lab Chip 10:2605–2613.
- (26) Hochmuth, R. M., P. R. Worthy, and E. A. Evans, 1979. Red-cell extensional recovery and the determination of membrane viscosity. Biophys. J. 26:101–114.
- (27) Baskurt, O. K., and H. J. Meiselman, 1996. Determination of red blood cell shape recovery time constant in a Couette system by the analysis of light reflectance and ektacytometry. Biorheology 33:489–503.
- (28) Bronkhorst, P. J. H., G. J. Streekstra, J. Grimbergen, E. J. Nijhof, J. J. Sixma, and G. J. Brakenhoff, 1995. A new method to study shape recovery of red blood cells using multiple optical trapping. Biophys. J. 69:1666–1673.
- (29) Braunmüller, S., L. Schmid, E. Sackmann, and T. Franke, 2012. Hydrodynamic deformation reveals two coupled modes/time scales of red blood cell relaxation. Soft Matter 8:11240–11248.
- (30) Evans, E. A., and R. M. Hochmuth, 1976. Membrane viscoelasticity. Biophys. J. 16:1–11.
- (31) Chien, S., K.-L. P. Sung, R. Skalak, and S. Usami, 1978. Theoretical and experimental studies on viscoelastic properties of erythrocyte membrane. Biophys. J. 24:463–487.
- (32) Tran-Son-Tay, R., S. P. Sutera, and P. R. Rao, 1984. Determination Of Red Blood Cell Membrane Viscosity From Rheoscopic Observations Of Tank-Treading Motion. Biophys. J. 46:65–72.
- (33) Riquelme, B. D., J. R. Valverde, and R. J. Rasia, 2000. Determination of the complex viscoelastic parameters of human red blood cells by laser diffractometry. In Optical diagnostics of biological fluids, volume 3923, 132–140. Proceedings of SPIE, San Jose.
- (34) Fischer, T. M., 2007. Tank-treading frequency of the red cell membrane: dependence on the viscosity of the suspending medium. Biophys. J. 93:2553–2561.
- (35) Secomb, T. W., B. Styp-Rekowska, and A. R. Pries, 2007. Two-dimensional simulation of red blood cell deformation and lateral migration in microvessels. Ann. Biomed. Eng. 35:755–765.
- (36) Misbah, C., 2006. Vacillating Breathing and Tumbling of Vesicles under Shear Flow. Phys. Rev. Lett. 96:028104.
- (37) Danker, G., T. Biben, T. Podgorski, C. Verdier, and C. Misbah, 2007. Dynamics and rheology of a dilute suspension of vesicles: Higher-order theory. Phys. Rev. E 76:041905.
- (38) Vlahovska, P. M., and R. Serral Gracia, 2007. Dynamics of a viscous vesicle in linear flows. Phys. Rev. E 75:016313.
- (39) Lebedev, V. V., K. S. Turitsyn, and S. S. Vergeles, 2008. Nearly spherical vesicles in an external flow. New J. Phys. 10:043044.
- (40) Vlahovska, P. M., Y. N. Young, G. Danker, and C. Misbah, 2011. Dynamics of a non-spherical microcapsule with incompressible interface in shear flow. J. Fluid Mech. 678:221–247.
- (41) Danker, G., P. M. Vlahovska, and C. Misbah, 2009. Vesicles in Poiseuille Flow. Phys. Rev. Lett. 102:148102.
- (42) Coupier, G., A. Farutin, C. Minetti, T. Podgorski, and C. Misbah, 2012. Shape Diagram of Vesicles in Poiseuille Flow. Phys. Rev. Lett. 108:178106.
- (43) Biben, T., A. Farutin, and C. Misbah, 2011. Three-dimensional vesicles under shear flow: Numerical study of dynamics and phase diagram. Phys. Rev. E 83:031921.
- (44) Farutin, A., T. Biben, and C. Misbah, 2014. 3D numerical simulations of vesicle and inextensible capsule dynamics. J. Comp. Phys. in press.
- (45) Mills, J. P., L. Qie, M. Dao, C. T. Lim, and S. Suresh, 2004. Nonlinear Elastic and Viscoelastic Deformation of the Human Red Blood Cell with Optical Tweezers. Mechanics and chemistry of biosystems 1:169–180.
- (46) Skalak, R., and P. I. Branemark, 1969. Deformation of Red Blood Cells in Capillaries. Science 164:717–719.
- (47) Secomb, T. W., and R. Skalak, 1982. A two-dimensional model for capillary flow of an asymmetric cell. Microvasc. Res. 24:194–203.
- (48) Kaoui, B., G. Biros, and C. Misbah, 2009. Why do red blood cell have asymmetric shapes even in a symmetric flow? Phys. Rev. Lett. 103:188101.
- (49) Hénon, S., G. Lenormand, A. Richert, and F. Gallet, 1999. A new determination of the shear modulus of the human erythrocyte membrane using optical tweezers. Biophys. J. 76:1145–1151.
- (50) Fischer, T. M., C. W. M. Haest, M. Stöhr, D. Kamp, and B. Deuticke, 1978. Selective alteration of erythrocyte deformability by SH-reagents. Evidence for an involvement of spectrin in membrane shear elasticity. Biochim. Biophys. Acta 510:270–282.
- (51) Johnson, G. J., D. W. Allen, T. P. Flynn, B. Finkel, and J. G. White, 1980. Decreased survival in vivo of diamide-incubated dog erythrocytes. A model of oxidant-induced hemolysis. J. Clin. Invest. 66:9556961.
- (52) Rodrigues, R. O., V. Faustino, E. Pinto, D. Pinho, and R. Lima, 2013. Red Blood Cells deformability index assessment in a hyperbolic microchannel: the diamide and glutaraldehyde effect. WebmedCentral Biomed. Eng. 4:WMC004375.
- (53) Shin, S., Y. Ku, M. Park, and J. Suh, 2005. Disposable Biosensor for Measuring Red Blood Cell Deformability using Laser-Diffraction Technique. In Biomedical Applications of Micro- and Nanoengineering II, volume 5651, 68–77. Proceedings of SPIE, Bellingham.