Imitation versus payoff - duality of the decision-making process demonstrates criticality and consensus formation
Abstract
We consider a dual model of decision making, in which an individual forms its opinion based on contrasting mechanisms of imitation and rational calculation. The decision making model (DMM) implements imitating behavior by means of a network of coupled two-state master equations that undergoes a phase transition at a critical value of a control parameter. The evolutionary spatial game (EGM), being a generalization of the Prisoner’s dilemma game, is used to determine in objective fashion the cooperative or anti-cooperative strategy adopted by individuals. Interactions between two sources of dynamics increases the domain of initial states attracted to phase transition dynamics beyond that of the DMM network in isolation. Additionally, on average the influence of the DMM on the game increases the final observed fraction of cooperators in the system.
pacs:
02.50.Le, 89.75.Da, 02.50.Ey, 05.50.+qI Introduction
In a society interconnected by family ties, friendships, acquaintances or work relations it is unavoidable that a person’s behavior or decisions depends on the choices made by other people. The surrounding social network influences the opinions we hold, the products we buy or the activities we pursue. Therefore exploring the basic principles that give rise to social processes in which individual behavior aggregates into collective outcomes can provide significant insight into the individual’s decision-making process.
Human performance with regard to decision-making can be viewed from at least two complementary perspectives. One is from the assumptions made about how individuals behave and to predict the outcomes of their interactions at a group level. This outlines a mechanistic approach to the study of decision-making. The predictions based on this approach are tested by comparing them with observational data of how individuals behave in response to other individuals and to the environment. In this way the mechanisms through which collective behavior is generated are determined. At the turn of the twentieth century Tarde tarde98 argued that imitation was the fundamental mechanism by which the phenomena of crowds, fads, fashions and crime, as well as other collective behaviors, could be understood. At the same time, Baldwin baldwin97 maintained that the behavior based on imitation arose out of the mental development of the child resulting from imitation being a basic form of learning.
Currently, imitation remains an important concept in the social sciences, being pointed to as a mechanism responsible for herding, information cascades banerjee92 or many homophily-based behaviors christakis09 . Social experiments such as the Friends and Family study petland2011 demonstrated higher efficiency of incentives directed at the social network of an individual rather than directly offered to a person, suggesting strong influence that the actions of our peers have on our own decisions petland2013 . Similarly, coping proved to be the preferred and most effective strategy to acquire adaptive behavior in complex environment randel2010 , even when other non-social sources of information were available at the same cost.
This mechanistic approach to decision-making is separate and distinct from the functional approach, in which we ask what is the value or function of a particular behavioral strategy. The basic assumption of the second approach is that a given behavior can be rationally evaluated in terms of costs and benefits, which allows for an objective comparison of alternative strategies. This principle of balancing costs against benefits to arrive at a decision is central to modern economical becker , political politics and social science social .
In mathematical terms the functional approach aligns with the basic assumptions of game theory, which originated from games of chance. Game theory influenced behavioral sciences through the introduction of the utility function by Daniel Bernoulli in 1730 bernoulli30 . In doing so Bernoulli resolved the famous St. Petersburg paradox shlesinger87 , demonstrating that a rational strategy should be based on the subjective desirability of a game’s outcome rather than being proportional to the game’s expected value. The suggestion that the value of a thing to an individual is not simply equivalent to its monetary value reached its full articulation in the voices of von Neumann and Morgenstern vonneumann53 in their seminal work on game theory and economics.
More recently game theory was used to study the emergence of cooperative behaviors, as a way of obtaining insight into this evolutionary puzzling phenomena. The work of Nowak and May nowak92 for the first time extended game theory principles to spatial networks, and demonstrated that the introduction of spatial structure between players lead to spatially and temporally rich dynamics. Following this observation, the impact of the spatial structure on the evolution of cooperation has been investigated in detail nowak93 ; huberman93 ; Killingback96 ; szabo1998 ; szabo2007 . Contrary to the well-mixed case, where non-cooperative behavior is favored, the well-known Prisoner’s Dilemma game performed on a square lattice with next-nearest-neighbor interactions promotes cooperation. In the effort to investigate the impact of different interaction topologies, heterogenous topologies were investigated more recently, with scale-free architecture being the most extensively studied santos2005 ; santos2006 .
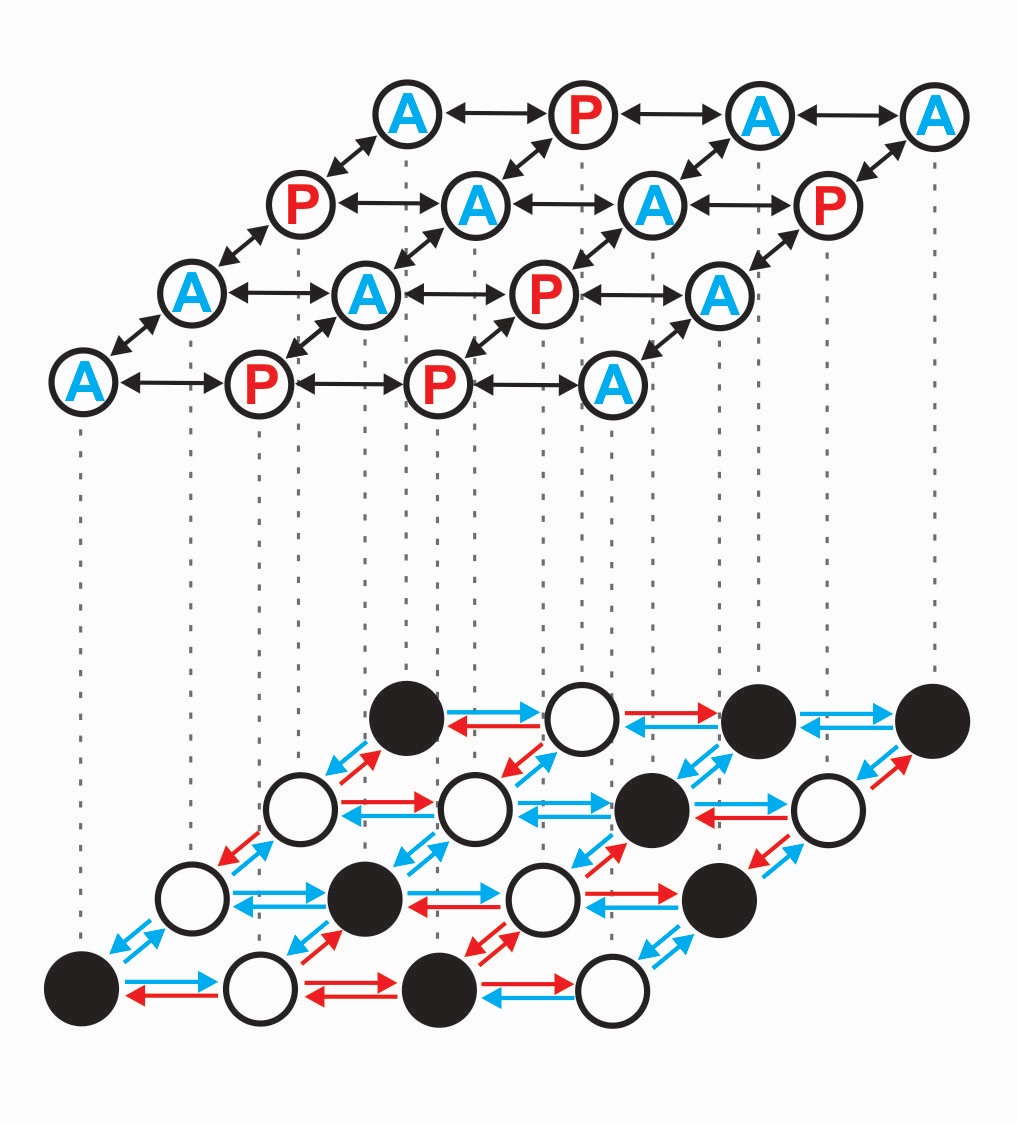
Herein we explore both mechanistic and functional perspectives as a way to understand the decision-making process. We consider a society to be given by a two-layer network, whose elements are individuals making decisions simultaneously using two distinct sets of criteria, as indicated in Fig. 1. On the one hand, individuals form their decisions based on the perception of actions and appearances of their neighbors, adopting the concept of imitation. This behavior, captured by the decision making model (DMM) turalska09 ; turalska11 demonstrates the cooperative behavior induced by the critical dynamics associated with a phase transition. This behavior is counterbalanced by the rationality of the evolutionary game model (EGM). Thus, while personal decisions are influenced by the desire to be liked and accepted, individuals also weigh the effect of certain potential relations on their careers, balancing the cost and payoffs of such relations. This latter behavior is captured by the rational and deterministic EGM rules in the spirit of the original approach of Nowak and May nowak92 . Thus, the adopted two-layer network model allows us to refer to two aspects of the decision-making process of a single individual, each aspect being defined by distinct dynamic rules. The two layers interact with one another and modify their separate dynamics.
In Section II we review the basic properties of the DMM network in isolation, that is, not interacting with the second network. The phase transition properties of the DMM network for different interaction strengths are briefly discussed. In Section III we outline the basic properties of the EGM network in isolation. In this case the traditional game theory final states are identified. Finally, in Section IV the two functionally distinct networks are allowed to interact with one another and the difference in the asymptotic states due to their mutual interaction are analyzed and discussed. We draw some conclusions in Section V.
II Isolated DMM Layer
In the DMM network the state of an isolated individual is described by a two-state master equation,
| (1) |
where is a transition matrix:
| (2) |
and the probability of being in one of two states , is . Positioning such individuals at the nodes of a square lattice yields a system of coupled two-state master equations turalska09 ; bianco08 which, under the assumption of nearest neighbor interactions, contain time-dependent transition rates for each of the individuals:
| (3) |
where is the strength of the interaction. On the two-dimensional lattice and denotes the count of nearest neighbors in states at time . In the mean field approximation and the transition rates become exponentially dependent on the state probabilities resulting in a highly nonlinear master equation west14 .
A wealth of results exist for the dynamics of DMM on networks of various topologies, in a configuration of a single network, as well as in the case of coupled networks west14 . Here we concentrate on the global behavior of the model, which is defined by the fluctuations of the global variable
| (4) |
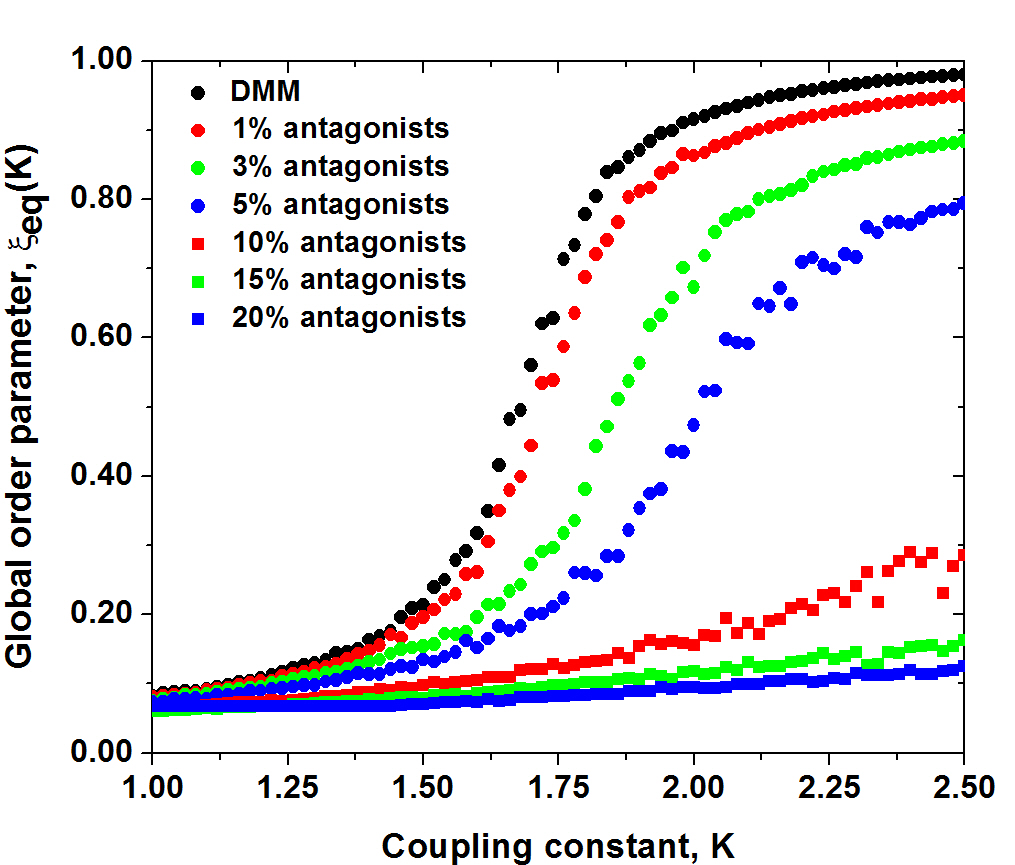
which is further used to calculate the equilibrium global value When the coupling parameter , single units of the system become more and more cooperative and for coupling value larger than a critical one, , the interaction between units is strong enough to give rise to a majority state, during which a significant number of nodes adopts the same opinion at the same time. Thus, the global dynamics of the DMM is characterized by a phase transition with respect to the coupling parameter (Fig. 2), demonstrating that a system of identical units imitating each other’s actions is able to reach consensus, given sufficient influence of the imitation on their decisions.
However, this model society in which all members are interacting only through positive relationships (friendships, collaborations or sharing of information) is not very realistic, since negative effects are also present in most circumstances. Some relationships are friendly, while others are antagonistic or even hostile and interactions between people often lead to disagreement and conflict. Thus, there is a need to modify the basic DMM to include a mix of positive and negative relationships.
Rather than define the nature of the relationship between two nodes, which is usually done by introducing links with positive (reciprocal friendship) and negative (mutual antagonism) signs kleinberg10 , we consider a network in which the nature of the interaction between individuals depends on the individuals themselves. Thus, our modeled society is composed of two kinds of individuals: those that always cooperate (protagonists) and those that always oppose the opinion of their peers (antagonists). As a result we observe three kinds of interaction between two nodes: reciprocal friendship and mutual antagonism, as well as cooperator-antagonist pairs, in which one node wants to cooperate while another opposes any kind of mutual action.
On the one hand cooperating individuals operate according to the DMM dynamics defined in Eq. 3. On the other hand, antagonists at any time oppose the opinion of their neighbors, and their dynamics are defined by the transition rates
| (5) |
where the only difference with respect to the dynamics of protagonists is an opposite sign of the coupling constant.
All numerical calculations in this section are performed on a square lattice of nodes with periodic boundary conditions. The initial state of each individual is randomly assigned. In a single time step a computer calculation involving the entire lattice is performed and for every element the transition rate of either Eq. 3 or Eq. 5 is calculated, according to which element is given the possibility to change its state. The transition rate for a non-interacting unit is . The equilibrium value is calculated as an average over consecutive time steps, after the same number of time steps since the initialization has passed thereby insuring that all transient behavior has died away. The assignment of protagonist and antagonist behavior is done randomly.
The dynamics of the DMM lattice with increasing numbers of antagonists is depicted on Figure 2. It is evident from the figure that the phase transition the DMM dynamics undergoes is sensitive to the fraction of the network members that are antagonists. The DMM lattice dynamics undergoes a phase transition and this criticality persists with up to 5% antagonists randomly placed on the lattice. However, the phase transition is clearly suppressed when the number of antagonists is 10% and above. These results are consistent with those determining the influence of committed minorities on group consensus xie11 ; turalska13 .
III Isolated EGM layer
The evolutionary game model (EGM) used herein is a generalization of the Prisoners’ Dilemma (PD) game. Traditionally the PD game consists of two players, each of whom may choose to cooperate or defect in any single encounter. If both players choose to cooperate, both get a reward pay-off of size ; if one defects and the other cooperates the defector receives a ”temptation” pay-off while the cooperator receives a ”sucker’s” pay-off ; if both defect, both receive ”punishment” pay-off . The ordering of the payoff parameters given by defines the PD game. Nowak and May nowak92 considered a two-dimensional lattice over which the PD game was played in a sequential fashion, where at each time step every node was able to change its strategy (defect or cooperate) depending on the outcome of the game played with its neighbors at the previous time step. The historical nomenclature of cooperator and defector is here replaced with protagonist and antagonist, respectively, which we believe to be more compatible with the language of the two-layer network model.
Consider the EGM network dynamics without it being coupled to the DMM network dynamics. As depicted on the top part of Figure 1, the protagonists and antagonists are placed on the sites of a two-dimensional lattice and interact only with their four nearest neighbors. In each generation every individual plays a deterministic game defined by a pay-off matrix with all its neighbors. The pay-off gained by each individual at the end of each generation is determined by summing payoffs of games with each of its neighbors. The scores in the neighborhood, including the individual’s own score are ranked, and in the following generation the individual adopts the strategy of the most successful player from among its neighbors. In the case of a tie between the scores of cooperative and antagonistic players, the individual keeps its original strategy. Thus, adopted evolutionary strategy is to act like the most successful neighbor.
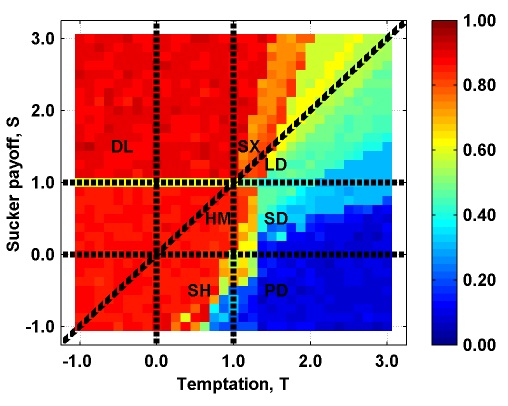
Even this simple and completely deterministic situation leads to a wide array of behaviors. Figure 3 depicts the equilibrium fraction of protagonists present in the EGM game as a function of the two parameters and . Without loss of generality, we assume that and normalize the pay-off values such that and . The initial configuration of the game consists of 50% protagonists and antagonists, distributed randomly on the lattice.
It is evident that in the domain for almost all values of that the equilibrium state is dominated by protagonists. These regions are determined to have between 5% and 10% randomly distributed antagonists asymptotically. Whereas for and the region of the PD game, antagonists dominate with the network having between 5% and 10% randomly distributed protagonists. The remaining regions have differing levels of protagonists at equilibrium. The traditional games for which there is a substantial literature are marked and are not addressed here in more detail. We merely note that selected parameter values enable us to determine the outcome for the two-layer network and thereby determine the mutual influence of the DMM and EGM dynamics and the relative influences of imitation and payoff on decision making in all these cases.
IV Two-layer Network
The constant struggle between maximizing individual gains and the desire to be part of a community is modeled by an interaction between EGM and DMM layers (Fig. 1). The coupling is realized dynamically, since the behavior of a node in the DMM layer depends on its strategy in the EGM layer, being protagonist or antagonist. In return the local configuration of nodes in the DMM layer can change the strategy of a node in the EGM layer.
More precisely, each time step of the simulation consists of four operations:
-
1.
One step of the EGM dynamics is realized in the EGM layer. The pay-off for each individual is evaluated and used to update its strategy in the next generation.
-
2.
The following generation of protagonists and antagonists is used to define the sign of a coupling constant in the DMM layer. Consequently, a node in the DMM layer may be a protagonist at one time step, while in the next it acts as an antagonist, due to the changes made to the EGM layer.
-
3.
One step of the DMM dynamics is performed in the DMM layer, allowing nodes to change their state from to , or not change at all. This step potentially affects the local neighborhood of an individual, when at one time step an individual is surrounded by mostly other individuals of the same sign, and in the next time step it is surrounded by individuals of opposite sign.
-
4.
A change to the DMM layer finally affects the strategy of an individual in the EGM layer. The decision to change strategy in the EGM layer is made if the average state of the local neighborhood of an individual in the DMM layer is of an opposite sign with respect to that individual.
After those four steps, one full iteration of the two-layer network is completed, and the time index is advanced.
Figure 4 summarizes the asymptotic dynamics of the two-layer network for a broad set of and values. The color at each value of and is determined as the ratio of the final fraction of protagonists observed in the DMM-EGM network to the fraction of protagonists observed in the EGM network in isolation:
| (6) |
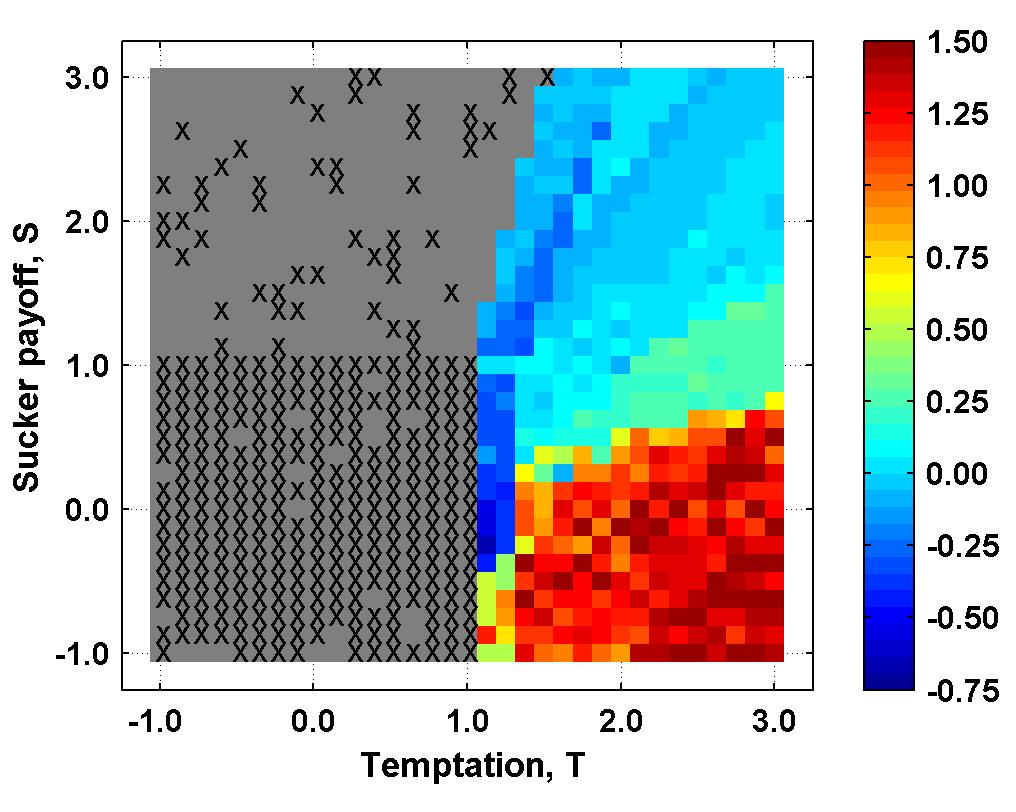
The large grey area depicts the range of parameter values whose DMM-EGM network dynamics give rise to phase transition. The initial fraction of 50% protagonists increases with the phase transition to a final state of complete consensus among protagonists. The symbol X depicts values for which the fraction of protagonists in the isolated EGM network is smaller then and consequently if the DMM were operating in isolation on such a configuration of protagonists and antagonists, the phase transition would be strongly suppressed. However the coupling of DMM-EGM networks facilitates the critical transition at these values.
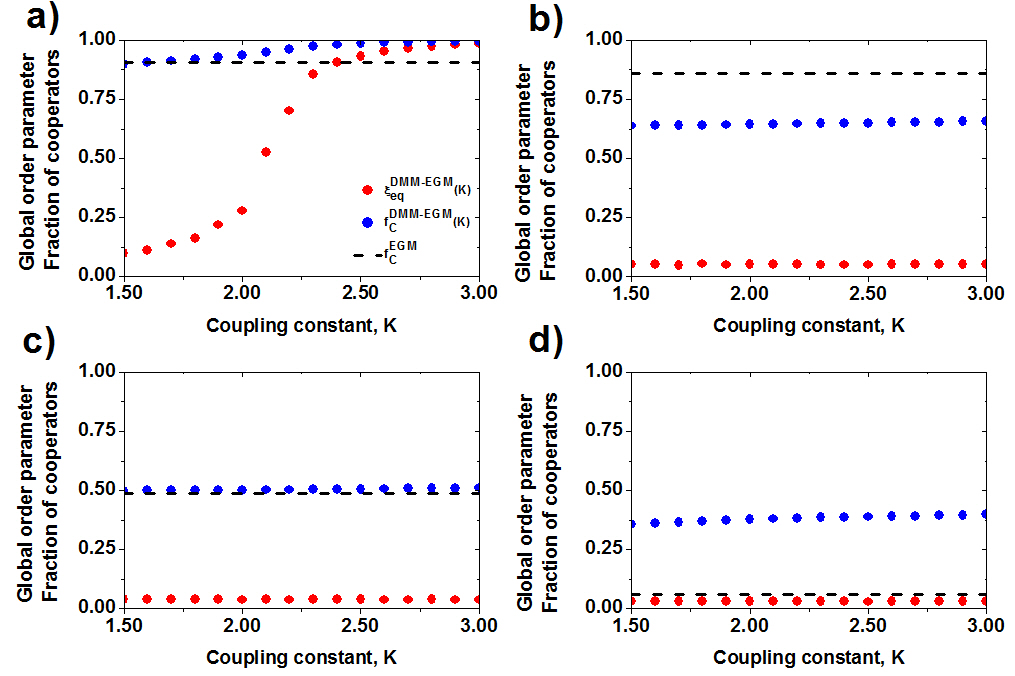
The remaining regions do not undergo phase transition, but do show a wide range of dynamic behaviors. Four types of typical dynamics for the two-layer DMM-EGM network can be determined. For each of the panels in Figure 5 the DMM-EGM network was initialized with 50% antagonists randomly distributed. Such an initial state is sufficient to suppress a phase transition for the DMM in isolation (Fig. 2).
However in Figure 5a, as the control parameter is increased, the average global variable of the DMM layer in the DMM-EGM network manifests critical behavior. Simultaneously, the 10% antagonists seen in isolated EGM layer change their strategy and are converted to protagonists in the DMM-EGM network. For reference the dashed curve shows the fraction of protagonists in the isolated EGM network.
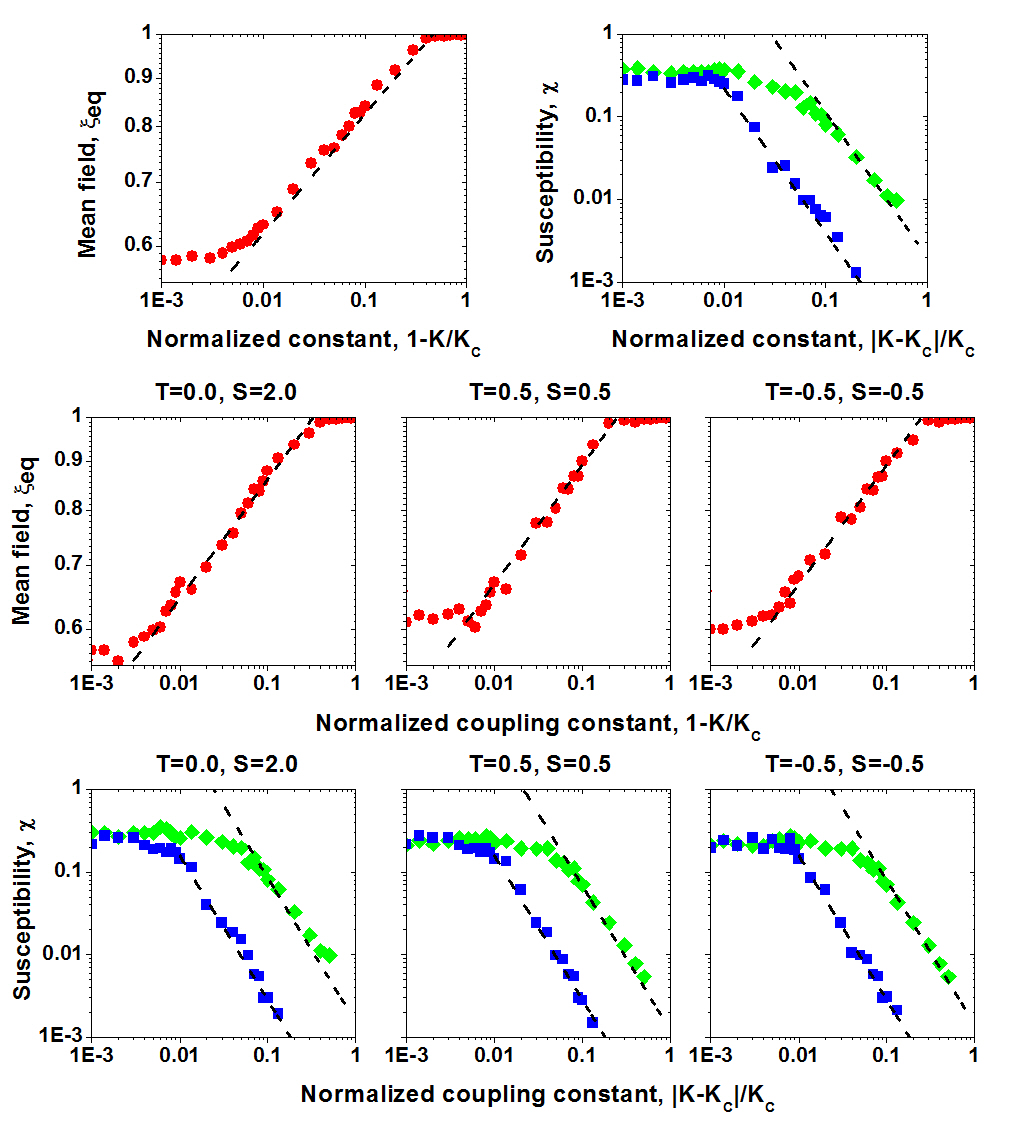
We demonstrated in our earlier work turalska13 that the global dynamics of the DMM belongs to the Ising universality class. The investigation of the scaling properties of the global order parameter and the susceptibility confirms that property also for the dual-layer dynamics. Despite the relatively small size of the system, a lattice of x nodes, on which the DMM dynamics is realized in the isolated layer configuration, the values of the mean field and susceptibility in the vicinity of the phase transition point scale as a power law (Fig. 6 top row). When coupled to the EGM layer, the scaling behavior and exponents are preserved (Fig. 6), suggesting that a very small fraction of antagonists present in the system does not cause a significant change in dynamical properties of the system.
Figure 5c depicts representative behavior of the DMM-EGM dynamics for values from the upper right quadrant of Fig. 3: . Here the fraction of protagonists is typically the same as that of the isolated EGM (the pale blue region of Fig. 4). Figure 5b is taken from a narrow transition channel parallel to in which the fraction of protagonists in the dual network is typically below that of the isolated EGM network, indicating a marked change in behavior for small increases in temptation. Across this channel the arrangement of the payoff matrix converts the behavior of the social group from being cooperative and consensus seeking to being antagonistic and disagreeable. Once in this region of and the domain of the PD game, the fraction of protagonists can be greater than that of the isolated EGM (Fig. 5d) and still not produce a phase transition and therefore the group does not reach consensus.
The DMM-EGM network dynamics is depicted using the global variable for a subcritical and a supercritical value of the control parameter at selected values of the sucker payoff and temptation in Figure 7a. In the subcritical case the DMM-EGM network dynamics are seen to be random. The global variable time series have large scale fluctuations for and , with much more rapid large amplitude fluctuations in the positive temptation regions. In the supercritical region the DMM-EGM network transitions to consensus for are characterized by a very low amplitude fluctuations once consensus is achieved. However in the other regions the value of the control parameter seems to be irrelevant and large amplitude fluctuations of are observed.
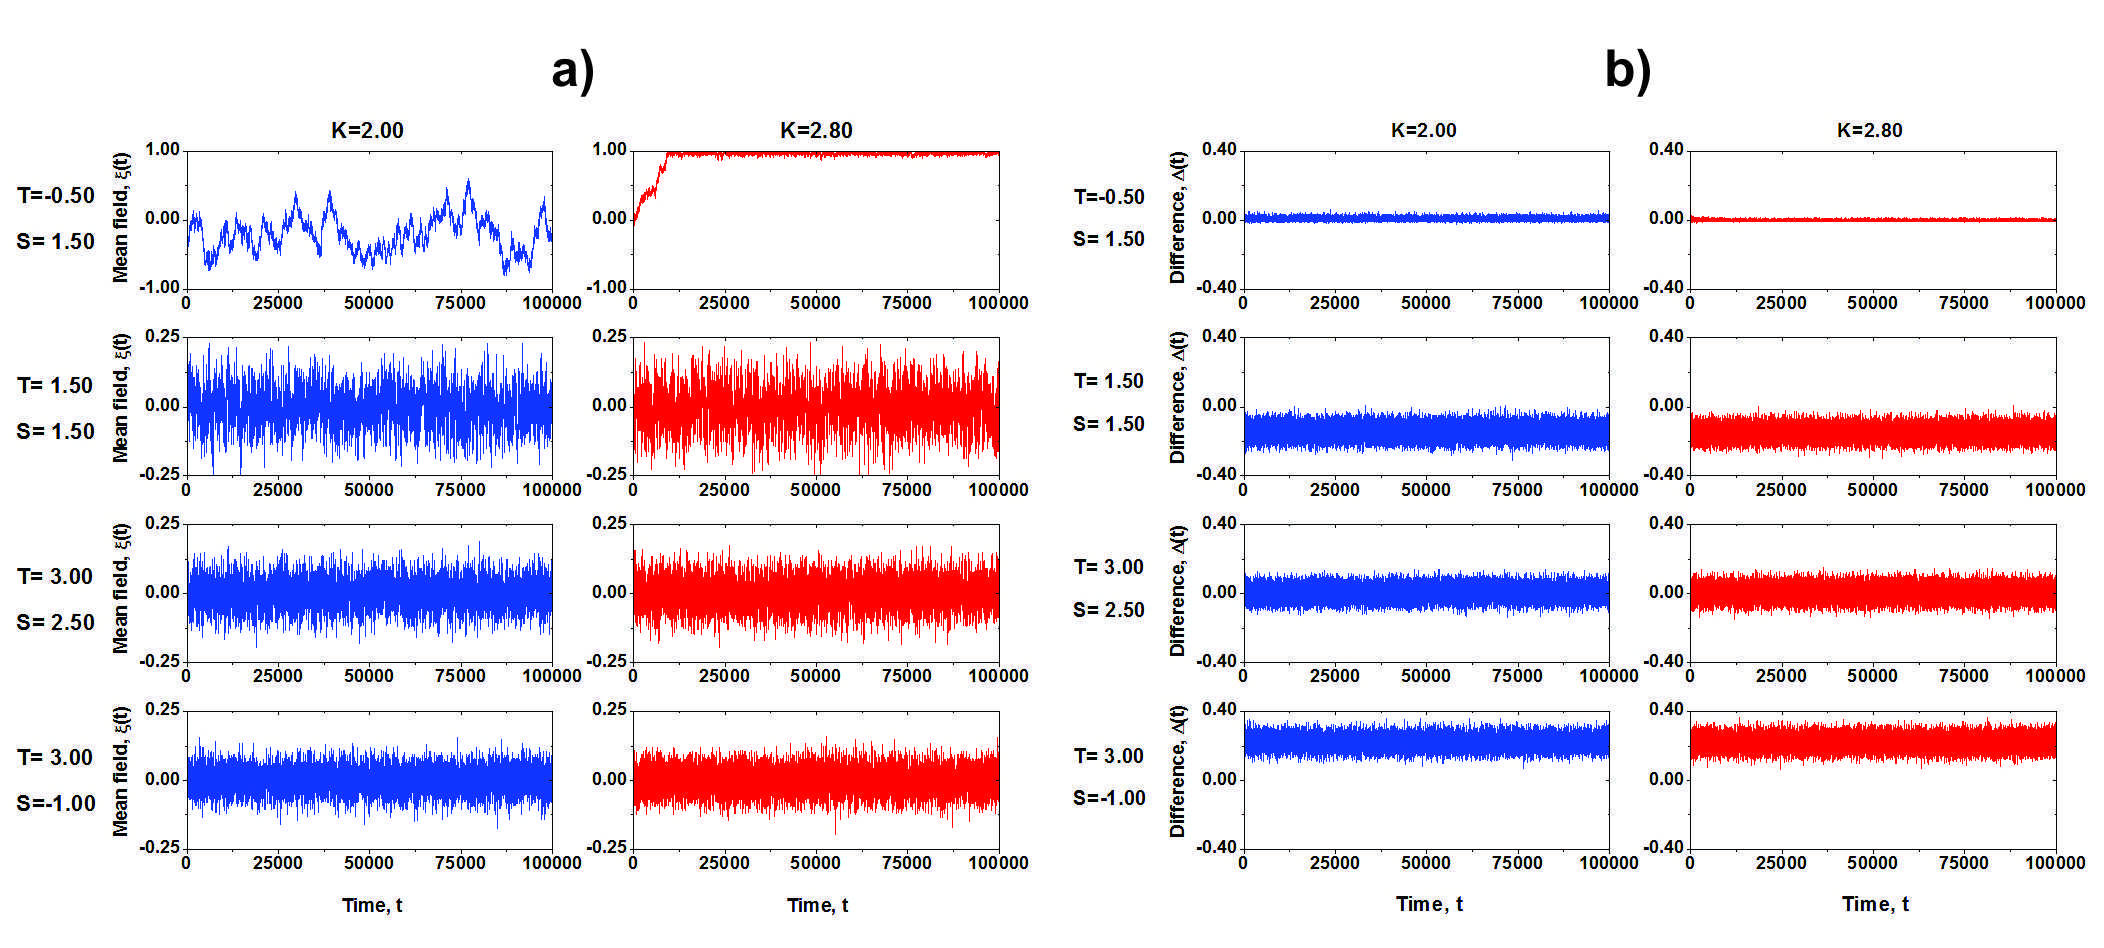
Another way to view the dynamics of the coupled DMM-EGM network is to record the difference in the number of changes inflicted by the DMM layer on the EGM layer and the number of changes inflicted by the EGM layer on the DMM layer at each time step. Thus, it is the difference in the number of changes performed at the second and fourth step of the simulation. The time series recorded in Figure 7b have the same parameter values as those depicted in Figure 7a. First we notice the insensitivity of the behavior of the time series to the value of the dynamics. Next is the balance in the two kinds of change apparent for negative temptation with relatively low amplitude fluctuations. Whether there are more changes projected from the DMM or EGM layer to the complementary layer varies with the and values. For example at the two changes are equal for and DMM exceeds EGM changes at with relatively large fluctuations in both cases. This suggests that four regions of dynamics of DMM-EGM network, identified on Fig. 5 are characterized by the balance between the DMM and EGM layer in the case that presents phase transition, and an imbalance between the two mechanisms of decision-making in other cases.
V Conclusion
We expect that the behavior present in the dual layer model is not limited to the regular lattice configuration discussed herein. The DMM demonstrates the cooperative behavior in a wide range of network topologies, where the phase transition is observed for both random, small-world and scale-free configurations turalskaDiss . Similarly, the cooperation based on the Prisoner’s Dilemma is present in heterogenous topologies gomes2007 . Additionally, recent experimental studies of the cooperation when humans play a Prisoner’s Dilemma demonstrate that both the regular lattice and a scale-free network reach the same level of cooperation, which is comparable with the level of cooperation of smaller homogeneous networks Moreno2012 ; Lazaro2012 .
In this paper we considered two dynamically coupled networks; the dynamics of one being determined by imitation using the DMM west14 and the other following the game theoretic format prescribed by Nowak and May nowak92 . We find that in the domain and all the protagonists asymptotically dominate and phase transition behavior is robust. Critical dynamics occurs in this region even when the initial fraction of antagonists would be sufficient to inhibit critical behavior for the DMM network in isolation. Consequently the EGM layer increases the domain of initial states attracted to critical dynamics for the two-layer network dynamics.
On the other hand, the influence of the EGM antagonists on the DMM-EGM network dynamics is quite different from that of committed minorities xie11 ; turalska13 , even when the committed minorities are modeled as a distinct dynamic network west14 . The EGM layer can actually increase the stability of the consensus-making process for the two-layer network model. Consequently, consensus can be facilitated by payoffs even in cases where intuition might dictate that antagonists would prevail. This suggests the possibility of counter-intuitive policies, which society might adopt, that could facilitate the consensus-making of large groups, even in the face of what might appear to be overwhelming polarization.
VI Acknowledgement
The authors would like to thank the Army Research Office for support of this research.
References
- (1) Tarde, M.G., Les Lois de l’Imitation (1890); La Logique sociale (1895); Les Lois socials (1898).
- (2) Baldwin, J.M., Mental Development in the Child and the Race (1895); Social and Ethical Interpretations in Mental Development (1897).
- (3) Banerjee, A.V., Quart. J. Econom. 107, 797-817 (1992).
- (4) Christakis, N.A., Fowler, J.H., Connected; The surprising power of our social networkds and how they shape our lives, Little, Brown and Co., New York (2009).
- (5) Aharony, N., Pan, W., Ip, C., Khayal, I., Pentland, A. Pervasive and Mobile Computing 7, 643-659 (2011).
- (6) Mani, A., Rahwan, I., Petland, A., Sci Rep 3, 1735, (2013).
- (7) Rendell, L., Boyd, R., Cownden, D., Enquist, M., Eriksson, K., Feldman, M.W., Fogarty, L., Ghiralnda, S., Lillicarp, T., Laland, K.N., Science, 328, 208 (2010).
- (8) Becker, G., The Economic Approach to Human Behavior. Univ of Chicago Press (1978).
- (9) Shepsle, K.A., Analyzing Politics: Rationality, Behavior and Institutions. W.W. Norton & Company (2010).
- (10) Hechter, M., Kanazawa, S., Annu. Rev. Sociol. 23, 191-214, (1997).
- (11) Bernoulli, D., Exposition of a new theory on the measurement of risk, translated by L. Sommer in Econometrica 22, 23 (1955); first published in Commentarii academiae scentiarum imperialis Petropolitanae 5, 175 (1730).
- (12) Shlesinger, M.F., West, B.J., Klafter, J., “Diffusion in a turbulent phase space”, in First International Congress of Physics of Phase Space, Eds. W. Zachary and Y. Kim, Springer-Verlag, Berlin (1987)
- (13) von Neumann, J., and Morgenstern, O., Theory of Games and Economic Behavior, Princeton University Press, Princeton, N.J. (1953).
- (14) Nowak M.A, May, R.M., Nature 359, 826 (1992).
- (15) Huberman, B., Glance, N. Proc Natl Acad Sci USA 90, 7716-7718 (1993).
- (16) Killingback, T., Doebli, M., Proc. R. Soc. Lond. B. 263, 1135-1144 (1996).
- (17) Szabo, G., Toke, C., Phys. Rev. E. 58, 69-73 (1998).
- (18) Szabo, G., Fath, G., Phys. Rep. 446, 97-216 (2007).
- (19) Nowak, M.A., May R. M., Int. J. Bifurcat. Chaos 3, 35-78 (1993).
- (20) Santos, F.C., Pacheco, J.M., Lenaerts, T., Proc. Natl. Acad. Sci. USA 103, 3490-3494 (2006).
- (21) Santos, F.C., Pacheco, J.M., Phys. Rev. Lett. 95, 098104 (2005).
- (22) Turalska, M., Lukovic, M., West, B.J., Grigolini, P., Phys. Rev. E 80, 021110 (2009).
- (23) Turalska, M., West B.J., Grigolini, P., Phys. Rev. E 83, 061142 (2011).
- (24) Bianco, S., Geneston, E., Grigolini, P., Ignaccolo, M., Phys. Rev. E 387, 1387 (2008).
- (25) West, B.J., Turalska, M., Grigolini, P., Network of Echoes; Imitation, Innovation and Invisible Leaders, Springer, Berlin (2014).
- (26) Easley, D., Kleinberg, J., Networks, Crowds and Markets. Reasoning about a Highly Connected World. Cambridge University Press, USA (2010).
- (27) Xie, J., Sreenivasan, S., Korniss, G., Zhang, W., Lim, C., Szymanski, B.K., Phys. Rev. 84, 011130 (2011).
- (28) Turalska, M., Grigolini, P., West, B.J., Sci. Rep. 3, 1 (2013).
- (29) Turalska, M.A., Temporal Properties Of Dynamic Processes On Complex Networks. Denton, Texas. UNT Digital Library. http://digital.library.unt.edu/ark:/67531/metadc103403/.
- (30) Gomez-Gardenes, J., Campillo, M., Floŕıa, Moreno, Y. Phys. Rev. Lett. 98, 108103 (2007).
- (31) Garcia-Lazaro, C., Ferrer, A. Ruiz, G., Tarancon, A., Cuesta J.A., Sanchez, A., Moreno, Y., Proc Natl Acad Sci USA, 109, 32, 12922-12926 (2012).
- (32) Garcia-Lazaro, A., Cuesta J.A., Sanchez, A., Moreno, Y., Sci. Rep. 2, 325, (2012).