The triggering of starbursts in low-mass galaxies
Abstract
Strong bursts of star formation in galaxies may be triggered either by internal or external mechanisms. We study the distribution and kinematics of the H I gas in the outer regions of 18 nearby starburst dwarf galaxies, that have accurate star-formation histories from HST observations of resolved stellar populations. We find that starburst dwarfs show a variety of H I morphologies, ranging from heavily disturbed H I distributions with major asymmetries, long filaments, and/or H I-stellar offsets, to lopsided H I distributions with minor asymmetries. We quantify the outer H I asymmetry for both our sample and a control sample of typical dwarf irregulars. Starburst dwarfs have more asymmetric outer H I morphologies than typical irregulars, suggesting that some external mechanism triggered the starburst. Moreover, galaxies hosting an old burst (100 Myr) have more symmetric H I morphologies than galaxies hosting a young one (100 Myr), indicating that the former ones probably had enough time to regularize their outer H I distribution since the onset of the burst. We also investigate the nearby environment of these starburst dwarfs and find that most of them (80) have at least one potential perturber at a projected distance 200 kpc. Our results suggest that the starburst is triggered either by past interactions/mergers between gas-rich dwarfs or by direct gas infall from the IGM.
keywords:
galaxies: dwarf – galaxies: irregular – galaxies: starburst – galaxies: interactions – galaxies: evolution – galaxies: kinematics and dynamics1 Introduction
The mechanisms that trigger strong bursts of star-formation in low-mass galaxies are poorly understood. Unlike spiral galaxies, gas-rich dwarfs usually do not have density waves and stellar bars, thus internal mechanisms such as bar-driven gas inflows are generally ruled out (e.g. Hunter & Elmegreen, 2004). Other internal mechanisms have been proposed, like torques due to massive star-forming clumps (Elmegreen et al., 2012), triaxial dark matter haloes (Bekki & Freeman, 2002), or bars made of dark matter (Hunter & Elmegreen, 2004). External mechanisms are also possible, like tidal perturbations from nearby companions (e.g. Noguchi, 1988), interactions/mergers between gas-rich dwarfs (e.g. Bekki, 2008), or cold gas accretion from the IGM (e.g. Silk et al., 1987). In particular, cosmological models predict that low-mass galaxies should accrete most of their gas through cold flows, reaching the central parts of the dark matter halo without being shock-heated to the virial temperature (e.g. Dekel & Birnboim, 2006). This process may still take place at in low-density environments (Kereš et al., 2005), thus isolated starburst dwarfs in the nearby Universe are prime locations to search for cold gas accretion.
In the literature, starburst dwarfs are referred to with several names, often related to the observational technique used to identify the starburst. Common names are (i) blue compact dwarfs (BCDs) as they have blue colors and high surface brightnesses (e.g. Gil de Paz et al., 2003); (ii) H II galaxies as they have integrated spectra with strong emission lines (e.g. Terlevich et al., 1991; Taylor et al., 1995); and (iii) amorphous dwarfs as they may have peculiar morphologies dominated by a few giant star-forming regions (e.g. Gallagher & Hunter, 1987; Marlowe et al., 1999). Hereafter we use the general term “starburst dwarfs” to indicate any low-mass galaxy experiencing an enhanced period of star-formation activity.
| Name | Alternative | R.A. | Dec. | Dist | 12+log(O/H) | Ref. | ||||
|---|---|---|---|---|---|---|---|---|---|---|
| Name | (J2000) | (J2000) | – (km s-1) – | (Mpc) | (mag) | (kpc) | ||||
| NGC 625 | ESO 297-G005 | 01 35 04.3 | -41 26 15 | 3986 | 305 | 3.90.4 | -17.250.24 | 3.3 | 8.080.12 | a, g, l |
| NGC 1569 | UGC 3056 | 04 30 49.0 | +64 50 53 | -8010 | 505 | 3.40.2 | -17.140.25 | 3.0 | 8.190.02 | a, h, m |
| NGC 1705 | ESO 158-G013 | 04 54 13.9 | -53 21 25 | 6352 | 7210 | 5.10.6 | -16.350.26 | 1.5 | 8.210.05 | b, i, l |
| NGC 2366 | UGC 3851 | 07 28 51.9 | +69 12 34 | 1031 | 496 | 3.20.4 | -16.640.27 | 4.4 | 7.910.05 | a, h, l |
| NGC 4068 | UGC 7047 | 12 04 02.7 | +52 35 28 | 2062 | 395 | 4.30.1 | -15.670.05 | 1.8 | … | a, h |
| NGC 4163 | UGC 7199 | 12 12 09.0 | +36 10 11 | 1584 | 105 | 3.00.1 | -14.810.10 | 1.0 | 7.560.14 | a, h, l |
| NGC 4214 | UGC 7278 | 12 15 38.8 | +36 19 39 | 2911 | 819 | 2.70.2 | -17.770.24 | 2.2 | 8.220.05 | a, h, l |
| NGC 4449 | UGC 7592 | 12 28 10.8 | +44 05 37 | 2105 | 355 | 4.20.5 | -18.880.26 | 3.3 | 8.260.09 | a, h, l |
| NGC 5253 | Haro 10 | 13 39 56.0 | -31 38 31 | 41010 | … | 3.50.4 | -17.610.27 | 2.1 | 8.120.05 | a, g, k |
| NGC 6789 | UGC 11425 | 19 16 41.9 | +63 58 17 | -1512 | 579 | 3.60.2 | -15.090.14 | 0.7 | … | a, i |
| UGC 4483 | … | 08 37 03.4 | +69 46 31 | 1582 | 192 | 3.20.2 | -12.970.19 | 0.6 | 7.560.03 | a, i, l |
| UGC 6456 | VII Zw 403 | 11 27 57.2 | +78 59 48 | -1024 | 105 | 4.30.1 | -14.410.05 | 1.2 | 7.690.01 | a, j, n |
| UGC 6541 | Mrk 178 | 11 33 28.9 | +49 14 22 | 2502 | … | 4.20.2 | -14.610.10 | 0.9 | 7.820.06 | c, j, l |
| UGC 9128 | DDO 187 | 14 15 56.8 | +23 03 22 | 1503 | 244 | 2.20.1 | -12.820.12 | 0.6 | 7.750.05 | a, h, l |
| UGCA 290 | Arp 211 | 12 37 22.1 | +38 44 41 | 4685 | … | 6.70.4 | -14.090.18 | 0.9 | … | d, i |
| I Zw 18 | Mrk 116 | 09 34 02.0 | +55 14 25 | 7674 | 384 | 18.21.4 | -14.990.26 | 0.5 | 7.200.01 | e, j, k |
| I Zw 36 | Mrk 209 | 12 26 16.8 | +48 29 39 | 2772 | 292 | 5.80.5 | -14.880.23 | 0.9 | 7.770.01 | f, i, k |
| SBS 1415+437 | … | 14 17 02.1 | +43 30 19 | 6162 | 182 | 13.61.4 | -15.900.25 | 2.4 | 7.620.03 | a, i, o |
Notes. The galaxy center is derived from -band or -band images, while the rotation velocity is measured at the outermost radius accessible by H I data at relatively high spatial resolutions (LVF14). Distances are derived from the tip of the red giant branch (TRGB). The optical radius is defined as 3.2 exponential scale-lengths. The last column provides references for the distance, the integrated photometry, and the ionized gas metallicity, respectively.
References. (a) McQuinn et al. (2010); (b) Annibali et al. (2003); (c) Schulte-Ladbeck et al. (2000); (d) Crone et al. (2002); (e) Annibali et al. (2013); (f) Schulte-Ladbeck et al. (2001); (g) Lauberts & Valentijn (1989); (h) Swaters & Balcells (2002); (i) Gil de Paz et al. (2003); (j) Papaderos et al. (2002); (k) Izotov & Thuan (1999); (l) Berg et al. (2012); (m) Kobulnicky & Skillman (1997); (n) Thuan & Izotov (2005); (o) Guseva et al. (2003).
In Lelli et al. (2014, hereafter LVF14), we studied the H I content of 18 starburst dwarfs and found that disturbed H I kinematics are more common in starburst dwarfs (50) than in typical star-forming irregulars (Irrs, 10). This may be related to the starburst trigger (interactions/mergers or disk instabilities), but may also be a consequence of feedback from supernovae and stellar winds, making it difficult to distinguish between different triggering mechanisms. About 50 of our starburst dwarfs, instead, have a regularly rotating H I disk that allows us to derive rotation curves and investigate the internal mass distribution. In Lelli et al. (2014), we found that the inner rotation curves of starburst dwarfs rise more steeply than those of typical Irrs (see also van Zee et al., 2001; Lelli et al., 2012a, b), suggesting that there is a close link between the intense star-formation activity and the shape of the gravitational potential. A central concentration of mass (gas, stars, and dark matter) seems to be a characterizing property of starburst dwarfs and must be tightly linked to the mechanism (either internal or external) that triggers the starburst (see Lelli et al., 2014, for an in-depth discussion).
Environmental studies also provide important clues about the triggering mechanism. In general, star-forming dwarfs tend to populate low-density environments (e.g. Iovino et al., 1988; Salzer, 1989; Telles & Maddox, 2000; Lee et al., 2000) and are not necessarily associated with bright galaxies (e.g. Campos-Aguilar & Moles, 1991; Campos-Aguilar et al., 1993; Telles & Terlevich, 1995; Pustilnik et al., 1995), suggesting that tidal interactions with massive companions are not the dominant starburst trigger. The possibility of interactions with low-luminosity, low-surface-brightness (LSB) galaxies, however, remains open (e.g. Méndez et al., 1999; Méndez & Esteban, 2000; Noeske et al., 2001; Pustilnik et al., 2001), given that these objects are usually under-represented in optical catalogs. Moreover, if the starburst is due to a past interaction/merger with a LSB dwarf, the resulting tidal features would have very low surface brightnesses and be difficult to unambiguously identify, unless deep optical imaging is available (e.g. López-Sánchez, 2010; Martínez-Delgado et al., 2012).
Alternatively, deep 21 cm-line observations can be used to search for gas-rich companions, infalling gas, or signatures of past interactions/mergers (e.g. Sancisi et al., 2008). Taylor et al. (1993); Taylor et al. (1995, 1996) obtained low-resolution Very Large Array (VLA) observations of 21 starburst dwarfs and 17 LSB dwarfs, and concluded that starburst dwarfs have nearby “H I companions” more than twice as often as LSB dwarfs. However, given the poor angular resolution of these observations, in most cases it was not possible to distinguish between actual H I companions and asymmetries in the outer H I distribution. Detailed studies of the H I gas in the outer regions of starburst dwarfs have been so far restricted to individual objects or small galaxy samples. These works have revealed that several starburst dwarfs show extended and filamentary H I structures, which may indicate either a recent interaction/merger or cold gas accretion from the environment; e.g. NGC 1569 (Stil & Israel, 2002), IC 10 (Manthey & Oosterloo, 2008), and NGC 5253 (López-Sánchez et al., 2012). In some cases, the presence of a nearby companion and/or of stellar tidal features clearly points to an interaction/merger between gas-rich dwarfs; e.g. II Zw 40 (van Zee et al., 1998), II Zw 70/71 (Cox et al., 2001), and I Zw 18 (Lelli et al., 2012a). However, some starburst dwarfs seem to have relatively symmetric and unperturbed H I disks; e.g. NGC 2915 (Elson et al., 2011) and VII Zw 403 (Simpson et al., 2011). The relative fraction of starburst dwarfs with symmetric/asymmetric H I morphologies in their outer regions is unclear, as well as the relation between the extended H I emission and the starburst activity.
| Galaxy | SFR0 | SFRp | Ref. | ||||||
|---|---|---|---|---|---|---|---|---|---|
| (10-3M⊙ yr-1) | (10-3M⊙ yr-1 kpc-2) | —— (Gyr-1) —— | (Myr) | ||||||
| NGC 625 | 3.00.1 | 42 | 8620 | 0.120.06 | 2.50.6 | -2.660.63 | -1.330.45 | 820180 | a |
| NGC 1569 | 211 | 8015 | 24010 | 2.80.5 | 8.50.3 | -1.790.21 | -1.310.11 | 4010 | a |
| NGC 1705 | 6 | 31478 | 31478 | 4411 | 4411 | -0.650.56 | -0.650.56 | 3.01.5 | b |
| NGC 2366 | 5.60.4 | 439 | 16010 | 0.70.1 | 2.60.2 | -1.630.24 | -1.060.13 | 45050 | a |
| NGC 4068 | 4.70.3 | 317 | 423 | 3.00.7 | 4.50.3 | -1.700.26 | -1.560.15 | 36040 | a |
| NGC 4163 | 2.90.6 | 5.21.6 | 123 | 1.60.5 | 3.80.9 | -2.130.43 | -1.770.39 | 45050 | a |
| NGC 4214 | 3.10.9 | 6413 | 13040 | 4.20.8 | 8.52.6 | -1.490.32 | -1.180.40 | 45050 | a |
| NGC 4449 | 6.00.5 | 97070 | 97070 | 282 | 282 | -1.180.18 | -1.180.18 | 53 | a |
| NGC 5253 | 9.00.9 | 16213 | 40040 | 120.9 | 293 | -1.820.16 | -1.430.17 | 45050 | a |
| NGC 6789 | 3.81.3 | 3.01.3 | 155 | 1.90.8 | 9.73.2 | -2.210.52 | -1.510.44 | 56565 | a |
| UGC 4483 | 143 | 114 | 112 | 9.71.8 | 8.83.5 | -0.800.27 | -0.840.45 | 56565 | a |
| UGC 6456 | 7.61.1 | 233 | 233 | 5.10.7 | 5.10.7 | -1.180.42 | -1.180.42 | 168 | a |
| UGC 6541 | 3 | 3.01.5 | … | 1.20.6 | … | -1.270.71 | … | … | c |
| UGC 9128 | 6.31.4 | 0.70.4 | 51 | 0.60.3 | 4.40.9 | -2.110.59 | -1.260.25 | 15050 | a |
| UGCA 290 | 3 | 118 | 4215 | 4.33.1 | 166 | -0.800.88 | -0.220.61 | 155 | d |
| I Zw 18 | 30 | 10050 | 10050 | 12764 | 12764 | -0.070.73 | -0.070.73 | 105 | e |
| I Zw 36 | 7 | 2512 | … | 9.84.7 | … | -0.350.69 | … | … | f |
| SBS 1415+437 | 12 | 407 | 15010 | 2.20.4 | 8.30.5 | -1.470.25 | -0.900.19 | 45050 | a |
Notes. For a detailed description of these quantities, we refer to Sect. 4.3. For UGC 6541 and I Zw 36, the recent SFH ( Gyr) is not well constrained due to the limited photometric depth of the CMDs, thus we have no robust estimate of , sSFRp, and . Another problematic case is I Zw 18, where we prefer to use the SFR derived from H observations rather than the value derived from fitting the CMD.
In this paper we investigate the hypothesis that starbursts in dwarf galaxies are triggered by external mechanisms. To this aim, we study in detail the H I emission in the outer regions of 18 starburst dwarfs. The properties of our galaxy sample have been described in LVF14 and are summarized in Tables 1 and 2. In short, we selected galaxies that satisfy two criteria: (i) they have been resolved into single stars by Hubble Space Telescope (HST) observations, providing detailed star-formation histories (SFHs) from the modelling of color-magnitude diagrams (CMDs; e.g. McQuinn et al., 2010); and (ii) they have a birthrate parameter , identifying a starburst (Kennicutt, 1998). As far as we are aware of, 25 dwarf galaxies observed with the HST satisfy these criteria; we collected new and archival H I data for 18 of them. Note that the birthrate parameter of a galaxy is generally very difficult to measure. According to Lee et al. (2009), galaxies with have H equivalent widths larger than 100 , and constitute only of the population of star-forming dwarfs at (but see McQuinn et al. 2010 regarding the limitations of H observations to identify starburst dwarfs). Here we consider birthrate parameters derived directly from the SFHs as , where SFRp is the peak SFR over the past 1 Gyr and is the average SFR over the past 6 Gyrs (see McQuinn et al., 2010). Thus, the HST information allows us to unambiguously identify starburst dwarfs, which generally constitute a small subset of star-forming dwarfs, and also to investigate possible relations between the H I emission in the outer galaxy regions and the detailed starburst properties (starburst timescale, starburst intensity, etc.).
2 Data analysis
For the 18 galaxies in our sample, we collected both new and archival 21 cm-line observations from the VLA, the Westerbork Synthesis Radio Telescope (WSRT), and the Australia Telescope Compact Array (ATCA). Archival observations were available for 15 galaxies, mostly from the WHISP (Swaters et al., 2002), THINGS (Walter et al., 2008), LITTLE-THINGS (Hunter et al., 2012), and VLA-ANGST (Ott et al., 2012) projects (see Table 3). New H I observations were obtained for the remaining 3 objects using the VLA and the WSRT. In LVF14, we described the reduction of these observations and presented H I data at relatively high spatial resolutions (ranging from 5′′ to 30′′ depending on the individual galaxy properties). Here we analyse H I datacubes at lower spatial resolutions, which are more sensitive to low-column-density gas in the outer regions (see Table 3). We use the same dataset as in LVF14 except for two objects: NGC 4449 and UGC 4483. For NGC 4449, the H I datacube from THINGS (Walter et al., 2008) covers a relatively small region on the sky, thus here we use the total H I map and velocity field from Hunter et al. (1998), which were obtained from VLA D-array observations in a 33 pointing mosaic (covering 1∘). For UGC 4483, in Lelli et al. (2012b) we reduced and analysed archival H I data obtained with the B- and C-arrays of the VLA, but here we use the datacube from Ott et al. (2012) that includes also new D-array observations, probing low-column-density gas on larger angular scales.
| Galaxy | Telescope | Source | Smoothed Beam | Ch. Sep. | Taper | Rms Noise | |||
|---|---|---|---|---|---|---|---|---|---|
| (asecasec) | (pcpc) | (km s-1) | (mJy/beam) | (1020 cm-2) | ( pc-2) | ||||
| NGC 625 | VLA | a | 30.030.0 | 567567 | 2.6 | Hann. | 2.6 | 1.10.5 | 0.90.4 |
| NGC 1569 | VLA | b | 20.020.0 | 330330 | 2.6 | Hann. | 1.1 | 1.60.7 | 1.30.6 |
| NGC 1705 | ATCA | c | 20.020.0 | 494494 | 3.5 | Hann. | 1.2 | 1.10.4 | 0.90.3 |
| NGC 2366 | VLA | b | 20.020.0 | 310310 | 2.6 | Hann. | 1.3 | 1.50.6 | 1.20.5 |
| NGC 4068 | WSRT | d | 30.030.0 | 625625 | 2.0 | Unif. | 4.4 | 1.40.5 | 1.20.4 |
| NGC 4163 | VLA | b | 20.020.0 | 290290 | 1.3 | Hann. | 1.3 | 0.90.3 | 0.80.3 |
| NGC 4214 | VLA | b | 30.030.0 | 393393 | 1.3 | Hann. | 3.0 | 1.20.6 | 1.00.5 |
| NGC 4449 | VLA | e | 62.054.0 | 12621099 | 5.2 | Hann. | 1.3 | 0.7 | 0.6 |
| NGC 5253 | ATCA | f | 40.040.0 | 679679 | 9.0 | Unif. | 2.7 | 1.00.3 | 0.80.3 |
| NGC 6789 | WSRT | a | 20.020.0 | 349349 | 2.0 | Unif. | 1.3 | 1.00.3 | 0.80.3 |
| UGC 4483 | VLA | g | 20.020.0 | 310310 | 2.6 | Hann. | 1.6 | 1.10.3 | 0.90.3 |
| UGC 6456 | VLA | a | 20.020.0 | 417417 | 2.6 | Hann. | 2.4 | 1.60.7 | 1.30.6 |
| UGC 6541 | VLA | b | 20.020.0 | 408408 | 1.3 | Hann. | 1.8 | 1.40.4 | 1.20.3 |
| UGC 9128 | VLA | b | 20.020.0 | 213213 | 2.6 | Hann. | 1.6 | 1.30.4 | 1.00.3 |
| UGCA 290 | VLA | a | 20.020.0 | 650650 | 1.6 | Unif. | 2.0 | 1.10.3 | 0.90.3 |
| I Zw 18 | VLA | h | 20.020.0 | 17651765 | 1.3 | Hann. | 1.0 | 1.00.6 | 0.80.4 |
| I Zw 36 | VLA | b | 20.020.0 | 572572 | 2.6 | Hann. | 1.9 | 1.30.4 | 1.00.3 |
| SBS 1415+437 | VLA | a | 20.020.0 | 13191319 | 1.6 | Unif. | 2.8 | 1.30.3 | 1.00.3 |
For every galaxy, we chose the optimal spatial resolution using the following approach. We first inspected the H I cube at the highest spatial and spectral resolutions available. Then, this cube was progressively smoothed in the image plane to 10′′, 20′′, 30′′, and 40′′, and total H I maps at different spatial resolutions were constructed by summing masked channel maps. The smoothing procedure was halted when the total H I map reached a 3 column density sensitivity of 1020 atoms cm-2, which is adequate to investigate the H I morphology in the outer regions (e.g. Swaters et al., 2002) and, at the same time, allows us to preserve a relatively high angular resolution (typically 20′′ except for 4 cases, see Table 3). The masks were obtained by smoothing the cubes in velocity to 10 km s-1 and in the image plane to 1′ (2′ for NGC 2366, NGC 4214, and NGC 5253 given their large angular extent), and clipping at 3 ( is the rms noise in the smoothed cube). For NGC 4214, the cube was smoothed in velocity to only 2.6 km s-1 because only a few line-free channels were available at its high-velocity end. All the masks were visually inspected; residual noise peaks and Galactic emission were interactively blotted out. Note that the original, high-resolution cubes were obtained using a robust weighting technique (Briggs, 1995) with robust parameter , thus they have relatively low column density sensitivity but their beam profile is close to a Gaussian shape. We avoided using natural-weighted datacubes because the broad wings of their beam profiles may lead to spurious detections of diffuse emission, especially when the H I data are not cleaned down to the noise level (as is the case for the LITTLE-THINGS datacubes that are cleaned down to only 2.5, see Hunter et al. 2012).
Since we are interested in low-column-density H I emission, it is important to accurately estimate the 3 column density sensitivity of the total H I maps. The noise in a total H I map is not uniform but varies from pixel to pixel because at each spatial position one adds a different number of channels, given that only the pixels inside a given mask are considered. Following Verheijen & Sancisi (2001), we constructed signal-to-noise maps and calculated a pseudo-3 column density contour by averaging the values of the pixels with signal-to-noise ratio between 2.75 and 3.25. We also calculated the rms around the mean value of these pixels to estimate the uncertainty on . In particular, we halted the progressive smoothing of the H I cubes when the value of was equal to cm-2 within the errors. The derivation of the signal-to-noise maps is described in detail in Appendix A.
We calculated total H I fluxes from the smoothed maps by considering the pixels with a flux density higher than , that can be considered as a pseudo-1.5 contour (see Table 4). Our H I fluxes are in overall agreement with those from single-dish observations: the differences are typically 15 apart for two objects (NGC 1569 and UGC 6456) that are affected by Galactic emission. Our smoothed H I maps, thus, recover most of the H I emission from the galaxy.
We also derived H I velocity fields by estimating an intensity-weighted mean (IWM) velocity from the masked datacube at the optimal resolution, clipping at 2 and considering only the pixels within the pseudo-3 contour of the total H I map. Since the H I profiles are generally broad and asymmetric, these low-resolution IWM velocity fields are uncertain and provide only an overall description of kinematics of the extended gas. For the 18 galaxies in our sample, a detailed analysis of the H I kinematics has been presented in Lelli et al. (2012a, b) and LVF14.
| Galaxy | |||||||
|---|---|---|---|---|---|---|---|
| (Jy km/s) | () | (amin) | (kpc) | (Gyr) | |||
| NGC 625 | 27.0 | 9.72.2 | 4.7 | 5.4 | 1.6 | 1.1 | 0.60 |
| NGC 1569 | 106.6 | 29.14.5 | 10.8 | 10.7 | 3.6 | 1.3 | 0.68 |
| NGC 1705 | 18.2 | 11.12.9 | 4.0 | 5.9 | 3.9 | 0.5 | 0.74 |
| NGC 2366 | 254.8 | 6217 | 10.1 | 9.4 | 2.1 | 1.1 | 0.53 |
| NGC 4068 | 34.2 | 14.91.6 | 3.6 | 4.5 | 2.5 | 0.7 | 0.52 |
| NGC 4163 | 7.2 | 1.50.2 | 2.3 | 2.0 | 2.0 | 1.2 | 0.64 |
| NGC 4214 | 250.8 | 438 | 10.4 | 8.2 | 3.7 | 0.6 | 0.52 |
| NGC 4449 | 721.2 | 30077 | 34.3 | 42 | 13 | 7.4 | 0.77 |
| NGC 5253 | 47.6 | 13.83.4 | 4.6 | 4.7 | 2.2 | … | 0.57 |
| NGC 6789 | 5.9 | 1.80.3 | 1.8 | 1.9 | 2.7 | 0.2 | 0.60 |
| UGC 4483 | 12.0 | 2.90.5 | 2.7 | 2.5 | 4.2 | 0.8 | 0.73 |
| UGC 6456 | 10.4 | 4.50.5 | 1.9 | 2.4 | 1.9 | 1.5 | 0.51 |
| UGC 6541 | 2.8 | 1.20.2 | 1.9 | 2.3 | 2.5 | … | 0.73 |
| UGC 9128 | 11.1 | 1.30.2 | 1.8 | 1.2 | 2.0 | 0.3 | 0.48 |
| UGCA 290 | 1.35 | 1.40.2 | 1.1 | 2.1 | 2.3 | … | 0.70 |
| I Zw 18 | 2.7 | 214 | 1.6 | 8.5 | 17 | 1.4 | 0.76 |
| I Zw 36 | 8.2 | 6.71.3 | 1.9 | 3.3 | 3.7 | 0.7 | 0.64 |
| SBS 1415+437 | 4.6 | 20.14.6 | 1.8 | 7.3 | 3.0 | 2.5 | 0.42 |
3 The H I gas in the outer regions
In the following we qualitatively describe the overall properties of the H I gas in the outer regions of starburst dwarfs, while in Sect. 4 we quantify the outer H I asymmetry using a new asymmetry parameter; we also make a comparison with a control sample of typical star-forming Irrs and investigate the relation between outer H I distribution and starburst properties. In Sect. 5 we then describe each individual galaxy in detail and discuss its nearby environment.
Figure 1 shows the total H I maps of our 18 starburst dwarfs superimposed on optical images; in each map the H I contours correspond to 1, 4, and 161020 atoms cm-2. The outer H I distribution of starburst dwarfs shows a variety of morphologies. Several galaxies have heavily disturbed H I distributions, characterized by large-scale asymmetries, long filaments, and/or a large optical-H I offset (NGC 4449, I Zw 18, NGC 1705, UGC 6541, NGC 1569, and I Zw 36). Other galaxies, instead, show lopsided H I morphologies, characterized by minor asymmetries and/or extensions in the outer parts (NGC 2366, NGC 4068, NGC 4214, UGC 6456, UGC 9128, UGC 4483, and SBS 1415+437). There is not a clear-cut separation between these two types of H I morphologies, since there are several “intermediate” cases that have relatively regular H I distributions in the inner parts and small tails/filaments in the outer regions (NGC 4163, NGC 625, NGC 6789, and NGC 5253).
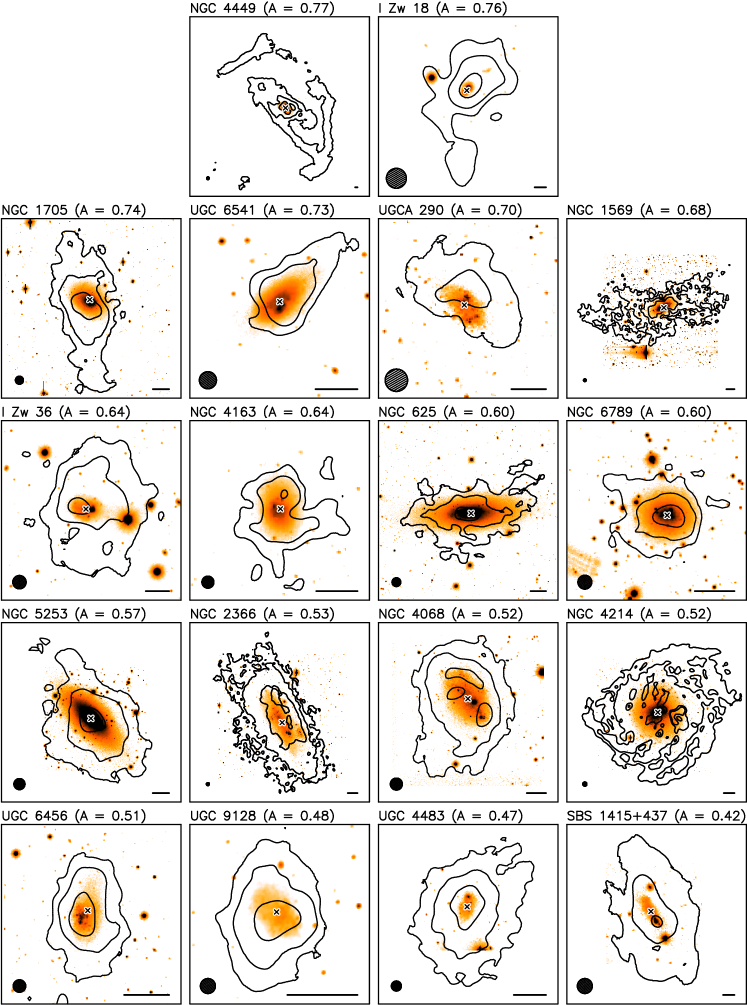
We estimated the extent of the H I distribution by measuring the projected distance between the optical center of the galaxy and the outermost pixel with an observed column density of 11020 atoms cm-2. Note that is conceptually different from the H I radius , as the latter is defined as the radius where the azimuthally averaged H I surface density profile (corrected for inclination) reaches 1 M⊙ pc-2 (1.21020 atoms cm-2; see e.g. Swaters et al. 2002). Since is not obtained from an azimuthal average over the total H I map, it properly takes into account anomalous extensions in the H I distribution (such as tails or filaments), but it may be affected by projection effects along the line of sight. Table 4 lists the values of and , where the optical radius is defined as 3.2 exponential scale-lengths (see LVF14) and is given in Table 1. For the 18 galaxies in our sample, ranges from 1.5 to 4, except for I Zw 18 () and NGC 4449 (). These two objects show exceedingly extended H I tails with relatively high column densities (1020 atoms cm-2). Intriguingly, both I Zw 18 and NGC 4449 have a companion galaxy with at a projected distance kpc. For I Zw 18, there are strong indications that the extended H I emission is associated with the secondary body (see Lelli et al., 2012a). For NGC 4449, instead, the relation between the companion galaxy and the long H I filaments is unclear (see Martínez-Delgado et al., 2012).
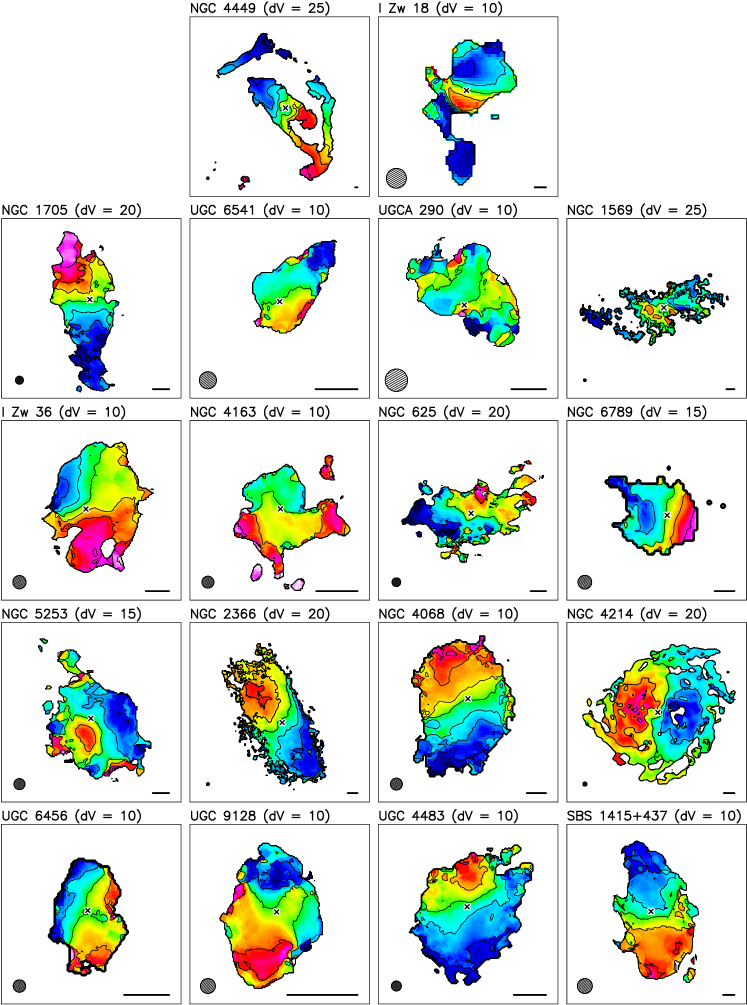
Finally, we describe the H I kinematics in the outer regions. Figure 2 shows the velocity fields of our 18 galaxies. As we stressed in Sect. 2, these velocity fields are only indicative due to the complex structure of the H I profiles, but they provide an overall description of the gas kinematics. For starburst dwarfs with a rotating H I disk, the outer gas generally is kinematically connected to the inner H I distribution (except for I Zw 18, discussed in Lelli et al. 2012a). This suggests that the outer disks can be regularized in a few orbital times by differential rotation. We calculated the orbital times at using the rotation velocities in Table 1 (from LVF14). These rotation velocities are typically estimated at 1 to 2 , thus we are extrapolating their values to larger radii by assuming that the rotation curve is flat and the outer gas lies approximately in the same plane as the inner H I disk. The values of in Table 4, therefore, should be considered as order-of-magnitude estimates. Despite these uncertainties, the orbital times at are consistently of the order of 0.5 to 1 Gyr (except for NGC 4449 with Gyr), indicating that the outer asymmetries must be relatively recent and possibly short-lived.
4 Quantifying the H I asymmetry
4.1 The asymmetry parameter
To investigate the relation between the H I morphology and the starburst, it is desirable to quantify the degree of asymmetry/lopsidedness in the outer H I distribution of each individual galaxy. The infrared/optical morphologies of galaxies are usually quantified using the Concentration-Asymmetry-Smoothness (CAS) parameters (Conselice, 2003) and the Gini- parameters (Lotz et al., 2004). Recently, Holwerda et al. (2011a, b); Holwerda et al. (2013) used these parameters to quantify the H I morphologies in several samples of nearby galaxies. In particular, Holwerda et al. (2011b) used total H I maps from the WHISP survey, and found that the CAS and Gini parameters only weakly correlate with previous visual classifications of morphological lopsidedness (by Swaters et al. 2002 and Noordermeer et al. 2005). Holwerda et al. (2011a, b) defined the asymmetry parameter as:
| (1) |
where and are the flux densities at position in the original image and in an image rotated by 180∘ with respect to the galaxy center, respectively. This definition normalizes the residuals between the original image and the rotated image to the total flux. Thus, asymmetries in the outer regions may have negligible weight in the sum, since the flux densities in the outer parts can be up to 2 orders of magnitude lower than those in the inner parts. This effect has been pointed out by Holwerda et al. (2013) (see their Sect. 3.2 and Fig. 2), who demonstrated that the value of does not strongly depend on the outer H I emission observed in low-resolution H I maps. Our goal, instead, is to give weight to the large-scale asymmetries in the outer parts. Thus, we use a new definition of :
| (2) |
where is the total number of pixels in the image. This definition normalizes the residuals at position to the local flux density. In particular, if H I emission is detected only on one side of the galaxy, the residuals at and get the maximum value ().
In Fig. 1 the total H I maps of our 18 starburst dwarfs are ordered according to the value of . It is clear that our definition of reliably quantifies the H I asymmetry in the outer parts. The value of , however, may depend on (i) the assumed galaxy center, (ii) the column density sensitivity of the H I observations, and (iii) the spatial resolution in terms of both the beam-size in kpc and the relative number of beams across the H I map. In the following, we describe the effects of these factors on the value of .
We adopted the optical centers derived in LVF14 by fitting ellipses to the outer isophotes (see Table 1). We did not consider the kinematic centers because 50 of the galaxies in our sample have either a kinematically-disturbed H I disk or an unsettled H I distribution, thus the kinematic parameters are either very uncertain or undefined. Moreover, the use of the optical center returns high values of for galaxies that show a strong offset between the H I distribution and the stellar body (e.g. NGC 1705 and UGCA 290), that may indicate a recent interaction/accretion event. We checked that small changes in the value of the centers (2′′) do not significantly affect the value of (the absolute differences in are ). This is expected because (i) the typical uncertainties on the position of the optical center ( to 2′′) are much smaller than the H I beam (), and (ii) by our definition of , high-column-density asymmetries in the inner parts do not have much weight.

Regarding the column density sensitivity, the values of in Fig. 1 and Table 4 have been calculated considering only pixels with cm-2, since this corresponds to the pseudo-3 contour of our total H I maps (see Sec. 2 and Appendix A). To test the effect of this column density threshold, in Fig. 3 (top) we compare the values of obtained by considering thresholds of 1 and 21020 cm-2. The differences in are within 0.1 and do not show a systematic trend, implying that the detailed shape of the outermost contour in the total H I map does not strongly affect the value of . We warn, however, that the use of a column-density threshold provides reliable results as long as (i) one does not consider values much below the pseudo-3 contour, introducing noise in the total H I maps, and (ii) one does not consider high column density thresholds (e.g. cm-2), probing the small-scale clumpiness of the H I distribution. We also note that, when using a fixed column-density threshold for different galaxies, the inclination of the H I disk may introduce some systematic effects, given that projected column densities correspond to different face-on surface densities. For an optically-thin H I disk, the projected column density increases with . Thus, inclination effects on the column-density threshold become important only in edge-on disks with , for which projected column densities of cm-2 would correspond to face-on surface densities that are lower by a factor . In our galaxy sample, the inclinations of the H I disks are (see LVF14), thus projection effects are not a serious concern here.
The spatial resolution of the H I observations deserves some attention in the derivation of . To quantify the effects of beam smearing, we constructed total H I maps at 20′′ and 30′′ resolution for all the galaxies in our sample (except for NGC 4449 that has H I data at a native resolution of 60′′). The respective values of , calculated using a threshold of 11020 cm-2, are compared in Fig. 3 (bottom panel). As expected, total H I maps at higher resolutions systematically yield higher values of . The differences in , however, appear reasonably small (within 0.1). Galaxies with a small number of beams along the major axis of the H I disk (e.g. NGC 4163, NGC 6789, I Zw 18) typically show the largest differences in (0.1), whereas galaxies with well-resolved H I maps (e.g. NGC 2366, NGC 1569, and NGC 4214) show very small differences (0.03). For the latter galaxies, a severe smoothing of the H I data down to 60′′ (a factor 3) would still give differences in . Thus, we draw the following conclusions: (i) to have a reliable estimate of , one needs at least 5 resolution elements along the major axis of the total H I map, and (ii) when the previous condition is met, differences in spatial resolution by a factor of 3 give relatively small differences in (). Our total H I maps are all reasonably resolved (see Fig. 1) and have linear resolutions ranging from 0.3 to 0.7 kpc (see Table 3), thus it makes sense to compare the values of for different galaxies. Exceptions are NGC 4449, I Zw 18, and SBS 1415+437, that have total H I maps with linear resolutions 1 kpc. Despite the low linear resolution, NGC 4449 and I Zw 18 show the highest values of in our sample, indicating that data at higher resolutions would only increase the difference with the other galaxies. On the contrary, SBS 1415+437 has the lowest value of in our sample; this may be an effect of beam-smearing. We did not build total H I maps at the same linear resolution (in kpc) for all the galaxies because it is not possible to find a compromise between the required number of beams along the H I major axis ( in order to have a proper estimate of ) and the 3 column density sensitivity ( in order to probe the outer H I emission).
4.2 Comparison with typical irregulars
In this section, we estimate for a control sample of typical star-forming Irrs and make a comparison with our sample of starburst dwarfs. We use total H I maps from the VLA-ANGST survey (Ott et al., 2012), which provides multi-configuration VLA observations for 29 low-mass galaxies from the Advanced Camera for Surveys Nearby Galaxy Survey Treasury (ANGST; Dalcanton et al. 2009). In order to have two galaxy samples that span similar ranges of stellar and H I masses, we exclude 8 objects with (nearly equivalent to M⊙), given that such very low-mass galaxies are not present in our sample of starburst dwarfs. We also exclude AO 0952+69 (Arp’s loop), that may be a feature in the spiral arm of M81 (Ott et al., 2012) or a tidal dwarf galaxy (Weisz et al., 2011). The VLA-ANGST sample also contains 3 starburst dwarfs that are included in our sample (NGC 4163, UGC 4483, and UGC 9128), which we use to test the consistency between our total H I maps and the VLA-ANGST ones. The control sample of typical Irrs, therefore, contains 17 galaxies.
The starburst and control samples cover similarly broad ranges of absolute magnitudes () and H I masses (). For the starburst sample, the mean values in and are, respectively, mag and , while for the control sample they are mag and . Despite the starburst dwarfs are, on average, slightly more luminous and gas-rich than the typical Irrs, it is clear that the two samples can be properly compared. Moreover, similarly to the starburst dwarfs in our sample, the VLA-ANGST galaxies have been resolved into single stars by HST (Dalcanton et al., 2009). For most of these galaxies, Weisz et al. (2011) derived SFHs by averaging the SFR over a single time-bin in the last 1 Gyr, thus we cannot check whether they have a recent birthrate parameter , confirming that they are not starburst dwarfs. However, as far as we are aware of, the 17 galaxies in our control sample do not show any sign of recent starburst activity either in their CMDs nor in their integrated spectra, thus we consider them representative for typical star-forming Irrs.
The natural-weighted H I maps from VLA-ANGST have both an adequate number of resolution elements along the H I major axis and a 3 column density sensitivity cm-2 (see Ott et al., 2012), thus we can safely calculate using a column-density threshold of 1020 cm-2 (as for our starburst dwarfs). The beam-sizes of these H I maps range from 60 to 200 pc, significantly smaller than those of our own H I maps (cf. with Table 3). As we discussed in Sect. 4.1, this implies that the values of for our starburst dwarfs may be systematically underestimated with respect to those of the VLA-ANGST Irrs. For UGC 4483 and UGC 9128, however, the VLA-ANGST H I maps and our total H I maps yield remarkably consistent results: UGC 4483 has from our map and from the VLA-ANGST one, while UGC 9128 has from our map and from the VLA-ANGST one. NGC 4163, instead, shows a significant discrepancy: our map yields while the VLA-ANGST one returns . The VLA-ANGST map of NGC 4163 does not trace the full extent of the H I tail to the West and does not detect the cloud complexes to the South (compare our Fig. 1 with Fig. 18 of Ott et al. 2012). This is likely due to a different masking of the H I emission during the derivation of the total H I map. We are confident that these H I features are real given that they have been detected also by Swaters et al. (2002) using WSRT data.

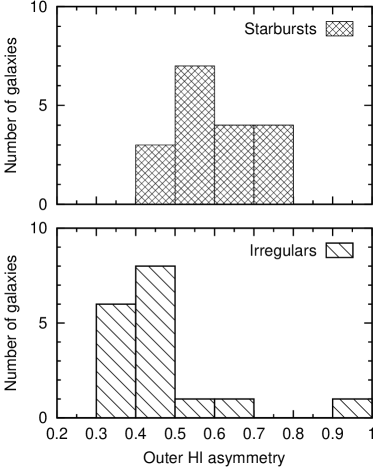
Fig. 4 shows that starburst dwarfs systematically have higher values of than typical Irrs. The mean and median values of these distributions are, respectively, 0.60 and 0.60 for the sample of starburst dwarfs, and 0.47 and 0.41 for the control sample of Irrs. Since the total H I maps of starburst dwarfs have larger beam-sizes than those of Irrs, the difference between the two samples may be even larger. Given the possible effects of beam smearing on , we did not perform a statistical analysis of the two distributions (e.g. using a Kolmogorov-Smirnoff test). It is clear, however, that starburst dwarfs generally have more asymmetric H I morphologies in their outer regions than typical Irrs.
Two galaxies from the control sample have very high values of , comparable with those of the most disturbed starburst dwarfs. These objects are NGC 404 () and DDO 6 (). NGC 404 is at the high-mass end of the dwarf classification () and shows an unusual lenticular morphology for a dwarf galaxy. Several authors (e.g. Thilker et al., 2010) argued that NGC 404 may have experienced a merger in the last 1 Gyr given that it has an inner, counter-rotating stellar core (Bouchard et al., 2010) and an outer, extended H I ring (del Río et al., 2004) hosting recent, low-level star-formation (Thilker et al., 2010). Considering these facts, the relatively high value of is not surprising, and demonstrates that our definition of can successfully identify past interacting/merging systems. Regarding DDO 6, both Skillman et al. (2003) and Weisz et al. (2011) classified this object as a “transition” dwarf, i.e. a low-mass galaxy with detected H I emission but little or no H flux (Mateo, 1998). In DDO 6, H I emission is detected only on one side of the galaxy (similarly to UGC 6541 in our sample), hence this object has an extremely high value of . It would be interesting to investigate whether this galaxy has experienced a recent starburst. Intriguingly, the well-studied “transition” dwarf Antlia has been classified as a starburst by McQuinn et al. (2012), and has a H I distribution similar to DDO 6 and UGC 6541 (see Ott et al. 2012; Antlia is not included here because it has ).
4.3 H I asymmetries versus starburst properties

We now investigate the possible relations between and the properties of the starburst as derived from the HST studies of the resolved stellar populations. We consider the following quantities (see Table 2):
-
1.
the birthrate parameter , where SFRp is the peak SFR over the past 1 Gyr and is the average SFR over the past 6 Gyrs (see McQuinn et al., 2010);
-
2.
the peak SFR surface density , where is defined as 3.2 exponential scale-lengths (see LVF14);
-
3.
the present-day SFR surface density , where is the average SFR over the last 10 Myr;
-
4.
the specific SFR (sSFR) calculated both as SFR and as SFR;
-
5.
the look-back time at SFRp.
In particular, can be considered as the typical “age” of the starburst, allowing us to distinguish between “old” bursts (with Myr) and “young” bursts (with Myr). The SFHs of 5 galaxies (NGC 2366, NGC 4068, UGC 4483, UGC 9128, and SBS 1415+437) show two distinct peaks with similar SFRs (consistent within 1). In these cases, we consider the SFR and the look-back time of the older peak since this is the one that formed more stars, given that the SFR is averaged over a larger time-bin (typically a factor of 4, see McQuinn et al. 2010). For UGC 6541 and I Zw 36, the recent SFH is not well constrained (see Schulte-Ladbeck et al., 2000, 2001), thus we have no robust estimate of , sSFRp, and .
In Fig. 5, we plot versus the SFR indicators , , sSFR(0), and sSFR(). To quantify possible trends in these diagrams, we calculated the Pearson’s correlation coefficient , where for an ideal linear correlation/anticorrelation, whereas if no correlation is present. We found values of to 0.4, except for the diagram that yields . We think that this weak trend is not significant because it is driven by 3 galaxies (NGC 4449, I Zw 18, and NGC 1705) that have Myr: for these objects the values of may be systematically enhanced with respect to galaxies with older bursts because the SFR is averaged over a smaller time bin (10 Myr versus 50-100 Myr), given that the intrinsic time-resolution of the SFHs increase with decreasing look-back time (see e.g. McQuinn et al., 2010). We also found no clear correlation with .
Fig. 6 (left) shows that a clear trend is present between and (): galaxies hosting a “young” burst generally have a more asymmetric H I distribution than galaxies hosting an “old” one, further suggesting a close link between the outer, disturbed gas morphology and the central, recent starburst activity. Galaxies with minor asymmetries () have values of Myr (apart from UGC 6456), which are comparable within a factor of 2 with the orbital times at the outermost radii . This is shown in Fig. 6 (right), where we plot against the ratio . We recall that is an order-of-magnitude estimate, thus the ratio provides only a rough measure of the number of orbits that the outer gas may have completed since the epoch of the most intense star-formation activity. Despite these uncertainties, Fig. 6 (right) clearly indicates that galaxies hosting an “old” burst may have had enough time to complete an entire revolution around the center and, thus, regularize their outer H I distribution.
Finally, we discuss the “outlier” UGC 6456 (VII Zw 403) indicated in Fig. 6. This galaxy has been recently studied by Simpson et al. (2011), who pointed out the relatively regular H I morphology and the lack of a clear external trigger. The total H I map and velocity field of Hunter et al. (2012), however, show a tail/extension to the South-West. We also detected this feature in our total H I map, but it is below the column density sensitivity of the observations, having cm-2. Deeper H I observations are needed to confirm whether this H I tail is real. The location of UGC 6456 in Figs. 5 and 6 would change if one adopts column-density thresholds cm-2, but unfortunately these low values cannot be consistently adopted here due to the limited sensitivity of the H I observations for several galaxies in our sample.
5 Individual galaxies and their environment
In the following, we discuss in detail the H I properties of individual galaxies in our sample and describe their nearby environment. We used the NASA/IPAC Extragalactic Database (NED111The NASA/IPAC Extragalactic Database (NED) is operated by the Jet Propulsion Laboratory, California Institute of Technology, under contract with the National Aeronautics and Space Administration.) to search for nearby objects with measured systemic velocities within km s-1 with respect to the starburst dwarf. Table 5 provides the 3 nearest galaxies to each starburst dwarf, together with their basic properties (from Karachentsev et al., 2013). We checked that these objects are actual galaxies by visual inspection, and excluded background/foreground galaxies when accurate, redshift-independent distances were available. Since most of the starburst dwarfs considered here have distances Mpc, Table 5 should be nearly complete down to dwarf galaxies with total magnitudes and mean surface brightnesses mag arcsec-2 (cf. with Karachentsev et al., 2004, 2013). SBS 1415+437 and I Zw 18, however, have Mpc and Mpc, respectively, thus they may have faint companions that have not been identified by optical surveys. An object with a peculiar velocity of 200 km s-1 covers 200 kpc in 1 Gyr, thus it is possible that a galaxy at a projected distance kpc from a starburst dwarf might have triggered the burst by a past collision on an hyperbolic orbit (e.g. Noguchi, 1988). Most of the galaxies in our sample have such a potential perturber, except for NGC 1705, NGC 6789, and UGC 9128. We stress, however, that the presence of such a companion does not guarantee that the starburst has been triggered by a past collision, given that the relative orbits of the two galaxies are unknown.
NGC 625 has a 2 kpc H I tail to the North-West, that shows a coherent kinematic structure at km s-1. A second tail/extension is present to the South-East, but it does not show a clear kinematic structure. Our total H I map and velocity field are in close agreement with those from Côté et al. (2000) and Cannon et al. (2004). NGC 625 is part of the Sculptor group, but it is quite far from the central, massive galaxy NGC 253, being at a projected distance of 1.3 Mpc (Karachentsev, 2005).
NGC 1569 has a heavily disturbed H I distribution. A H I cloud with M⊙ lies at km s-1 to the East of the galaxy, and is connected to the main H I distribution by a thin bridge (see also Stil & Israel, 1998). The datacube is strongly affected by Galactic emission, thus the total H I map and the velocity field are uncertain. Our results are in close agreement with those from Stil & Israel (1998, 2002) and Johnson et al. (2012). NGC 1569 is part of the IC 432 group (Grocholski et al., 2008) and has a nearby companion (UGCA 92) at a projected distance of 70 kpc with a similar systemic velocity (within 20 km s-1).
NGC 1705 has an extended, warped H I disk. The H I disk shows relatively regular morphology and kinematics, but it is strongly offset with respect to the stellar component: the optical and kinematic centers differ by 550 pc, while the optical and kinematic PAs differ by 45∘ (see LVF14). To the North-East, there is also a small H I extension with peculiar kinematics, that may be associated with the H wind (see Meurer et al., 1998; Elson et al., 2013). NGC 1705 appears very isolated: the two nearest objects (LSBG F157-089 and MRSS 157-121650) are at a projected distance of 0.5 Mpc, but may be members of the Dorado group at Mpc (see Firth et al. 2006 and Evstigneeva et al. 2007, respectively). Three other objects (NGC 1533, IC 2038, and IC 2039) lie at 7∘ from NGC 1705, but they seem to be background galaxies at distances of 20 Mpc (based on the Tully-Fisher relation).
| Galaxy | Membership | Nearest galaxies | Type | Dist | |||||
|---|---|---|---|---|---|---|---|---|---|
| (kpc) | (km s-1) | (Mpc) | (mag) | () | (km s-1) | ||||
| NGC 625 | Sculptor group | ESO245-005 | 203 | Im | 4.4 | -15.6 | 8.58 | 60 | |
| (periphery) | CFC97 Sc 24α | 402 | -236 | … | … | … | … | 92 | |
| GSD 106 | 619 | 132 | … | … | … | … | … | ||
| NGC 1569 | IC 432 group | UGCA 92 | 74 | 19 | Irr | 3.0 | -15.6 | 8.17 | 56 |
| Cam B | 190 | 157 | Irr | 3.3 | -11.9 | 7.08 | 21 | ||
| UGCA 86 | 231 | 147 | Im? | 3.0 | -17.9 | … | … | ||
| NGC 1705 | Field | LSBG F157-089β | 518 | 175 | … | … | … | … | … |
| MRSS 157-121650γ | 562 | -50 | … | … | … | … | … | ||
| SGC 0409.0-5638 | 631 | 242 | Irr | … | … | … | … | ||
| NGC 2366 | M81 group | NGC 2363δ | 2 | -33 | Irr | … | … | … | … |
| (periphery) | UGCA 133ϵ | 133 | 110 | Sph | 3.2 | -12.1 | … | ||
| NGC 2403 | 206 | 30 | Scd | 3.2 | -19.2 | 9.48 | 240 | ||
| NGC 4068 | CVn I cloud | MCG +09-20-131 | 135 | -47 | Irr | 4.6 | -13.1 | 7.37 | 27 |
| ASK 185765.0ε | 143 | 291 | … | … | … | … | … | ||
| UGC 7298 | 145 | -33 | Irr | 4.2 | -12.3 | 7.28 | 21 | ||
| NGC 4163 | CVn I cloud | MCG +06-27-017ζ | 27 | 181 | Im | 4.8 | -13.0 | … | … |
| NGC 4190 | 29 | 70 | Im/BCD | 2.8 | -13.9 | 7.46 | 49 | ||
| DDO 113 | 30 | 126 | Sph? | 2.9 | -11.5 | 32 | |||
| NGC 4214 | CVn I cloud | DDO 113 | 8 | -7 | Sph? | 2.9 | -11.5 | … | |
| NGC 4190 | 23 | -63 | Im/BCD | 2.8 | -13.9 | 7.46 | 49 | ||
| NGC 4163 | 34 | -133 | BCD | 3.0 | -13.8 | 7.16 | 32 | ||
| NGC 4449 | CVn I cloud | DDO 125 | 44 | -15 | Im | 2.7 | -14.3 | 7.48 | 27 |
| MCG +07-26-012 | 77 | 226 | Im | … | … | … | … | ||
| DDO 120 | 155 | 252 | Im | … | … | … | … | ||
| NGC 5253 | M83 group | ESO444-084η | 54 | 116 | Sc | … | … | … | … |
| NGC 5264 | 108 | 68 | Im | 4.5 | -15.9 | 7.65 | 35 | ||
| HIDEEP J1337-33 | 111 | 181 | Irr | 4.4 | -11.1 | 6.67 | 20 | ||
| NGC 6789 | Local Void | ABELL 2312:[MPC97] 04θ | 297 | 59 | … | … | … | … | … |
| UGC 11411 | 400 | 220 | BCD | … | … | … | … | ||
| LEDA 166193 | 578 | 290 | Irr | … | … | … | 28 | ||
| UGC 4483 | M81 group | M81 Dwarf A | 92 | -45 | Irr | 3.5 | -11.5 | 7.06 | 21 |
| Holmberg II | 100 | -16 | Im | 3.4 | -16.7 | 8.61 | 64 | ||
| DDO 53 | 201 | -138 | Irr | 3.6 | -13.4 | 7.62 | 30 | ||
| UGC 6456 | M81 group | CGCG 351-049ι | 151 | 8 | … | … | … | … | … |
| (periphery) | UGC 8245ι | 358 | 172 | Im | … | … | … | … | |
| DDO 82 | 683 | 158 | Im | 4.0 | -14.7 | … | … | ||
| UGC 6541 | CVn I cloud | ASK 184683.0 | 213 | 208 | … | … | … | … | … |
| (periphery) | ASK 185765.0ε | 289 | 247 | … | … | … | … | … | |
| NGC 3741 | 292 | -21 | Im/BCD | 3.0 | -13.1 | 7.88 | 83 | ||
| UGC 9128 | Field | LSBG F650-01κ | 353 | -167 | … | … | … | … | … |
| MAPS O-383-0548118λ | 359 | -93 | … | … | … | … | … | ||
| SDSS J145657.7+221315λ | 365 | -102 | … | … | … | … | … | ||
| UGCA 290 | NGC 4631 group? | UGC 7719 | 83 | 210 | Sdm | … | … | … | 57 |
| IC 3687 | 115 | 114 | Im | 4.6 | -14.6 | 7.90 | 36 | ||
| BTS 142 | 122 | 251 | Irr | … | … | … | 23 | ||
| I Zw 18 | Field | I Zw 18 C | 2 | -16 | Irr | 18.2 | -12.1 | 45 | |
| ASK 153750.0 | 639 | 243 | … | … | … | … | … | ||
| MGC +09-16-029 | 1052 | -159 | … | … | … | … | … |
| Galaxy | Membership | Nearest galaxies | Type | Dist | |||||
|---|---|---|---|---|---|---|---|---|---|
| (kpc) | (km s-1) | (Mpc) | (mag) | (107) | (km s-1) | ||||
| I Zw 36 | CVn I cloud | UGC 7639μ | 117 | 105 | Im | … | … | … | … |
| NGC 4248ν | 183 | 207 | … | … | … | … | … | ||
| MAPS O-171-0165792 | 214 | 195 | … | … | … | … | … | ||
| SBS 1415+437 | Field | MAPS O-221-0093662 | 179 | 105 | … | … | … | … | … |
| ASK 310753.0 | 492 | 18 | … | … | … | … | … | ||
| NGC 5608 | 493 | 47 | Im | … | … | … | … |
α According to Karachentsev et al. (2004), this galaxy is
not in the Sculptor group but lie outside the Local Volume. The
value of is taken from Cote et al. (1997).
This galaxy may be in the Dorado group ( Mpc,
Firth et al. 2006).
γ This object may be an ultra-compact dwarf in the Dorado
group ( Mpc, Evstigneeva
et al. 2007).
δ It is unclear whether this object is part of NGC 2366
or a separate galaxy (see Fig. 7).
ϵ The systemic velocity of this galaxy is not reported
by NED. We used the value given by Karachentsev et al. (2013).
ε Trentham
et al. (2001) included this galaxy in their study
of the Ursa Major cluster. However, ASK 185765.0 is probably not a
cluster member, given that its systemic velocity is 497 km s-1
(from the Sloan Digital Sky Survey).
ζ This galaxy is close to NGC 4163 on the sky, but inhabits
a further region of the CVn I cloud having Mpc
(from the TRGB).
η This edge-on spiral is not a member of the M83 group and
probably is a background galaxy.
θ NED classifies this object as a galaxy. It is projected on
the sky near the galaxy cluster ABELL 2312 (Maurogordato et al., 1997),
but its systemic velocity indicates that it is a nearby object. In our
opinion, it is unclear whether this is a galaxy or a Galactic object.
ι This object is not associated to the M81 group and may be
a background/foreground galaxy.
κ According to NED, this object may be a planetary nebula.
λ This object has also been classified as a X-ray source and a star.
μ This object may have Mpc (from surface brightness
fluctuations, Karachentsev et al. 2013) and be outside the CVn I cloud.
ν This object may have Mpc (from the Tully-Fisher
relation, Karachentsev et al. 2013) and be outside the CVn I cloud.
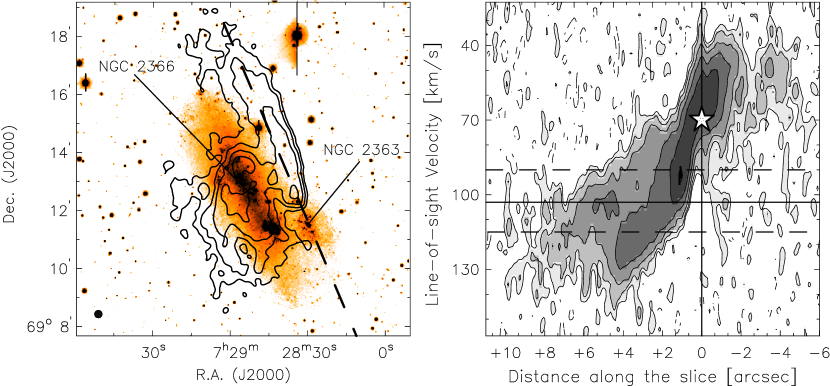
NGC 2366 has a H I disk with a broad extension to the South-East and a strong kinematic distortion to the North-West. Fig. 7 (left) shows an optical image overlaid with the H I emission at 15′′ resolution, integrated over a narrow velocity range near the systemic velocity (between 90 and 115 km s-1). The gas to the North-West does not follow the rotation of the H I disk (see also Fig. 3 of Oh et al., 2008) and may be associated with the secondary star-forming body to the South-West (NGC 2363). Fig 7 (right) shows a Position-Velocity diagram taken along the dashed-line in Fig. 7 (left). Intriguingly, the PV-diagram displays a steep velocity gradient coinciding with the spatial position and optical systemic velocity of NGC 2363 (indicated by the star). This may indicate that this velocity gradient is due to rotation in a local potential well. However, given the overall rotation of the H I disk of NGC 2366, this conclusion is uncertain. The NGC 2363/NGC 2366 system probably is an on-going minor merger.
NGC 4068 shows a broad H I extension to the South-East. This object is in the Canes Venatici I (CVn I) cloud, which is an extended, loose group inhabited by low-mass galaxies (Karachentsev et al., 2003).
NGC 4163 shows a H I tail to the West and, possibly, a second tail to the South (see also Hunter et al., 2012). NGC 4163 is in the CVn I cloud and lie close to several other Irrs (at 30 kpc), including the starburst dwarf NGC 4214 and the “compact” irregular NGC 4190 (UGC 7232). Intriguingly, NGC 4190 has been classified as a BCD by Karachentsev et al. (2013) and shows a disturbed H I morphology (see Swaters et al., 2002).
NGC 4214 has a H I disk with a well-defined spiral pattern. The H I disk is strongly warped (see LVF14) and slightly more extended to the North-West. NGC 4214 is in the CVn I cloud and has a small companion galaxy (DDO 113) at a projected distance of 8 kpc. DDO 113 likely is a gas-poor spheroidal (Kaisin & Karachentsev, 2008). This object, indeed, is within the field-of-view of the VLA but no H I emission is detected within the covered velocity range.
NGC 4449 has an extremely extended H I distribution characterized by long filaments with column densities of 1 M⊙ pc-2 (Hunter et al., 1998). A tidally-disturbed companion galaxy is present towards the South-East, but it does not spatially coincide with any gaseous feature (Martínez-Delgado et al., 2012), thus its relation with the outer H I distribution is unclear. NGC 4449 is one of the most massive galaxies in the CVn I cloud (Karachentsev, 2005).
NGC 5253 has a 4 kpc H I tail to the North at km s-1. Our total H I map at resolution is slightly different from that of López-Sánchez et al. (2012) at resolution because we used a Gaussian-smoothed, robust-weighted datacube instead of a natural-weighted datacube. The former cube has a much more regular noise structure than the latter one, providing a better estimate of the 3 column density sensitivity. NGC 5253 is in the CenA/M83 group; its projected distance from the spiral galaxy M83 is 150 kpc (Karachentsev, 2005).
NGC 6789 has a regularly-rotating H I disk with several asymmetric features in the outer parts. This galaxy is in the Local Void and its nearest massive companion (NGC 6946) is at a projected distance of 2.5 Mpc (Drozdovsky et al., 2001).
UGC 4483 has a regularly-rotating H I disk with a small extension to the North-West. This galaxy is in the M81 group and lies between the group center and the NGC 2403 sub-group (Karachentsev et al., 2002).
UGC 6456 has a H I disk that is slightly more extended to the South. The data are affected by Galactic emission, making the total H I map uncertain. Our results are in agreement with those of Simpson et al. (2011). UGC 6456 lies in the periphery of the M81 group (Karachentsev, 2005).
UGC 6541 has a strongly asymmetric H I distribution. Gas emission is detected only in the Northern half of the galaxy. UGC 6541 is located to the North-Western edge of the CVn I cloud (Karachentsev et al., 2003). Another BCD (NGC 3741, Karachentsev et al. 2013) lies at a projected distance of 300 kpc.
UGC 9128 has a relatively regular H I distribution, but the optical and kinematic position angles differ by 30∘. This galaxy appears very isolated; the closest massive galaxy is the Milky Way at Mpc (Karachentsev et al., 2013).
UGCA 290 has a peculiar H I distribution that is off-set with respect to the stellar component. Our total H I map at resolution is less extended than the one obtained by Kovač et al. (2009) using WSRT data at resolution, but the H I fluxes are consistent within the uncertainties, indicating that our total H I map is not missing diffuse H I emission. UGCA 290 may be part of the NGC 4631 group; its projected distance from NGC 4631 is 700 kpc.
I Zw 18 has been studied in detail by Lelli et al. (2012a). The total H I map presented here is slightly different from that in Lelli et al. (2012a) because it was constructed using a mask at 60′′ resolution (instead of 45′′ resolution) for consistency with the other galaxies. The most likely interpretation of this system is an interaction/merger between two (or more) gas-rich dwarfs.
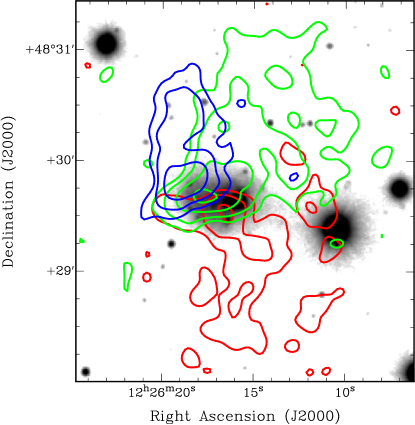
I Zw 36 has an extended, asymmetric H I distribution, that is kinematically-connected to a central rotating disk (see Ashley et al. 2013 and LVF14). Data at 10′′ resolution (see Fig. 8) reveal that the H I emission forms a tail-like structure to the South at receding velocities ( to 310 km s-1; km s-1) and a broad extension to the North near the systemic velocity ( to 290 km s-1), possibly connected to the approaching side of the disk ( to 260 km s-1). There are no optical features associated with the extended gas down to mag arcsec-2. I Zw 36 is in the CVn I cloud.
SBS 1415+437 has an extended, lopsided H I disk. The galaxy is at a relatively large distance (13.6 Mpc), thus it is possible that faint, nearby companions have not been identified by optical surveys.
6 Discussion
In Sect. 3 we found that starburst dwarfs show a large variety of H I morphologies. Several of them have heavily disturbed H I morphologies, characterized by strong asymmetries, long filaments, and/or large offsets between the stellar and H I distributions. Other starburst dwarfs, instead, show minor asymmetries, characterized by H I extensions and/or small tails in the outer parts. In Sect. 4 we introduced the parameter , quantifying the outer H I asymmetry, and measured it for both our sample of starburst dwarfs and a control sample of typical Irrs. We found that starburst dwarfs systematically have more asymmetric H I morphologies that typical Irrs, although there is a “grey area” for where one can find both starburst and non-starburst dwarfs with lopsided H I morphologies. Lopsidedness is a common phenomenon among spirals and irregular galaxies (e.g. Baldwin et al., 1980; Verheijen & Sancisi, 2001; Swaters et al., 2002), and it has been suggested that it may be due to past interactions and/or accretion events (e.g. Sancisi et al., 2008). Alternatively, one may conceive that the outer H I asymmetries are the result of gaseous outflows due to stellar feedback. This latter hypothesis seems unlikely, as we now discuss.
Hydrodynamical simulations show that gaseous outflows generally follow the path of least resistance from the ISM (Mac Low & Ferrara, 1999; D’Ercole & Brighenti, 1999; Cooper et al., 2008) and, thus, develop perpendicularly to the galaxy major axis. Several starburst dwarfs do show diffuse H emission roughly perpendicular to the galaxy major axis (see e.g. Fig. 7 of Lee et al., 2009), which likely traces an outflow (although the H gas generally does not escape from the galaxy potential well; e.g. Martin 1996, 1998; van Eymeren et al. 2009a, b, 2010). The H I gas in the outer regions, instead, often has a tail-like morphology and does not show any preferential direction with respect to the galaxy major axis (see Fig. 1). Moreover, in general there is little (if any) correlation between the H I and H emission in the outer galaxy regions; see e.g. I Zw 18 (Fig. 9 of Lelli et al., 2012a) and NGC 1705 (Fig. 8 of Elson et al., 2013). We also note that, if the outer H I asymmetries were due to stellar feedback, one may expect a correlation between the asymmetry parameter and some SFR indicators, given that a higher star-formation activity would produce stronger outflows and, thus, more asymmetric H I distributions. We found no convincing correlation between and either the SFR surface density or the specific SFR (see Sect. 4.3). For all these reasons, we think that the H I emission in the outer regions is not due to gas outflows, but it indicates that the starburst is triggered by external mechanisms, such as interactions/mergers between gas-rich dwarfs or cold gas accretion from the IGM.
| Name(s) | Properties | References |
|---|---|---|
| II Zw 33 (Mrk 1039) | LSB companion II Zw 33 B | Walter et al. (1997) |
| HS 0822+3542 | LSB companion SAO 0822+3542 | Chengalur et al. (2006) |
| Mrk 324 (UGCA 439) | LSB companion EXG 0123-0040; H I tail? | van Zee et al. (2001) |
| NGC 2537 (Mrk 86) | Companion IC 2233 (Sd); outer H I arm | Matthews & Uson (2008) |
| UM 461/UM 462 | BCD pair with lopsided H I disks | van Zee et al. (1998) |
| Haro 4 (Mrk 26) | Possible interaction with NGC 3510 (Sm) | Bravo-Alfaro et al. (2004) |
| Mrk 108 (IC 2450) | Interacting with NGC 2814 (Sb) NGC 2820 (Sc) | Kantharia et al. (2005) |
| II Zw 70/ II Zw 71 | Interacting pair | Cox et al. (2001) |
| SBS 0335-052 | Interacting pair | Pustilnik et al. (2001); Ekta et al. (2009) |
| SBS 1129+576/577 | Interacting pair | Ekta et al. (2006) |
| II Zw 40 (UGC 116) | Advanced merger | van Zee et al. (1998) |
| IC 10 (UGC 192) | Long H I filaments and plumes | Manthey & Oosterloo (2008) |
| Haro 36 (UGC 7950) | H I filament | Ashley et al. (2013) |
| Mrk 1418 (UGC 5151) | H I plumes and clouds | van Zee et al. (2001) |
| FCC 35 | High-velocity H I complex | Putman et al. (1998) |
| Haro 2 (Mrk 33) | H I extension and small tail/cloud | Thuan et al. (2004) |
| NGC 4861 (UGC 8098) | H I disk extended towards a H I cloud | Thuan et al. (2004) |
| Mrk 900 (NGC 7077) | Lopsided H I disk | van Zee et al. (2001) |
| Mrk 750 | Lopsided H I disk | van Zee et al. (2001) |
| UM 439 (UGC 6578) | Lopsided H I disk | van Zee et al. (1998) |
| UM 323 | Lopsided H I disk, possibly warped | van Zee et al. (2001) |
| UM 38 | Relatively regular H I disk | van Zee et al. (2001) |
| NGC 2915 | Extended, warped H I disk | Meurer et al. (1996); Elson et al. (2010) |
In Sect. 4.3 we found that there is a significant correlation between and the look-back time at the peak of the star-formation activity (see Fig. 6, left). Galaxies hosting an “old” burst (100 Myr) have low values of , while galaxies hosting a “young” burst (100 Myr) have a progressively more asymmetric H I distribution. In particular, galaxies with lopsided H I morphologies () have values of Myr that are comparable with the orbital times in the outer regions (see Fig. 6, right). This suggests that the differential rotation in the outer galaxy regions could have had enough time to partially regularize the H I distribution since the epoch of the interaction/accretion event that possibly triggered the starburst. In particular, galaxies with extended, strongly-warped, and regularly-rotating H I disks, such as NGC 4214 (LVF14) and NGC 2915 (Elson et al., 2010), may represent an advanced stage of the interaction/accretion phenomenon, as it has already been suggested by Sancisi et al. (2008). On the other hand, a galaxy like NGC 1705, which has a warped H I disk that is strongly off-set with respect to the stellar component (see LVF14), may be in an earlier stage where the outer H I gas is still in the process of settling down. This is in agreement with the very recent starburst activity ( Myr) observed in this galaxy (Annibali et al., 2003).
Recent H I studies by Ekta et al. (2008), Ekta & Chengalur (2010), and López-Sánchez et al. (2010) have also highlighted the importance of interaction/accretion events in triggering the starburst in low-mass galaxies. In Table 7, we list further examples of starburst dwarfs with high-quality H I observations. This list is by no means complete. We have, however, carefully inspected the published total H I maps and velocity fields of these galaxies, and report their main properties in Table 7. These galaxies do not have accurate SFHs from HST observations, but are thought to be experiencing a starburst based on their blue colors, high surface brightnesses, and/or strong emission lines. We also have no direct information on the “age” of the starburst. However, considering the observed trend between H I asymmetry and , we are probably observing starburst dwarfs at different stages of the interaction/accretion process. In particular, we distinguish between four main “classes” or “evolutionary stages”:
-
1.
Starburst dwarfs that have a nearby companion ( kpc) but show no sign of strong interactions, such as H I bridges or tails (e.g. II Zw 33, Walter et al. 1997). These systems may either be experiencing a mild tidal interaction or represent a late stage after a fly-by.
- 2.
-
3.
Starburst dwarfs that are relatively isolated and show a heavily-disturbed H I morphology (e.g. IC 10, Manthey & Oosterloo 2008), which may be due to a recent interaction/merger or cold gas accretion from the environment.
- 4.
Our galaxy sample includes starburst dwarfs from all these 4 classes. As we described in Sect. 5, NGC 4214 and NGC 4163 have several nearby companions belonging to the CVn I cloud and, thus, fit into class (i). Grocholski et al. (2008) argued that NGC 1569 and UGCA 290 form a pair of galaxies in the IC 432 group similar to the LMC and the SMC in the Local Group; in this case, NGC 1569 would also belong to class (i). There may be more starburst dwarf in this class, having galaxies at projected distances kpc and differences in their systemic velocities km s-1, but the lack of accurate distance estimates for their potential companions prevents us from unambiguously classifying them (see Sect. 5). I Zw 18, NGC 4449, and NGC 2366 are probably undergoing a minor merger (see Lelli et al. 2012a, Martínez-Delgado et al. 2012, and Sect. 5, respectively) and, thus, belong to class (ii). I Zw 36, UGC 6431, UGCA 290, and NGC 625 can be included in class (iii), whereas UGC 4483, UGC 6456, UGC 9128, and SBS 1415+437 belong to class (iv). NGC 6789 and NGC 5253 are somewhat intermediate between class (iii) and (iv), having .
The observational evidence presented so far indicates that past and on-going interaction/accretion events play an important role in triggering the starburst in low-mass galaxies. Moreover, interaction/mergers between gas-rich dwarfs may provide the mechanism that forms the central concentration of mass observed in starburst dwarfs (Lelli et al., 2012a, b; Lelli et al., 2014). Numerical simulations, indeed, indicate that interactions/mergers between gas-rich dwarfs can lead to an overall contraction of the disk and form a central mass concentration (e.g. Bekki, 2008). We stress, however, that several galaxies in our sample show remarkably symmetric optical morphologies (down to 26 mag arcsec-2), whereas the H I distribution is heavily perturbed (see e.g. I Zw 36 in Fig. 8). To unambiguously identify galaxy interaction as the main triggering mechanism, one would need deep optical observations (down to mag arcsec-2) to search for stellar tidal features associated with the H I features. In the case that stellar tidal features would still remain undetected, the remaining possibility is that starburst dwarfs are directly accreting gas from the IGM. Cold flows of gas are predicted by CDM models of galaxy formation (Kereš et al., 2005; Dekel & Birnboim, 2006). In particular, Kereš et al. (2005) argued that these cold flows might still take place at in low-mass galaxies residing in low-density environments. As we discussed in Sect. 5, most starburst dwarfs in our sample inhabit similar environments as typical Irrs, such as galaxy groups and small associations. Thus, it is unclear why cosmological cold flows would be visible only in starburst dwarfs and not in typical Irrs, unless they are highly stochastic and can rapidly trigger central bursts by bringing large amounts of gas to the bottom of the potential well. It is also unclear what the relation would be between these cold flows and the central concentration of mass (luminous and dark). Three galaxies (NGC 1705, NGC 6789, and UGC 9128), however, seem very isolated and show relatively regular optical morphologies down to R mag arcsec-2. If the regular optical morphologies of these three galaxies are confirmed by deeper optical images, they may represent cases of cosmological gas accretion in the Local Universe.
7 Conclusions
We investigated the distribution and kinematics of the H I gas in the outer regions of nearby starburst dwarf galaxies, using both new and archival data. We considered 18 starburst dwarfs that have been resolved into single stars by HST observations, providing their recent SFHs and starburst timescales. Our main results can be summarized as follows.
-
1.
Starburst dwarfs display a broad range of H I morphologies. Several galaxies show heavily disturbed H I morphologies characterized by large-scale asymmetries, long filaments, and/or strong offsets between the stellar and H I distributions, whereas other galaxies show only minor asymmetries in the outer regions.
-
2.
We defined the parameter to quantify the large-scale H I asymmetry in the outer regions and measured it for our sample of starburst dwarfs and a control sample of typical dwarf irregulars, drawn from the VLA-ANGST survey. We found that starburst dwarfs generally have higher values of than typical irregulars, suggesting that some external mechanism triggered the starburst.
-
3.
We compared the values of with the starburst properties. We found that galaxies hosting a “young” burst (100 Myr) typically have more asymmetric H I morphologies than galaxies hosting an “old” one (100 Myr), further indicating that there is a close link between the outer, disturbed H I distribution and the central, recent star-formation. Galaxies hosting an “old” burst likely had enough time to partially regularize their outer H I distribution, since the “age” of the burst (500 Myr) is comparable with the orbital time in the outer parts.
-
4.
We investigated the nearby environment of the galaxies in our sample. Most of them have a potential perturber at a projected distance kpc, thus the hypothesis of a past interaction cannot be excluded. Three galaxies (NGC 2366, NGC 4449, and I Zw 18) are probably undergoing a minor merger. Another three objects (NGC 1705, NGC 6789, and UGC 9128), instead, seem very isolated and show regular optical morphologies down to R mag arcsec-2, thus they may represent cases of cold gas accretion in the nearby Universe.
Acknowledgements
We are grateful to Renzo Sancisi for sharing his valuable insights with us. We thank Ed Elson, Deidre Hunter, and Angel R. López-Sánchez for providing us with the H I data of NGC 1705, NGC 4449, and NGC 5253, respectively. We also thanks the members of the WHISP, THINGS, LITTLE-THINGS, and VLA-ANGST projects for having made the H I data publicly available. FL acknowledges the Ubbo Emmius bursary program of the University of Groningen and the Leids Kerkhoven-Bosscha Fund. FF acknowledges financial support from PRIN MIUR 2010-2011, project “The Chemical and Dynamical Evolution of the Milky Way and Local Group Galaxies”, prot. 2010LY5N2T.
Appendix A Estimating the noise in a total H I map
In their appendix A, Verheijen & Sancisi (2001) describe how to calculate the noise in a total H I map obtained using a mask on an hanning-tapered datacube, in which all the channel maps are kept during the analysis. Here we derive similar formulas that can be used to construct signal-to-noise maps in 2 different cases: i) a uniform-tapered datacube, as it is the case for the WHISP data and our new WRST and VLA observations; and ii) an online hanning-tapered datacube, in which half of the channel maps are discarded during the observations, as it is the case for the THINGS/LITTLE-THINGS data and other archival VLA observations.
| Channel | … | ||||||||
|---|---|---|---|---|---|---|---|---|---|
| 1/4 | 1/2 | 1/4 | |||||||
| 1/4 | 1/2 | 1/4 | |||||||
| … | … | … | … | ||||||
| 1/4 | 1/2 | 1/4 | |||||||
| 1/4 | 1/2 | 1/2 | 1/2 | 1/2 | … | 1/2 | 1/2 | 1/4 |
Uniform taper
If the observations are made using a uniform velocity taper, the noise in two channel maps will be independent. When uniform-tapered channel maps are added at the spatial position , the noise in the total H I map will increase by a factor , thus . However, before the channel maps are added to form a total H I map, the continuum emission is subtracted, introducing further noise in the channel maps. Here we assume that the continuum map is constructed by averaging and line-free channel maps at the high and low velocity ends of the datacube, respectively. Thus, one has
| (3) |
and the noise in the continuum map is given by
| (4) |
If is the value of a pixel in the uniform-tapered channel map, the line-emission is given by and the noise in is given by
| (5) |
When uniform-tapered and continuum-subtracted channel maps are added, the signal at a position of the total H I map is given by
| (6) |
and the noise is given by
| (7) |
Online hanning taper
If the observations are made using an hanning taper, the datacube is smoothed in velocity and the noise in two adjacent channel maps is no longer independent. When the online hanning smoothing option of the VLA is used, half of the channel maps are discarded. If and are, respectively, the values of a pixel in the uniform-tapered and online hanning-tapered channel maps, one has
| (8) |
and the channel map is discarded during the observations. The remaining channel maps and are not independent, because both contain a quarter of the emission . Thus, when online hanning-smoothed channel maps are added, the noise does not increase by a factor , but by a factor , as we show in the following. The noise in the online hanning smoothed channel maps is equal to (see Verheijen & Sancisi, 2001). The total signal is given by
| (9) |
As illustrated in Table 8, one has
| (10) |
and the noise is given by
| (11) |
The continuum map is now constructed by averaging and line-free channel maps at the high and low velocity ends of the online hanning-tapered datacube, thus the noise in is given by
| (12) |
The line-emission in the channel map is given by , thus the noise in is given by
| (13) |
When online hanning-tapered and continuum-subtracted channel maps are added, the signal at a position of the total H I maps is given by
| (14) |
and the noise at is given by
| (15) |
Note that this equation differs by a factor from the one given by Verheijen & Sancisi (2001), which is valid in the case that all the hanning-tapered channel maps are kept during the data analysis.
References
- Annibali et al. (2013) Annibali F., Cignoni M., Tosi M., van der Marel R. P., Aloisi A., Clementini G., Contreras Ramos R., Fiorentino G., Marconi M., Musella I., 2013, ArXiv e-prints
- Annibali et al. (2003) Annibali F., Greggio L., Tosi M., Aloisi A., Leitherer C., 2003, AJ, 126, 2752
- Ashley et al. (2013) Ashley T., Simpson C. E., Elmegreen B. G., 2013, ArXiv e-prints
- Baldwin et al. (1980) Baldwin J. E., Lynden-Bell D., Sancisi R., 1980, MNRAS, 193, 313
- Bekki (2008) Bekki K., 2008, MNRAS, 388, L10
- Bekki & Freeman (2002) Bekki K., Freeman K. C., 2002, ApJL, 574, L21
- Berg et al. (2012) Berg D. A., Skillman E. D., Marble A. R., van Zee L., Engelbracht C. W., Lee J. C., Kennicutt Jr. R. C., Calzetti D., Dale D. A., Johnson B. D., 2012, ApJ, 754, 98
- Bouchard et al. (2010) Bouchard A., Prugniel P., Koleva M., Sharina M., 2010, A&A, 513, A54
- Bravo-Alfaro et al. (2004) Bravo-Alfaro H., Brinks E., Baker A. J., Walter F., Kunth D., 2004, AJ, 127, 264
- Briggs (1995) Briggs D. S., 1995, in Bulletin of the American Astronomical Society Vol. 27 of Bulletin of the American Astronomical Society, High Fidelity Interferometric Imaging: Robust Weighting and NNLS Deconvolution. pp 1444–+
- Campos-Aguilar & Moles (1991) Campos-Aguilar A., Moles M., 1991, A&A, 241, 358
- Campos-Aguilar et al. (1993) Campos-Aguilar A., Moles M., Masegosa J., 1993, AJ, 106, 1784
- Cannon et al. (2004) Cannon J. M., McClure-Griffiths N. M., Skillman E. D., Côté S., 2004, ApJ, 607, 274
- Chengalur et al. (2006) Chengalur J. N., Pustilnik S. A., Martin J., Kniazev A. Y., 2006, MNRAS, 371, 1849
- Conselice (2003) Conselice C. J., 2003, ApJS, 147, 1
- Cooper et al. (2008) Cooper J. L., Bicknell G. V., Sutherland R. S., Bland-Hawthorn J., 2008, ApJ, 674, 157
- Côté et al. (2000) Côté S., Carignan C., Freeman K. C., 2000, AJ, 120, 3027
- Cote et al. (1997) Cote S., Freeman K. C., Carignan C., Quinn P. J., 1997, AJ, 114, 1313
- Cox et al. (2001) Cox A. L., Sparke L. S., Watson A. M., van Moorsel G., 2001, AJ, 121, 692
- Crone et al. (2002) Crone M. M., Schulte-Ladbeck R. E., Greggio L., Hopp U., 2002, ApJ, 567, 258
- Dalcanton et al. (2009) Dalcanton J. J., Williams B. F., Seth A. C., Dolphin A., Holtzman J., Rosema K., Skillman E. D., Cole A., Girardi L., Gogarten S. M., et al. 2009, ApJS, 183, 67
- Dekel & Birnboim (2006) Dekel A., Birnboim Y., 2006, MNRAS, 368, 2
- del Río et al. (2004) del Río M. S., Brinks E., Cepa J., 2004, AJ, 128, 89
- D’Ercole & Brighenti (1999) D’Ercole A., Brighenti F., 1999, MNRAS, 309, 941
- Drozdovsky et al. (2001) Drozdovsky I. O., Schulte-Ladbeck R. E., Hopp U., Crone M. M., Greggio L., 2001, ApJL, 551, L135
- Ekta et al. (2006) Ekta Chengalur J. N., Pustilnik S. A., 2006, MNRAS, 372, 853
- Ekta et al. (2008) Ekta Chengalur J. N., Pustilnik S. A., 2008, MNRAS, 391, 881
- Ekta & Chengalur (2010) Ekta B., Chengalur J. N., 2010, MNRAS, 403, 295
- Ekta et al. (2009) Ekta B., Pustilnik S. A., Chengalur J. N., 2009, MNRAS, 397, 963
- Elmegreen et al. (2012) Elmegreen B. G., Zhang H.-X., Hunter D. A., 2012, ApJ, 747, 105
- Elson et al. (2010) Elson E. C., de Blok W. J. G., Kraan-Korteweg R. C., 2010, MNRAS, 404, 2061
- Elson et al. (2011) Elson E. C., de Blok W. J. G., Kraan-Korteweg R. C., 2011, MNRAS, 415, 323
- Elson et al. (2013) Elson E. C., de Blok W. J. G., Kraan-Korteweg R. C., 2013, MNRAS, 429, 2550
- Evstigneeva et al. (2007) Evstigneeva E. A., Drinkwater M. J., Jurek R., Firth P., Jones J. B., Gregg M. D., Phillipps S., 2007, MNRAS, 378, 1036
- Firth et al. (2006) Firth P., Evstigneeva E. A., Jones J. B., Drinkwater M. J., Phillipps S., Gregg M. D., 2006, MNRAS, 372, 1856
- Gallagher & Hunter (1987) Gallagher III J. S., Hunter D. A., 1987, AJ, 94, 43
- Gil de Paz et al. (2003) Gil de Paz A., Madore B. F., Pevunova O., 2003, ApJS, 147, 29
- Grocholski et al. (2008) Grocholski A. J., Aloisi A., van der Marel R. P., Mack J., Annibali F., Angeretti L., Greggio L., Held E. V., Romano D., Sirianni M., Tosi M., 2008, ApJL, 686, L79
- Guseva et al. (2003) Guseva N. G., Papaderos P., Izotov Y. I., Green R. F., Fricke K. J., Thuan T. X., Noeske K. G., 2003, A&A, 407, 105
- Holwerda et al. (2013) Holwerda B. W., Pirzkal N., de Blok W. J. G., Blyth S.-L., 2013, MNRAS, 435, 1020
- Holwerda et al. (2011a) Holwerda B. W., Pirzkal N., de Blok W. J. G., Bouchard A., Blyth S.-L., van der Heyden K. J., Elson E. C., 2011a, MNRAS, 416, 2401
- Holwerda et al. (2011b) Holwerda B. W., Pirzkal N., de Blok W. J. G., Bouchard A., Blyth S.-L., van der Heyden K. J., Elson E. C., 2011b, MNRAS, 416, 2415
- Hunter & Elmegreen (2004) Hunter D. A., Elmegreen B. G., 2004, AJ, 128, 2170
- Hunter et al. (2012) Hunter D. A., Ficut-Vicas D., Ashley T., Brinks E., Cigan P., Elmegreen B. G., Heesen V., Herrmann K. A., Johnson M., Oh S.-H., Rupen M. P., Schruba A., Simpson C. E., Walter F., Westpfahl D. J., Young L. M., Zhang H.-X., 2012, AJ, 144, 134
- Hunter et al. (1998) Hunter D. A., Wilcots E. M., van Woerden H., Gallagher J. S., Kohle S., 1998, ApJL, 495, L47
- Iovino et al. (1988) Iovino A., Melnick J., Shaver P., 1988, ApJL, 330, L17
- Izotov & Thuan (1999) Izotov Y. I., Thuan T. X., 1999, ApJ, 511, 639
- Johnson et al. (2012) Johnson M., Hunter D. A., Oh S.-H., Zhang H.-X., Elmegreen B., Brinks E., Tollerud E., Herrmann K., 2012, AJ, 144, 152
- Kaisin & Karachentsev (2008) Kaisin S. S., Karachentsev I. D., 2008, A&A, 479, 603
- Kantharia et al. (2005) Kantharia N. G., Ananthakrishnan S., Nityananda R., Hota A., 2005, A&A, 435, 483
- Karachentsev (2005) Karachentsev I. D., 2005, AJ, 129, 178
- Karachentsev et al. (2002) Karachentsev I. D., Dolphin A. E., Geisler D., Grebel E. K., Guhathakurta P., Hodge P. W., Karachentseva V. E., Sarajedini A., Seitzer P., Sharina M. E., 2002, A&A, 383, 125
- Karachentsev et al. (2004) Karachentsev I. D., Karachentseva V. E., Huchtmeier W. K., Makarov D. I., 2004, AJ, 127, 2031
- Karachentsev et al. (2013) Karachentsev I. D., Makarov D. I., Kaisina E. I., 2013, AJ, 145, 101
- Karachentsev et al. (2003) Karachentsev I. D., Sharina M. E., Dolphin A. E., Grebel E. K., Geisler D., Guhathakurta P., Hodge P. W., Karachentseva V. E., Sarajedini A., Seitzer P., 2003, A&A, 398, 467
- Kennicutt (1998) Kennicutt Jr. R. C., 1998, ARA&A, 36, 189
- Kereš et al. (2005) Kereš D., Katz N., Weinberg D. H., Davé R., 2005, MNRAS, 363, 2
- Kobulnicky & Skillman (1997) Kobulnicky H. A., Skillman E. D., 1997, ApJ, 489, 636
- Kovač et al. (2009) Kovač K., Oosterloo T. A., van der Hulst J. M., 2009, MNRAS, 400, 743
- Lauberts & Valentijn (1989) Lauberts A., Valentijn E. A., 1989, The surface photometry catalogue of the ESO-Uppsala galaxies
- Lee et al. (2009) Lee J. C., Gil de Paz A., Tremonti C., Kennicutt Jr. R. C., Salim S., Bothwell M., Calzetti D., Dalcanton J., Dale D., Engelbracht C., Funes S. J. J. G., Johnson B., Sakai S., Skillman E., van Zee L., Walter F., Weisz D., 2009, ApJ, 706, 599
- Lee et al. (2000) Lee J. C., Salzer J. J., Law D. A., Rosenberg J. L., 2000, ApJ, 536, 606
- Lelli et al. (2014) Lelli F., Fraternali F., Verheijen M., 2014, A&A, 563, A27
- Lelli et al. (2014) Lelli F., Verheijen M., Fraternali F., 2014, A&A, 566, A71
- Lelli et al. (2012a) Lelli F., Verheijen M., Fraternali F., Sancisi R., 2012a, A&A, 537, A72
- Lelli et al. (2012b) Lelli F., Verheijen M., Fraternali F., Sancisi R., 2012b, A&A, 544, A145
- López-Sánchez (2010) López-Sánchez Á. R., 2010, A&A, 521, A63
- López-Sánchez et al. (2010) López-Sánchez A. R., Koribalski B., van Eymeren J., Esteban C., Popping A., Hibbard J., 2010, in Verdes-Montenegro L., Del Olmo A., Sulentic J., eds, Galaxies in Isolation: Exploring Nature Versus Nurture Vol. 421 of Astronomical Society of the Pacific Conference Series, The Environment of Nearby Blue Compact Dwarf Galaxies. p. 65
- López-Sánchez et al. (2012) López-Sánchez Á. R., Koribalski B. S., van Eymeren J., Esteban C., Kirby E., Jerjen H., Lonsdale N., 2012, MNRAS, 419, 1051
- Lotz et al. (2004) Lotz J. M., Primack J., Madau P., 2004, AJ, 128, 163
- Mac Low & Ferrara (1999) Mac Low M., Ferrara A., 1999, ApJ, 513, 142
- Manthey & Oosterloo (2008) Manthey E., Oosterloo T., 2008, in Minchin R., Momjian E., eds, The Evolution of Galaxies Through the Neutral Hydrogen Window Vol. 1035 of American Institute of Physics Conference Series, IC 10-a cosmic bluebottle. pp 156–158
- Marlowe et al. (1999) Marlowe A. T., Meurer G. R., Heckman T. M., 1999, ApJ, 522, 183
- Martin (1996) Martin C. L., 1996, ApJ, 465, 680
- Martin (1998) Martin C. L., 1998, ApJ, 506, 222
- Martínez-Delgado et al. (2012) Martínez-Delgado D., Romanowsky A. J., Gabany R. J., Annibali F., Arnold J. A., Fliri J., Zibetti S., et al. 2012, ApJL, 748, L24
- Mateo (1998) Mateo M. L., 1998, ARA&A, 36, 435
- Matthews & Uson (2008) Matthews L. D., Uson J. M., 2008, AJ, 135, 291
- Maurogordato et al. (1997) Maurogordato S., Proust D., Cappi A., Slezak E., Martin J. M., 1997, A&A Supplement Series, 123, 411
- McQuinn et al. (2010) McQuinn K. B. W., Skillman E. D., Cannon J. M., Dalcanton J., Dolphin A., Hidalgo-Rodríguez S., Holtzman J., Stark D., Weisz D., Williams B., 2010, ApJ, 721, 297
- McQuinn et al. (2012) McQuinn K. B. W., Skillman E. D., Dalcanton J. J., Cannon J. M., Dolphin A. E., Holtzman J., Weisz D. R., Williams B. F., 2012, ApJ, 759, 77
- Méndez & Esteban (2000) Méndez D. I., Esteban C., 2000, A&A, 359, 493
- Méndez et al. (1999) Méndez D. I., Esteban C., Balcells M., 1999, AJ, 117, 1229
- Meurer et al. (1996) Meurer G. R., Carignan C., Beaulieu S. F., Freeman K. C., 1996, AJ, 111, 1551
- Meurer et al. (1998) Meurer G. R., Staveley-Smith L., Killeen N. E. B., 1998, MNRAS, 300, 705
- Noeske et al. (2001) Noeske K. G., Iglesias-Páramo J., Vílchez J. M., Papaderos P., Fricke K. J., 2001, A&A, 371, 806
- Noguchi (1988) Noguchi M., 1988, A&A, 201, 37
- Noordermeer et al. (2005) Noordermeer E., van der Hulst J. M., Sancisi R., Swaters R. A., van Albada T. S., 2005, A&A, 442, 137
- Oh et al. (2008) Oh S., de Blok W. J. G., Walter F., Brinks E., Kennicutt R. C., 2008, AJ, 136, 2761
- Ott et al. (2012) Ott J., Stilp A. M., Warren S. R., Skillman E. D., Dalcanton J. J., Walter F., de Blok W. J. G., Koribalski B., West A. A., 2012, AJ, 144, 123
- Papaderos et al. (2002) Papaderos P., Izotov Y. I., Thuan T. X., Noeske K. G., Fricke K. J., Guseva N. G., Green R. F., 2002, A&A, 393, 461
- Pustilnik et al. (1995) Pustilnik S., Ugryumov A. V., Lipovetsky V. A., Thuan T. X., Guseva N., 1995, ApJ, 443, 499
- Pustilnik et al. (2001) Pustilnik S. A., Brinks E., Thuan T. X., Lipovetsky V. A., Izotov Y. I., 2001, AJ, 121, 1413
- Pustilnik et al. (2001) Pustilnik S. A., Kniazev A. Y., Lipovetsky V. A., Ugryumov A. V., 2001, A&A, 373, 24
- Putman et al. (1998) Putman M. E., Bureau M., Mould J. R., Staveley-Smith L., Freeman K. C., 1998, AJ, 115, 2345
- Salzer (1989) Salzer J. J., 1989, ApJ, 347, 152
- Sancisi et al. (2008) Sancisi R., Fraternali F., Oosterloo T., van der Hulst T., 2008, A&ARv, 15, 189
- Schulte-Ladbeck et al. (2000) Schulte-Ladbeck R. E., Hopp U., Greggio L., Crone M. M., 2000, AJ, 120, 1713
- Schulte-Ladbeck et al. (2001) Schulte-Ladbeck R. E., Hopp U., Greggio L., Crone M. M., Drozdovsky I. O., 2001, AJ, 121, 3007
- Silk et al. (1987) Silk J., Wyse R. F. G., Shields G. A., 1987, ApJL, 322, L59
- Simpson et al. (2011) Simpson C. E., Hunter D. A., Nordgren T. E., Brinks E., Elmegreen B. G., Ashley T., Lynds R., McIntyre V. J., O’Neil E. J., Östlin G., Westpfahl D. J., Wilcots E. M., 2011, AJ, 142, 82
- Skillman et al. (2003) Skillman E. D., Côté S., Miller B. W., 2003, AJ, 125, 593
- Stil & Israel (1998) Stil J. M., Israel F. P., 1998, A&A, 337, 64
- Stil & Israel (2002) Stil J. M., Israel F. P., 2002, A&A, 392, 473
- Swaters & Balcells (2002) Swaters R. A., Balcells M., 2002, A&A, 390, 863
- Swaters et al. (2002) Swaters R. A., van Albada T. S., van der Hulst J. M., Sancisi R., 2002, A&A, 390, 829
- Taylor et al. (1993) Taylor C., Brinks E., Skillman E. D., 1993, AJ, 105, 128
- Taylor et al. (1995) Taylor C. L., Brinks E., Grashuis R. M., Skillman E. D., 1995, ApJS, 99, 427
- Taylor et al. (1996) Taylor C. L., Thomas D. L., Brinks E., Skillman E. D., 1996, ApJS, 107, 143
- Telles & Maddox (2000) Telles E., Maddox S., 2000, MNRAS, 311, 307
- Telles & Terlevich (1995) Telles E., Terlevich R., 1995, MNRAS, 275, 1
- Terlevich et al. (1991) Terlevich R., Melnick J., Masegosa J., Moles M., Copetti M. V. F., 1991, A&A Supplement Series, 91, 285
- Thilker et al. (2010) Thilker D. A., Bianchi L., Schiminovich D., Gil de Paz A., Seibert M., Madore B. F., Wyder T., Rich R. M., Yi S., Barlow T., Conrow T., Forster K., Friedman P., Martin C., Morrissey P., Neff S., Small T., 2010, ApJL, 714, L171
- Thuan et al. (2004) Thuan T. X., Hibbard J. E., Lévrier F., 2004, AJ, 128, 617
- Thuan & Izotov (2005) Thuan T. X., Izotov Y. I., 2005, ApJS, 161, 240
- Trentham et al. (2001) Trentham N., Tully R. B., Verheijen M. A. W., 2001, MNRAS, 325, 385
- van Eymeren et al. (2010) van Eymeren J., Koribalski B. S., López-Sánchez Á. R., Dettmar R.-J., Bomans D. J., 2010, MNRAS, 407, 113
- van Eymeren et al. (2009a) van Eymeren J., Marcelin M., Koribalski B., Dettmar R.-J., Bomans D. J., Gach J.-L., Balard P., 2009a, A&A, 493, 511
- van Eymeren et al. (2009b) van Eymeren J., Marcelin M., Koribalski B. S., Dettmar R.-J., Bomans D. J., Gach J.-L., Balard P., 2009b, A&A, 505, 105
- van Zee et al. (2001) van Zee L., Salzer J. J., Skillman E. D., 2001, AJ, 122, 121
- van Zee et al. (1998) van Zee L., Skillman E. D., Salzer J. J., 1998, AJ, 116, 1186
- Verheijen & Sancisi (2001) Verheijen M., Sancisi R., 2001, A&A, 370, 765
- Walter et al. (2008) Walter F., Brinks E., de Blok W. J. G., Bigiel F., Kennicutt Jr. R. C., Thornley M. D., Leroy A., 2008, AJ, 136, 2563
- Walter et al. (1997) Walter F., Brinks E., Duric N., Klein U., 1997, AJ, 113, 2031
- Weisz et al. (2011) Weisz D. R., Dalcanton J. J., Williams B. F., Gilbert K. M., Skillman E. D., Seth A. C., Dolphin A. E., McQuinn K. B. W., Gogarten S. M., Holtzman J., Rosema K., Cole A., Karachentsev I. D., Zaritsky D., 2011, ApJ, 739, 5