Novel Itinerant Antiferromagnet TiAu
Itinerant and local moment magnetism have substantively different origins, and require distinct theoretical treatment. A unified theory of magnetism has long been sought after, and remains elusive, mainly due to the limited number of known itinerant magnetic systems. In the case of the two such examples discovered several decades ago, the itinerant ferromagnets ZrZn2 1 and Sc3In2, the understanding of their magnetic ground states draws on the existence of 3d electrons subject to strong spin fluctuations. Similarly, in Cr3, an elemental itinerant antiferromagnet (IAFM) with a spin density wave (SDW) ground state, its 3d character has been deemed crucial to it being magnetic. Here we report the discovery of the first IAFM compound with no magnetic constituents, TiAu. Antiferromagnetic order occurs below a Néel temperature T 36 K, about an order of magnitude smaller than in Cr, rendering the spin fluctuations in TiAu more important at low temperatures. This new IAFM challenges the currently limited understanding of weak itinerant antiferromagnetism, while providing long sought-after insights into the effects of spin fluctuations in itinerant electron systems.
TiAu has been reported to form in three distinct crystal structures, cubic Pmm 4, tetragonal P4/nmm 5 and orthorhombic Pmma 4, posing an inherent difficulty in synthesizing it as a single phase. It comes as no surprise then, that no reports of physical properties of TiAu exist. Here we report the magnetic and electronic properties of phase pure orthorhombic TiAu, and show that it is a new itinerant electron antiferromagnet.
The first evidence for the antiferromagnetic ground state is the cusp around 36 K in the temperature-dependent magnetic susceptibility , shown in Fig. 1 (left axis). By analogy with local moment antiferromagnets (AFMs), the TiAu zero-field-cooled and field-cooled data are indistinguishable. The value of the temperature-independent Pauli susceptibility, calculated from the magnetic density of states 0.210-3 emu mol-1, agrees well with the experimental one MH 0.310-3 emu mol-1. Upon warming above the Néel temperature, the inverse susceptibility (right axis, Fig. 1) is linear in temperature up to 800 K. Such linear T dependence of H/M has been long considered the hallmark of local moment magnetism, until it was observed in the weak itinerant ferromagnets (IFMs) without local moments, ZrZn2 1 and Sc3In 2. Puzzling at first, the origin of this behavior was reconciled in the case of IFMs, when spin fluctuation effects were considered by Moriya 6, 7. The self-consistent renormalization theory unified the local and itinerant pictures of ferromagnetism, and postulated a new origin for the Curie-Weiss-like susceptibility in the latter, as the interactions of the spatially extended modes of spin fluctuations 8, 9. TiAu however is an IAFM, and no existing theory accounts for an itinerant antiferromagnetic ground state if neither Ti nor Au have conventional local moments. XPS analysis suggests that Ti is close to the non-magnetic oxidation state (see Supplementary Material). This is striking in light of the high magnetic volume fraction observed in the muon spin relaxation measurements presented below, which, together with the single phase neutron and XPS patterns in Figs. SM1 and SM2 in the Supplementary Material, indicates that the observed magnetic behavior is indeed intrinsic. Therefore Pmma TiAu is the first IAFM compound with no magnetic constituents, with the magnetic ground state strongly affected by spin fluctuations.
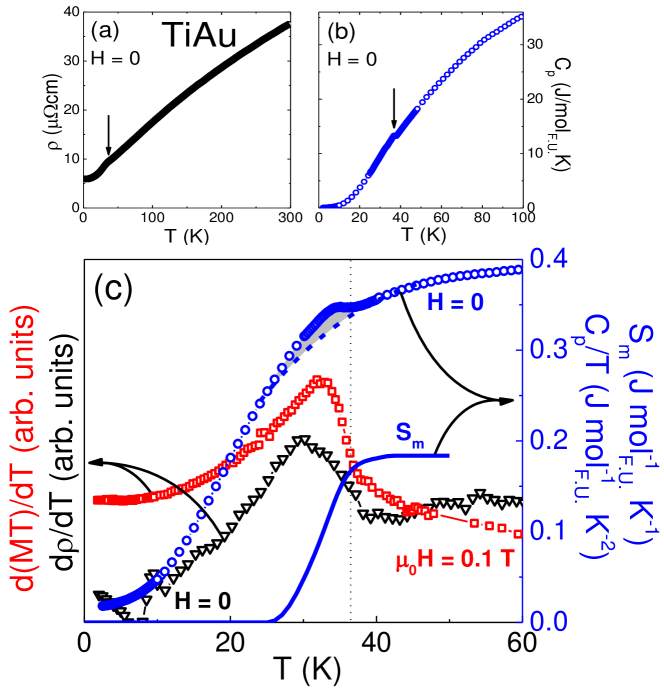
Remarkable for a weak itinerant (ferro- or antiferro-) magnet, the electrical resistivity (Fig. 2a) and specific heat data (Fig. 2b) also show signatures of the phase transition around 36 K. The data are typical of a good metal, decreasing nearly linearly from room temperature down to 40 K. A drop of about 10%, similar to the loss of spin-disorder scattering, occurs at TN (Fig. 2a). Although often the gap opening associated with the SDW ordering results in a resistivity increase, a similar drop was observed in BaFe2As2 single crystals 10. In the absence of local moment ordering, the decrease in the resistivity at TN results from the balance of the loss of scattering due to Fermi surface nesting (see below) and the gap opening due to the SDW AFM state. At the same temperature in TiAu, a small peak becomes visible in the specific heat data (Fig. 2b), such that in this AFM metal can be determined, as shown by Fisher 11, 12, from peaks in (most visible in /T), and (Fig. 2c). Distinguishing between local and itinerant moment magnetism is inherently difficult, especially in the nearly unexplored realm of IAFMs. It is therefore striking that in TiAu, abundant evidence points towards its itinerant magnetic moment character. The fact that the peak in is not as strong as the Fisher prediction 11 is one such argument favoring the itinerant moment scenario in TiAu. Another argument is the small magnetic entropy Sm (grey area, Fig. 2c) associated with the transition (solid blue line, Fig. 2c). Even though the Sm calculated after assuming a polynomial non-magnetic Cp around the transition (dashed line, Fig. 2c) is an underestimate, it amounts to only 0.2 J mol-1 K-1 or 3 ln.
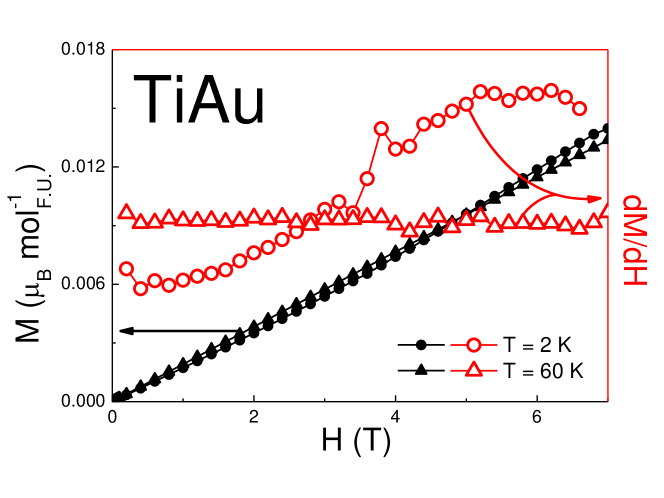
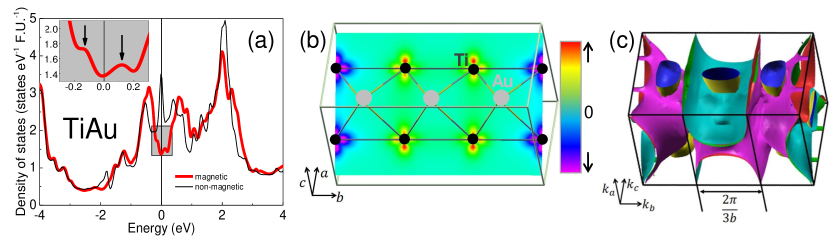
Despite the remarkably large paramagnetic moment , derived from the Curie-Weiss-like fit of the inverse susceptibility (Fig. 1a, right axis), the field-dependent magnetization does not saturate up to 7 T, and the maximum measured magnetization is only 0.01 (Fig. 3). A closer look at the low temperature reveals a weak metamagnetic transition starting around T for K (circles, Fig. 3). This is most apparent in the derivative (open symbols) rather than in the as-measured isotherms (full symbols), with the latter nearly indistinguishable well below ( K) and above ( K) the magnetic ordering temperature. It has been shown by Sandeman et. al. 13 that, within the Stoner theory, the presence of a sharp double peak structure in the electronic DOS sufficiently close to the Fermi level results in a metamagnetic transition. The argument requires that the paramagnetic Fermi level lie in between the two peaks of the DOS, and this is indeed revealed by the band structure calculation for TiAu, shown in the inset of Fig. 5a below. It results that, as the Fermi sea is polarized by the applied magnetic field , the majority and minority spin Fermi levels feel the effect of the two DOS peaks at different values of induced magnetization. The DOS peak that is closest to the Fermi level will lead to a sharp increase (decrease) in the population of the majority (minority) spin band, resulting in a metamagnetic transition.
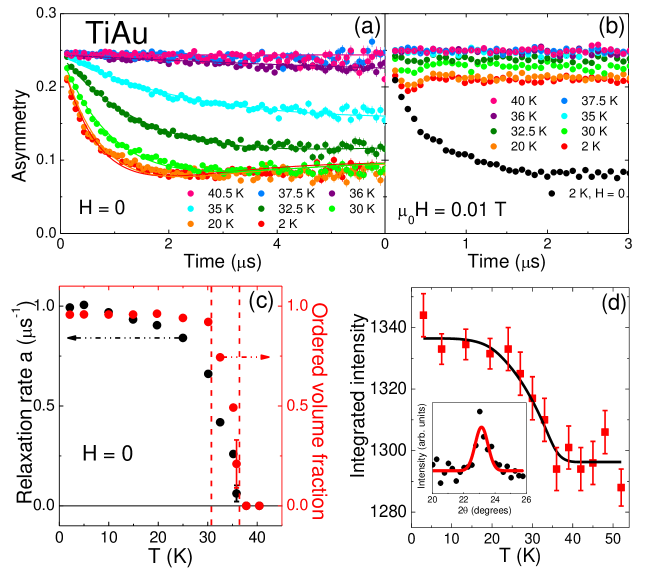
Muon spin relaxation (SR) data shown in Fig. 4 unambiguously confirm the static magnetic order developing in the full volume fraction, with the transition temperature corresponding to the anomaly in the magnetic susceptibility, resistivity and specific heat shown in Fig. 2c. For temperatures above 35 K, the total asymmetry undergoes a negligibly small relaxation, signaling lack of static magnetic order (Fig. 4a). In the time spectra observed in zero field (ZF), a fast decaying front end begins to develop around 35 K, and becomes more pronounced for lower temperatures. This early time decay results from the build up of static internal field, since a small longitudinal field (LF), T, eliminates this relaxation via the decoupling effect (Fig. 4b). The time spectra in ZF are fitted with the relaxation function, expected for a Lorentzian distribution of local fields 9:
| (1) |
where represents the volume fraction with static magnetic order. As shown in the Supplementary Material, a slightly better fit can be obtained by a phenomenological function composed of the sum of “two exponential” terms; but current analysis is more applicable since it can be directly compared with SR results in other systems, as shown in Table SM1 in Supplementary Material. The temperature dependence of the relaxation rate and the magnetic volume fraction are shown in Fig. 4c. A reasonably sharp transition occurs below TN = 36 K to a state with 100 ordered volume, preceeded on cooling by a small temperature region around TN characterized by the finite volume fraction , which suggests co-existence of ordered and paramagnetic volumes in real space via phase separation.
A remarkable feature found in both zero field (ZF) and longitudinal field (LF) time spectra is the absence of dynamic relaxation, expected for critical slowing down of spin fluctuations around TN. Such an effect should have resulted in the relaxation of the asymmetry measured in T, since this LF can eliminate the effect of static magnetism, while dynamic effects survive in a small LF. Together with the ZF relaxation function (Eq. 1) which solely involves static effects, the present data indicate complete absence of dynamic critical behavior. Although occuring in a limited temperature region, the aforementioned phase separation indicates that the transition is likely first-order, without dynamic critical behavior. As shown in Table SM1 (Supplementary Material), similar absence of dynamic critical behavior associated with phase separation was observed in SR studies of the itinerant helimagnet MnSi in an applied pressure of 13 - 15 kbar 10, near the pressure-tuned quantum crossover to the paramagnetic phase. Such tendencies were also seen in the itinerant ferromagnet (Sr,Ca)RuO3 close to the disappearance of static magnetic order around a Ca concentration of 0.7 11. The first-order transition may be a generic feature of weak magnetic order in itinerant-electron systems 17.
As Table SM1 (Supplementary Material) shows, the magnitude of the internal magnetic field in TiAu in the ordered state is remarkably small, compared to SR results in other itinerant electron systems, dilute alloy spin glasses or the incommensurate SDW system (Sr1.5Ca0.5)RuO4 12. Although this indicates a very small ordered moment in TiAu, it is not possible to estimate the moment size since the hyperfine coupling constant could depend strongly on the assumption of the location of muon sites. The lineshape of the ZF SR data in Eq. (1) is obtained for the case of dilute-alloy spin glasses where the local field at the muon site varies due to different distances to the moment site 9. However, the same lineshape was also observed in (Sr1.5Ca0.5)RuO4 in which incommensurate SDW order was recently confirmed by neutron scattering. Therefore, it is difficult to determine spin structure of the system from the present data alone.
Neutron diffraction measurements above (T = 60 K) and below (T = 2 K) the ordering temperature (Supplementary Material) show virtually indistinguishable patterns. However, a magnetic peak (inset, Fig. 4d) in the low temperature data is revealed by the difference between the two measurements, consistent with long range magnetic order and a small itinerant moment ordering at = 36(2) K. The magnitude of the itinerant moment is estimated to be 0.15 /Ti, assuming a spin direction perpendicular to the axis. Together with the present SR data, that show a magnetic phase fraction of 100, these results eliminate the possibility that the observed magnetism is due to dilute magnetic impurities or a minority phase. These arguments demonstrate that the magnetism of the present system is due to a generic feature of TiAu.
Of particular interest is the comparison between the experimental evidence for the antiferromagnetic order in TiAu with the theoretical results from band structure calculations. A number of possible magnetic configurations were considered: ferromagnetic (FM), AFM SDW with modulation vectors (AFM) and (AFM). Their energies relative to the non-magnetic state were estimated to be meV/Ti, meV/Ti and meV/Ti, respectively. These energy values suggest that AFM1 would be the ground state configuration, while the neutron diffraction data show a wavevector = (Fig. 4d), which corresponds to the AFM2 state. We note that the calculated energy difference between the AFM1 and AFM2 states is small, 12 meV/Ti, comparable to the accuracy threshold of the spin-polarized DFT calculation. Furthermore, the calculation yields a small ordered magnetic moment for all surveyed configurations, /Ti /Ti, reflecting the itinerant nature of the ordered moment. Given that neutron scattering measurements estimate the ordered magnetic moment in TiAu to be 0.15 /Ti, it appears that the DFT calculation overestimates the moment. This overestimate in TiAu could be explained by strong spin fluctuations which cannot be accounted for by the DFT calculations. The same problem was also encountered in Fe pnictides, which are also itinerant SDW AFM compounds 19, 20. In the case of TiAu this may be remedied by future DMFT calculations.
The Fermi surface of the non-magnetic TiAu (Fig. 5c) exhibits four half-cylindrical surfaces with large nearly nested regions in the direction. These are more two dimensional than the nested electron-hole pockets in Cr 3, the well-known elemental antiferromagnet. This may explain the considerably larger drop in the relative magnetic susceptibility MM at TN in TiAu compared to Cr, where M/M = [M - M/M. In TiAu, M/M is 20, nearly five times larger than in Cr 3. In the latter, the small magnetization decrease at TN had been attributed to the small spin susceptibility (and not the larger orbital component) being affected by the gap associated with the SDW transition. Conversely, the larger magnetization change in TiAu might indicate a sizable effect on the orbital magnetization, as the SDW transition is now associated with more two dimensional nesting than that in Cr.
Overall, our data convincingly show that TiAu is a new IAFM compound, the first of its kind, and analogous to the only two IFMs with no magnetic elements, Sc3In and ZrZn2. With ample evidence for the itinerant character of the magnetic state in TiAu, including the small magnetic moment in the ordered state compared to the paramagnetic moment, small magnetic entropy at TN, it is readily apparent that strong spin fluctuations are at play in this novel magnetic system. The exact role of the spin fluctuations, their strength, as well as the details of the magnetic structure in the ordered state, remain to be fully elucidated with further experiments. Additionally, doping experiments are underway 21 and seem to cast the magnetism in TiAu as robust albeit extremely complex. Ultimately, the search for IAFM materials appears to be a promising avenue for furthering our understanding of the complex magnetism, and providing the unifying picture for local and itinerant moment magnetism.
METHODS: Polycrystalline samples of TiAu were prepared by arcmelting, with mass losses no more than 0.3 %. The hardness of the arcmelted samples rendered powder x-ray diffraction experiments difficult, and therefore x-ray diffraction data were collected at room temperature off the cross-section (about 3 mm in diameter) of cut and polished specimens using a custom 4-circle Huber diffractometer with graphite monochromator and analyzer in non-dispersive geometry, coupled to a Rigaku rotating anode source producing CuK radiation. X-ray photoemission spectroscopy was performed on the polished surface of the TiAu sample, using an XPS Phi Quantera spectrometer with a monochromatic Al x-ray source and Ar ion sputtering gun, used to cleanse the surface of contaminants. The alignment was checked by comparing the binding energy of the C peak to the published one 7. More details can be found in the Supplementary Material.
DC magnetization was measured in a Quantum Design (QD) Magnetic Property Measurement System (MPMS) from 2 K to 400 K. At temperatures above 400 K, the magnetization data were collected using the Vibrating Sample Magnetometer (VSM) option of a QD Physical Property Measurement System (PPMS) equipped with an oven. Specific heat using an adiabatic relaxation method, and four-probe DC resistivity measurements from 2 K to 300 K were carried out in the QD PPMS environment.
Zero-field and longitudinal-field (up to T) muon spin relaxation measurements were performed at the M20 channel of TRIUMF, Vancouver, Canada. The cut TiAu samples of thickness around 0.1 cm and area of about 3.5 cm2 were mounted on a silver foil and oriented perpendicular to the direction of the incoming muons. For all experiments the beam momentum was 28 MeV/, with muons polarized along the flight direction.
For the neutron diffraction measurements the sample was sealed with helium exchange gas and mounted in a closed cycle refrigerator with a base temperature of 2.6 K. To search for magnetic scattering the high intensity/coarse resolution BT-7 spectrometer was employed in two-axis mode, with a fixed initial neutron energy of 14.7 meV ( = 2.369 Å) and collimator (full-width-half-maximum) configuration open - PG(002) monochromator - 80′ - sample - 80′ radial-collimator - position-sensitive detector 23. To characterize the sample and search for possible structural changes associated with the magnetic phase transition the BT-1 high resolution powder diffractometer was used. Collimators of 15′, 20′ and 7′ were used before and after the Cu (311) monochromator ( = 1.5401 Å) and after the sample, respectively, and data were collected in steps of 0.05∘in the 2 range of 3∘ to 168∘. The refinements were determined by the Rietveld method with the General Structure Analysis System software, with the results available in the Supplementary Material.
Band structure calculations were performed using the full-potential linearized augmented plane-wave method implemented in the WIEN2K package 24. The PBE-GGA was used as the exchange potential, the default generalized gradient approximation for the exchange correlation potential in WIEN2K 15, as described in more detail in the Supplementary Material. The lattice parameters and atomic positions were determined from both neutron and x-ray diffraction and are reported in the Supplementary Material.
References
- 1 Matthias, B. T. & Bozorth, R. M. Ferromagnetism of a zirconium-zinc compound. Physical Review 109, 604 (1958).
- 2 Matthias, B. T., Clogston, A. M., Williams, H. J., Corenzwit, E. & Sherwood, R. C. Ferromagnetism in solid solutions of scandium and indium. Physical Review Letters 7, 7 (1961).
- 3 Fawcett, E. Spin-density-wave antiferromagnetism in chromium. Reviews of Modern Physics 60, 209 (1988).
- 4 Donkersloot, H. C. & van Vucht, J. H. N. Martensic transformations in gold-titanium, palladium-titanium and platinum-titanium alloys near the equiatomic composition. Journal of the Less-Common Metals 20, 83 (1970).
- 5 Schubert, K., Meissner, H. G., Poetzschke, M., Rossteutscher, W. & Stolz, E. Einige strukturdaten metallischer phasen VII. Naturwissenschaften 49, 57 (1962).
- 6 Moriya, T. & Kawabata, A. Effect of spin fluctuations on itinerant electron ferromagnetism. Journal of Physical Society of Japan 34, 639 (1973).
- 7 Moriya, T. & Kawabata, A. Effect of spin fluctuations on itinerant electron ferromagnetism II. Journal of Physical Society of Japan 35, 669 (1973).
- 8 Moriya, T. Spin Fluctuations in Itinerant Electron Magnetism (Springer - Verlag, Berlin, 1985).
- 9 Hasegawa, H. & Moriya, T. Effect of spin fluctuations on itinerant electron antiferromagnetism. Journal of the Physical Society of Japan 36, 1542 (1974).
- 10 Wang, X. F. et al. Anisotropy in the electrical resistivity and susceptibility of superconducting BaFe2As2 single crystals. Physical Review Letters 102, 117005 (2009).
- 11 Fisher, M. E. Relation between the specific heat and susceptibility of an antiferromagnet. Philosophical Magazine 7, 1731 (1962).
- 12 Fisher, M. E. & Langer, J. S. Resistive anomalies at magnetic critical points. Physical Review Letters 20, 665 (1968).
- 13 Sandeman, K., Lonzarich, G. & Schofield, A. Ferromagnetic superconductivity driven by changing Fermi surface topology. Physical Review Letters 90, 167005 (2003).
- 14 Uemura, Y. J., Yamazaki, T., Harshman, D. R., Senba, M. & Ansaldo, E. J. Muon-spin relaxation in AuFe and CuMn spin glasses. Physical Review B 31, 546 (1985).
- 15 Uemura, Y. J. et al. Phase separation and suppression of critical dynamics at quantum transitions of itinerant magnets: MnSi and (Sr1-xCax)RuO3. Nature Physics 3, 29 (2007).
- 16 Gat-Malureanu, I. M. et al. Muon spin relaxation and susceptibility measurements of an itinerant-electron system Sr1-xCaxRuO3: quantum evolution from ferromagnet to paramagnet. Physical Review B 84, 224415 (2011).
- 17 Belitz, D. & Kirkpatrick, T. R. First order transitions and multicritical points in weak itinerant ferromagnets. Physical Review Letters 82, 4707 (1999).
- 18 Carlo, J. P. et al. New magnetic phase diagram of (Sr, Ca)2RuO4. Nature Materials 11, 323 (2012).
- 19 de la Cruz, C. et al. Magnetic order close to superconductivity in the iron-based layered LaO1-xFxFeAs systems. Nature 453, 899 (2008).
- 20 Ma, F., Lu, Z. & Xiang, T. Arsenic-bridged antiferromagnetic superexchange interactions in lafeaso. Physical Review B 78, 224517 (2008).
- 21 Svanidze, E., Besara, T., Siegrist, T., Han, K. & Morosan, E. (in preparation).
- 22 NIST X-ray Photoelectron Spectroscopy Database. National Institute of Standards and Technology, Gaithersburg (http://srdata.nist.gov/xps/).
- 23 Lynn, J. W. et al. Double focusing thermal triple axis spectrometer at the NCNR. Journal of Research of NIST 117, 61 (2012).
- 24 Blaha, P. K., Schwarz, K., Madsen, G., Kvasnicka, D. & Luitz, J. WIEN2K package (http://www.wien2k.at).
- 25 Perdew, J. P., Burke, K. & Ernzerhof, M. Generalized gradient approximation made simple. Physical Review Letters 77, 3865 (1996).
ACKNOWLEDGEMENTS: We would like to thank M. B. Maple, P. Dai and M. Foster for useful discussions. The work at Rice was supported by NSF DMR 0847681 (E.M. and E.S.), AFOSR MURI (J.K.W.) and the Welch Foundation grant C-1818 (A.H.N.). Work at Brookhaven National Laboratory (M.B.G. and M.C.A.) was carried out under the auspices of the US Department of Energy, Office of Basic Energy Sciences, under Contract No. DE-AC02-98CH1886. T.B. and T.S. are supported by the U.S. Department of Energy, Office of Basic Sciences under Contract No. DE-SC0008832, the State of Florida and Florida State University. Work at Columbia and TRIUMF (L.L., B.F. and Y.J.U.) is supported by NSF grants DMR-1105961 and OISE-0968226 (PIRE), REIMEI project from JAEA, Japan, and the Friends of Todai Inc. Foundation. The authors thank Z. Deng, T. Munsie, T. Medina and G. Luke for assistance and discussions on SR measurements. The identification of any commercial product or trade name does not imply endorsement or recommendation by the National Institute of Standards and Technology.
AUTHOR CONTRIBUTIONS: E.M. designed the study, E.S. prepared the samples, performed susceptibility, specific heat, resistivity and x-ray photoemission spectroscopy measurements. E.M and E.S. performed the data analysis and wrote the manuscript with contributions from all authors. J.K.W. and A.N. performed band structure calculations and analysis. T.B. and T.S. were responsible for x-ray measurements and structural characterization. L.L., B.F. and Y.J.U. performed muon spin relaxation measurements, M.B.G. and M.C.A. measured the high-temperature magnetization, J.W.L. and Q.H. carried out neutron diffraction experiments and analysis.
COMPETING INTERESTS: The authors declare that they have no competing financial interests.
CORRESPONDENCE: Correspondence and requests for materials should be addressed to E.M. at emorosan@rice.edu.
I Supplementary Material
II I. X-ray photoemission spectroscopy
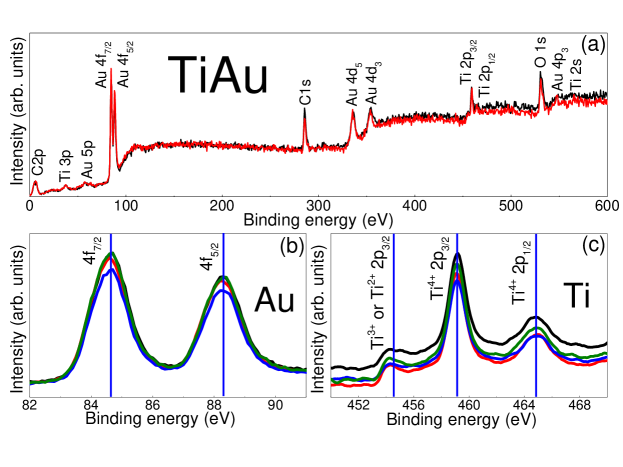
X-ray photoemission spectroscopy (XPS) is a technique extremely sensitive in resolving the elemental composition1. O and C peaks can often be present in XPS spectra 1, a consequence of sample preparation. The rest of the peaks in Fig. SM6 correspond to Ti and Au, confirming the purity of the 1:1 phase, consistent with neutron (below) and xray (not shown) diffraction data. XPS is also employed in determining the valence of elements in many compounds 2, 3, 4, 5. Fig. SM6b reveals that the binding energy of Au is close to 85 eV, suggesting that Au is close to a Au1+ state 6. The large energy absorption of Ti does not allow for high resolution measurements, limiting the number and quality of peaks that can be successfully analyzed. In TiAu, the binding energy for the most pronounced Ti line is split into two peaks, one at eV (for Ti2+ or Ti3+) 7 and another one at eV (Ti4+) 7, as shown in Fig. SM6c. A comparison of the areas under the respective curves suggests the valence of Ti to be . In this itinerant magnet, the XPS results showing a small d electron contribution are consistent with the small itinerant moment ordering indicated by SR and neutron measurements (main text), and rule out the presence of a local moment in TiAu.
III II. Structural analysis
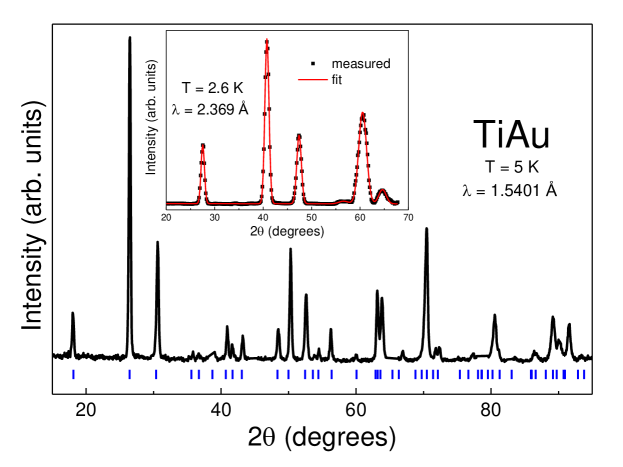
Neutron diffraction data were collected on the BT-1 powder diffractometer and BT-7 thermal triple-axis spectrometer at the NIST Center for Neutron Research. While BT-1 data were used for the crystallographic analysis, a magnetic peak corresponding to the (0, 1/2, 0) was observed in the BT-7 data (see main text). The BT-1 diffraction pattern recorded at K (black) is shown in Fig. SM7 with all peaks identified as the orthorhombic TiAu phase (vertical marks). The inset shows the pattern measured on BT-7 (squares) at K along with Gaussian peak fits (line). The results of structural refinements of the data below ( K) and above ( K) as well as those obtained from room temperature x-ray diffraction are summarized in Table SM II.
| Neutron diffraction | X-ray diffraction | ||
| Temperature (K) | |||
| Lattice parameters | |||
| a (Å) | 4.6221 | 4.6220 | 4.6323 |
| b (Å) | 2.9145 | 2.9166 | 2.9489 |
| c (Å) | 4.8970 | 4.8959 | 4.8855 |
| Atomic positions | |||
| Ti | (0.2500, 0.0000, 0.3110) | (0.2500, 0.0000, 0.3082) | (0.2500, 0.0000, 0.3133) |
| Au | (0.2500, 0.5000, 0.8176) | (0.2500, 0.5000, 0.8176) | (0.2500, 0.5000, 0.8202) |
IV III. Muon spin relaxation
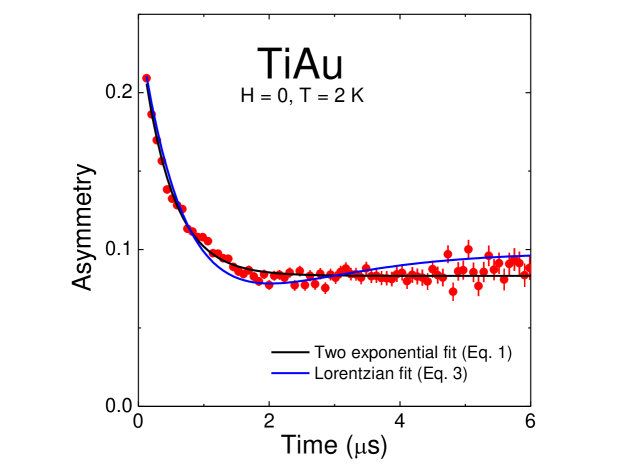
The initial fit of the muon spin relaxation data included two simple exponential relaxing components, yielding the black curve shown in Fig. SM8. The asymmetry function had the following form:
| (2) |
However, considering the polycrystalline nature of our sample, the isotropy of overall local magnetic field dictates 1/3 of all muons to have spin parallel to the local field, hence showing no relaxation arising from the random static magnetic field in the sample. In a system with randomly oriented, dense, and static magnetic moments, a Gaussian Kubo-Toyabe relaxation function 8 is usually expected:
| (3) |
while in dilute spin systems a corresponding Lorentzian relaxation function is due to the Lorentzian internal field distribution 9:
| (4) |
For the polycrystalline TiAu sample a Lorentzian function is more appropriate and yields a better fit, shown in Fig. SM8 (blue line).
| Pressure | Chemical | Relaxation | Precession | Ordered | Ground | Ordered | Transition | Dynamical | Reference | |
| composition | rate () | frequency | volume | state | moment | temperature | critical | |||
| (kbar) | 111Generally scales as 2 s | (MHz) | () (%) | ( F.U.-1) | range (K) | behavior | ||||
| TiAu | 0 | 1 | 100 | AFM | 33-38 | no | Present | |||
| SDW | work | |||||||||
| MnSi | 0 | 12 | 100 | Helical | 0.4 | 29 | yes | [10] | ||
| MnSi | 13-15 | 11 | 20-80 | Helical | 0.4 | 5, 10 | no | [10] | ||
| SrRuO3 | 0 | 80 | 15, 30 | 100 | FM | 0.7 | 160 | yes | [11] | |
| (Sr, Ca)RuO3 | 0 | Ca0.6-0.7 | 20 | 40-60 | FM | 0.1-0.2 | 25 | weak | [11] | |
| (Sr, Ca)2RuO4 | 0 | Ca1.5Sr0.5 | 8 | 100 | I-SDW | 0.2-0.3 | 8 | yes | [12] | |
| Cu(Mn) | 0 | 1% Mn | 10 | 100 | Spin | 0.04 | 10 | yes | [9] | |
| glass | (4 per Mn) | [9] | ||||||||
| BaTi2(As, Sb)2O | 0 | 0.1-0.2 | CDW222Recently confirmed (unpublished) | [13] | ||||||
| (NDB)333NDB: nuclear dipolar broadening |
V IV. Band structure calculations
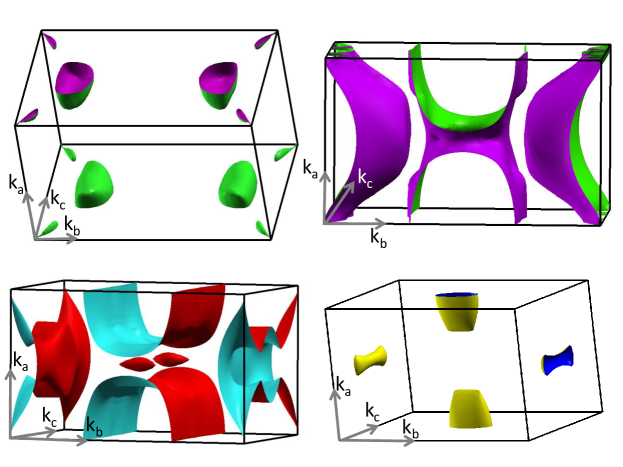
Band structure calculations were performed using full-potential linearized augmented plane wave (FP-LAPW) method implemented in the WIEN2K package 14. PBE-GGA was used as the exchange potential, as the default suggestion by WIEN2K 15. A 101010 k-point grid was used, and shift away from high symmetry directions was allowed. The convergence criterion for force is 1 mRyd/a.u. (1 Ryd = 13.6 eV), with the residual force for the Q = (0, 2b/3, 0) state less than 3.5 mRyd/a.u. (or 90 meV/Å). For the density of states plot, the Gaussian broadening was used, with a broadening factor of 3 mRyd. In order to make the Fermi surface plot (shown in Fig. 5c) easier to read, a separated Fermi surface plot for the different bands in shown in Fig. SM9.
References
- 1 Chusuei, C. C. & Goodman, D. W. X-ray Photoelectron Spectroscopy (Academic Press, NY, 2002).
- 2 Dudy, L. et al. Yb valence change in Ce1-xYbxCoIn5 from spectroscopy and bulk properties. Physical Review B 88, 165118 (2013).
- 3 Kitagawa, H., Kojima, N. & Nakajima, T. Studies of mixed-valence states in three-dimensional halogen-bridged gold compounds, Cs2Au′Au′′′X6, (X= Cl, Br or I). Part 2: x-ray photoelectron spectroscopic study. Journal of the Chemical Society, Dalton Transactions 11, 3121 (1991).
- 4 Marshall, M. S. J., Newell, D. T., Payne, D. J., Egdell, R. G. & Castell, M. R. Atomic and electronic surface structures of dopants in oxides: STM and XPS of Nb- and La-doped SrTiO3(001). Physical Review B 83, 035410 (2011).
- 5 Novotny, Z. et al. Ordered array of single adatoms with remarkable thermal stability: Au/Fe3O4(001). Physical Review Letters 108, 216103 (2012).
- 6 McNeillie, A., Brown, D. H. & Smith, W. E. X-ray photoelectron spectra of some gold compounds. Journal of the Chemical Society, Dalton Transactions 5, 767 (1980).
- 7 NIST X-ray Photoelectron Spectroscopy Database. National Institute of Standards and Technology, Gaithersburg http://srdata.nist.gov/xps/.
- 8 Hayano, R. S. et al. Zero- and low-field spin relaxation studied by positive muons. Physical Review B 20, 850 (1979).
- 9 Uemura, Y. J., Yamazaki, T., Harshman, D. R., Senba, M. & Ansaldo, E. J. Muon-spin relaxation in AuFe and CuMn spin glasses. Physical Review B 31, 546 (1985).
- 10 Uemura, Y. J. et al. Phase separation and suppression of critical dynamics at quantum transitions of itinerant magnets: MnSi and (Sr1-xCax)RuO3. Nature Physics 3, 29 (2007).
- 11 Gat-Malureanu, I. M. et al. Muon spin relaxation and susceptibility measurements of an itinerant-electron system Sr1-xCaxRuO3: quantum evolution from ferromagnet to paramagnet. Physical Review B 84, 224415 (2011).
- 12 Carlo, J. P. et al. New magnetic phase diagram of (Sr, Ca)2RuO4. Nature Materials 11, 323 (2012).
- 13 Nozaki, Y. et al. Muon spin relaxation and electron/neutron diffraction studies of BaTi2(As1−xSbx)2O: absence of static magnetism and superlattice reflections. Physical Review B 88, 214506 (2013).
- 14 Blaha, P. K., Schwarz, K., Madsen, G., Kvasnicka, D. & Luitz, J. An augmented plane wave + local orbitals program for calculating crystal properties. WIEN2K package http://www.wien2k.at (2001).
- 15 Perdew, J. P., Burke, K. & Ernzerhof, M. Generalized gradient approximation made simple. Physical Review Letters 77, 3865 (1996).