Eclipses and dust formation by WC9 type Wolf–Rayet stars
Abstract
Visual photometry of 16 WC8–9 dust-making Wolf–Rayet (WR) stars during 2001–2009 was extracted from the All Sky Automated Survey All Star Catalogue (ASAS-3) to search for eclipses attributable to extinction by dust formed in clumps in our line of sight. Data for a comparable number of dust-free WC6–9 stars were also examined to help characterise the dataset. Frequent eclipses were observed from WR 104, and several from WR 106, extending the 1994–2001 studies by Kato et al. (2002a,b), but not supporting their phasing the variations in WR 104 with its ‘pinwheel’ rotation period. Only four other stars showed eclipses, WR 50 (one of the dust-free stars), WR 69, WR 95 and WR 117, and there may have been an eclipse by WR 121, which had shown two eclipses in the past. No dust eclipses were shown by the ‘historic’ eclipsers WR 103 and WR 113. The atmospheric eclipses of the latter were observed but the suggestion by David-Uraz et al. that dust may be partly responsible for these is not supported. Despite its frequent eclipses, there is no evidence in the infrared images of WR 104 for dust made in its eclipses, demonstrating that any dust formed in this process is not a significant contributor to its circumstellar dust cloud and suggesting that the same applies to the other stars showing fewer eclipses.
keywords:
stars: Wolf–Rayet – stars: individual: WR 104, WR 106.1 Introduction
One of the earliest results from infrared (IR) astronomy was the discovery of ‘excess’ IR radiation by heated circumstellar dust from a variety of stars having emission-line spectra. Amongst these were four WC9 type Wolf–Rayet (WR) stars, Ve2–45 (= WR 104), HD 313643 (= WR 106), LS 15 (= WR 119) and AS 320 (= WR 121), observed by Allen, Harvey & Swings (1972) and, at longer wavelengths, by Gehrz & Hackwell (1974). Cohen, Barlow & Kuhi (1975) measured optical–IR energy distributions of WR stars and showed that they could be matched by either free-free or graphite dust emission.
The enduring interest of dust formation by some WC type WR stars is the great difficulty of forming dust in such hostile environments: close to the stars, the stellar radiation fields heat any dust to above its evaporation temperature but, at greater distances where the radiation field is sufficiently diluted for the grains to survive in radiative equilibrium, the density in an isotropic WC stellar wind is too low to allow homonuclear dust condensation. This was recognised by Hackwell, Gehrz & Grasdalen (1979) in the case of the WC7+O5 type episodic dust-maker HD 193793 (= WR 140) and discussed by Williams, van der Hucht & Thé (1987) for the WC8–9 stars making dust persistently. High-density structures in the WC winds are required to allow dust formation.
Two classes of high-density structure are suggested by the observed incidence and phenomenology of dust formation: large-scale structures generated by the compression of the WC wind where it collides with the wind of a luminous companion in a binary system – a colliding wind binary (CWB) – and isolated clumps in stellar winds probably related to those observed spectroscopically by Moffat et al. (1988), Moffat & Robert (1991) and Lépine & Moffat (1999). Usov (1991) modelled CWBs and suggested that very high compression factors () could be produced in WR 140 if the heated and compressed wind was able to cool efficiently. The IR light curves show that dust formation in WR 140 occurs only very near periastron passage in its highly elliptical 8-y orbit (Williams et al. 1990), presumably related to the increase by factor of 40 of the pre-shock wind density at the wind-collision region (WCR) around this phase (Williams 1999). Such phase-locking occurs in other episodic dust-making systems such as the -yr WC7+O system HD 192641 (= WR 137) (Williams et al. 2001, Lefèvre et al. 2005).
The connection between dust formation by the WC8–9 stars and their movement in binary orbits comes from IR images of the dust which show rotating ‘pinwheel’ structures around systems like WR 104, interpreted to be dust formed and ejected in a stream to one side of a rotating binary system observed at a low orbital inclination (Tuthill, Monnier & Danchi 1999, Tuthill et al. 2008). Further dust ‘pinwheels’ have been observed around other WC8–9 stars, (cf. Monnier et al. 2007) – but binary orbits are required to confirm the picture.
Dust formation in clumps in WR winds deduced from their eclipsing the light of the WR star was first suggested independently from spectroscopy of WR 104 by Crowther (1997) and from photometry of WR 121 and WR 103 by Veen et al. (1998). Compared with earlier observations, the spectrum of WR 104 observed in 1996 showed selective obscuration of the high-ionization emission lines, formed in the core of the WC9 wind, allowing Crowther to set a stringent limit on the projected size () of the obscuring dust clump using a model of the WR 104 wind. Spectra observed by Williams & van der Hucht (2000, hereafter WH00) showed that the strengths of the C ii and C iii lines had partly recovered from Crowther’s 1996 eclipse by mid-1997, and that they had been near ‘normal’ in mid-1995, a year before it.
Tighter timing of a dust eclipse was provided by Veen et al. (1998), who observed WR 121 during and emerging from an 0.8-mag eclipse in 1990. The flux took about 10 d. to recover to its normal level. Multi-colour observations showed that the eclipse was deeper at shorter wavelengths, suggesting that it was caused by extinction by dust particles. A shallower (0.4-mag.) eclipse of WR 103 also showed colour changes indicative of varying dust extinction. This star had previously shown isolated eclipses (Massey, Lundström & Stenholm 1984), but they were not ascribed to dust formation. Another deep eclipse by WR 121 in Hipparcos data was observed by Veen et al. and Marchenko et al. (1998), but its time-scale was not well defined because the observations of this star did not cover the whole event.
Better defined is the deep (-mag.), apparently multiple, eclipse by WR 106 observed by Kato et al. (2002a) in 2000 in a photometric study running from 1994 to mid-2002. The observations were in a single passband, like the data, so interpretation in terms of dust absorption is by analogue with the multi-wavelength observations of eclipses. On a smaller scale, variable circumstellar extinction by dust was invoked by Fahed, Moffat & Bonanos (2009) to explain the low amplitude (0.06-mag.) variations of WR 76 observed in their two-band ( and ) photometric survey of 20 WC8–9 stars.
Kato et al. (2002b) observed significant (2.7-mag.) variations in the light from WR 104, with the star at its faintest near the time of Crowther’s spectroscopy, supporting the suggestion that the variations were caused by variable dust extinction. They found a period of 241 d. in their data, close to that of the pinwheel orbit, and suggested that the dust eclipses were phase-locked to the orbit and caused by some of the dust plume creating the pinwheel entering our line of sight. Further optical photometry of WR 104 in the All-Sky Automated Survey (ASAS-3, Pojmański 2002) allowed reinvestigation of this suggestion. A dataset combining the observations by Kato et al. with the then available ASAS-3 observations, duly shifted to allow for the different passbands, showed (Williams 2008) no phasing of the optical photometry with the pinwheel period.
The ASAS-3 is now complete, prompting revisiting the variations of WR 104, and extension of the study to a search for eclipses by other dust-forming WC8–9 stars. The prime goal is examination of the incidence of eclipses – most of which had previously been discovered serendipitously – as a step to investigating the significance of this mode of dust formation amongst WC8–9 stars as a possible alternative to formation in CWBs, with particular relevance to the WC8–9 stars without luminous companions. The ASAS-3 database is well suited to this, covering the region of the Galactic Plane occupied by the dust-making WC8–9 stars and containing observations made over a long time span (2001–2009) which, allowing for the gaps between the stars’ observing seasons, provide the equivalent of 5 yr continuous photometry of each. The limiting magnitude is almost 15 and stars as bright as can be observed without saturation (Pojmański 2002), allowing inclusion of the brighter WC8–9 stars. As already noted, the interpretation of abrupt falls in single-passband photometry as obscuration by dust clumps is by analogue with the multi-wavelength studies of similar objects; but the present paper will proceed using this assumption, and follow Veen et al. (1998) in calling the phenomena eclipses. Such eclipses can tell us about varying dust absorption along a narrow column towards the stars; in contrast, the IR emission gives the total amount of dust around the stars close enough to be heated by the stellar radiation and re-emit in the IR. In this paper, the designation of stars as dust-makers or dust-free is on the basis of their IR spectral energy distributions (SEDs).
2 Observational data
| WR | HD/name | Spectrum | Nobs | Ap | ||
|---|---|---|---|---|---|---|
| 13 | Ve6–15 | WC6 | 614 | 12.86 | 0.09 | 2 |
| 14 | 76536 | WC7+? | 557 | 8.82 | 0.04 | 4 |
| 15 | 79573 | WC6 | 562 | 10.65 | 0.04 | 4 |
| 23 | 92809 | WC6 | 1011 | 9.07 | 0.04 | 5 |
| 42 | 97152 | WC7+O7V | 656 | 8.09 | 0.04 | 6 |
| 45 | LSS 2423 | WC6 | 199 | 14.11 | 0.17 | 2 |
| 50 | Th2–84 | WC7+OB | 556 | 11.89 | 0.07 | 2 |
| 53 | 117297 | WC8d | 990 | 10.53 | 0.04 | 4 |
| 56 | LS 8 | WC7 | 483 | 13.52 | 0.13 | 2 |
| 57 | 119078 | WC8 | 812 | 9.69 | 0.05 | 5 |
| 59 | LSS 3164 | WC9d | 533 | 11.48 | 0.06 | 3 |
| 60 | 121194 | WC8 | 182 | 11.98 | 0.09 | 2 |
| 64 | BS 3 | WC7 | 319 | 14.04 | 0.16 | 2 |
| 65 | Wra 1297 | WC9d+OB | 445 | 13.28 | 0.12 | 3 |
| 68 | BS 4 | WC7 | 543 | 13.24 | 0.12 | 2 |
| 69 | 136488 | WC9d+OB | 936 | 9.25 | 0.06 | 4 |
| 70 | 137603 | WC9d+B0I | 919 | 9.80 | 0.03 | 5 |
| 73 | NS 3 | WC9d | 114 | 14.45 | 0.20 | 2 |
| 77 | He3-1239 | WC8+OB | 484 | 12.54 | 0.09 | 2 |
| 80 | LSS 3871 | WC9d | 119 | 14.42 | 0.22 | 2 |
| 81 | He3-1316 | WC9 | 527 | 12.06 | 0.06 | 2 |
| 92 | 157451 | WC9 | 602 | 10.27 | 0.05 | 2 |
| 93 | 157504 | WC7+O7-9 | 797 | 10.60 | 0.04 | 4 |
| 95 | He3-1434 | WC9d | 918 | 12.96 | 0.11 | 3 |
| 96 | LSS 4265 | WC9d | 257 | 13.78 | 0.15 | 2 |
| 101 | DA 3 | WC8 | 927 | 13.76 | 0.14 | 2 |
| 103 | 164270 | WC9d | 852 | 8.78 | 0.03 | 6 |
| 104 | Ve2–45 | WC9d+B0 | 617 | 13.28 | 0.36 | 2 |
| 106 | 313643 | WC9d | 925 | 11.86 | 0.12 | 3 |
| 113 | 168206 | WC8d+O8-9 | 733 | 9.13 | 0.03 | 5 |
| 117 | IC14–22 | WC9d | 429 | 13.11 | 0.14 | 3 |
| 119 | Thé 2 | WC9d | 422 | 12.02 | 0.06 | 2 |
| 121 | AS 320 | WC9d | 381 | 12.02 | 0.06 | 3 |
| 125 | IC14–36 | WC7+O9III | 287 | 12.80 | 0.09 | 2 |
WR numbers assigned by van der Hucht et al. (1981)
Photometry for 16 dust-making WC8–9 stars was extracted from the ASAS-3 All Star Catalogue111http://www.astrouw.edu.pl/asas/?page=aasc. To avoid bias, the accessible dust-free WC8–9 stars (excluding WR 88, which is a transitional WN/WC9 object, Williams, van der Hucht & Rauw 2005) were added, together with a number of WC6–7 stars to help characterise the dataset.
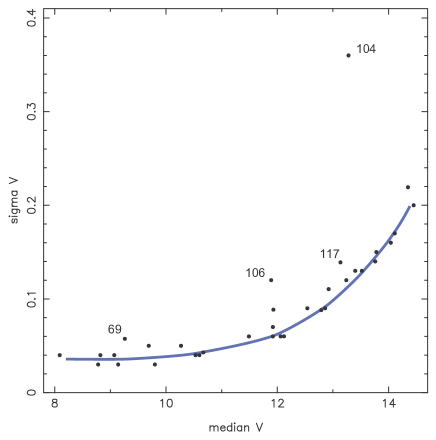
The ASAS-3 observations are flagged by quality (‘A–D’), and only stars having at least 100 A-quality (best) data were used for this study. The photometry is provided through a range of apertures (2–6 pixels, where a pixel = 15 arc sec), with a suggested ‘default’ aperture chosen on the basis of the object’s brightness, smaller for the fainter objects. We began using the ‘default’ apertures but in each case checked the scatter in the photomtery in other apertures; in a very few cases the scatter was found to less in an aperture other than the default, and the data measured through that aperture were used. The number of extracted observations, median magnitude, standard deviation and aperture size are given for each star in Table 1.
The relation between the standard deviation and median magnitudes is shown in Fig 1, which is consistent with the corresponding figure, based on very many more stars, in Pojmański (2002). The photometric accuracy, 0.04–0.20 mag., is lower than that of some of the studies cited above, but entirely adequate for searching for 0.5-mag. eclipses. In addition to observational errors, including calibration, the dispersions include the effects of any dust eclipses and also of the low-amplitude intrinsic variation observed in many WC9 stars (e.g. Moffat, Lamontagne & Cerruti 1986; Balona, Egan & Marang 1989; Fahed et al. 2009; van Genderen, Veijen & van der Hucht 2013). These low-level variations are generally below the threshold of the ASAS-3 dataset and are not part of the present study.
3 Results
3.1 The dust-free WC stars
With the exception of WR 125, these are stars which have never shown IR SEDs characteristic of dust formation. The episodic dust-maker WR 125 (Williams et al. 1994) was included in this group because IR photometry in the 2MASS (Skrutskie et al. 2006), Spitzer GLIMPSE (Churchwell et al. 2003) and WISE (Wright et al. 2010) surveys, along with unpublished observations in 2006 and 2007, showed no recurrence of the 1990–93 dust-formation episode during the time span of the present study. It is possible that other stars in this group are unrecognised episodic dust makers observed during quiescence, since only a few WC8–9 stars have long IR photometric histories.
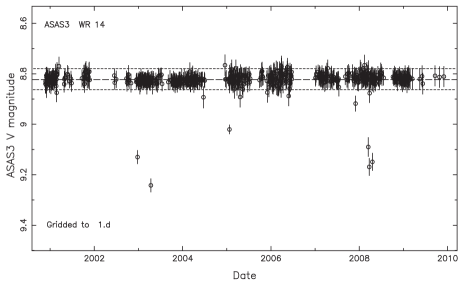
The light curve for each star was examined. To avoid clutter, the photometry was gridded to 1-d. intervals. Besides the dispersion (), which increases with faintness (cf. Fig. 1), the light curves show a small number (about one per cent of the observations) of isolated points having mag fainter than the median . They are more conspicuous in the light curves of the brighter stars having less scatter; an example is shown in Fig. 2. The light curves near each of the outliers were examined in detail to see if the outliers could represent real eclipses. Where the low values were not supported by the preceeding or following observations, they were considered to be artefacts of the observations and unreliable – apparently a characteristic of the dataset.
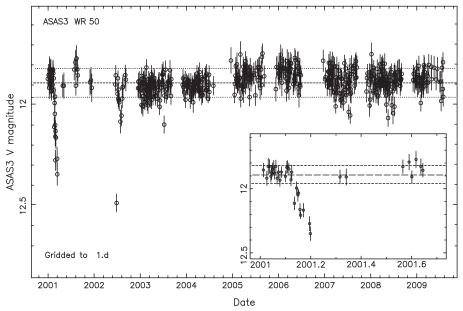
With the single exception of WR 50, none of the dust-free stars in Table 1 showed evidence for eclipse-like variation. The light curve of WR 50 (Fig. 3) shows a well defined fading of 0.5 mag. over 30 d. in 2001. This was followed by a gap in the observing for 40 d., after which the flux had returned to its previous value. Short time scale, low amplitude photometric variation in 1988 was observed by van Genderen, Larsen & van der Hucht (1990) and nightly fading in 1989 reported by van Genderen et al. (1991); but reinvestigation of the latter by Veen & Wieringa (2000) found that most, if not all, of this variation was not real. From IR observations in the 2MASS, GLIMPSE and WISE surveys, there is no evidence for dust emission in 2001–10 – but this does not rule out the possibility that it is an episodic dust-maker observed during a long period of quiescence, like WR 125. The spectrum of WR 50 shows absorption lines (van der Hucht et al. 1981; Smith, Shara & Moffat 1990) so WR 50 is most probably a binary – but apparently lacks an orbit.
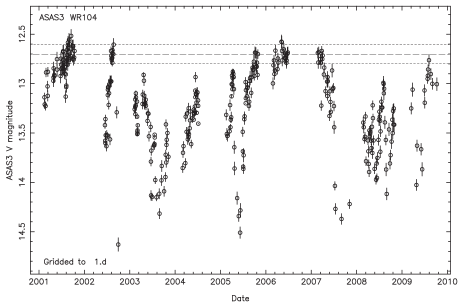
3.2 More eclipses in WR 106
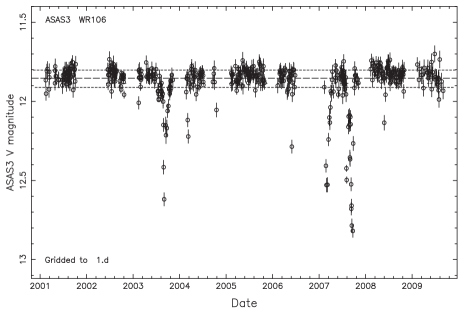
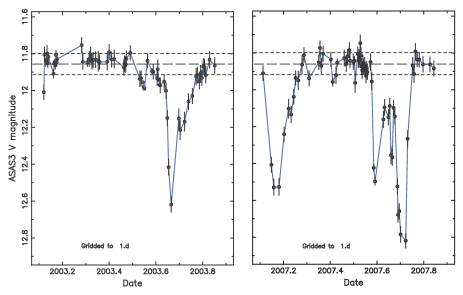
The ASAS-3 light curve (Fig. 4) of WR 106 shows deep eclipses in 2003 and 2007, the second eclipse in 2007 having a double minimum separated by 46 d. with perhaps a third, lower amplitude, one between them (Fig. 5). This invites comparison with the complex eclipse (in sparser data) observed in 2000 by Kato et al. (2002a), having at least two components, with minima separated by 56 days, but a larger amplitude ( mag), than that of the 2007.7 minimum ( mag.).
Kato et al. (2002a) also reported the marginal detection of a shallower ( 0.6-mag.) eclipse in 2002 May; unfortunately, the ASAS-3 observations in 2002 began in mid-June so this event cannot be compared in the two datasets. A possible low-amplitude ( 0.4-mag.) eclipse in the ASAS-3 data could be the two fainter magnitudes in 2004.2 which were observed within 4 d. of each other and are therefore probably not observational outliers; the flux was near normal 2 d. before the first observation and again 4 d. after the second, making it a very brief event. The other low points in 2006 and 2008 in the light curve are isolated outliers.
The Kato et al. (2002a) and ASAS-3 datasets overlap in 2001–2, so that the two taken together provide coverage from 1994.1 to 2009.8, but with a number of gaps, mostly seasonal. To estimate the completeness of coverage with respect to discovery of deep eclipses like those observed, we note that the 2003 eclipse and the first in 2007 each lasted about 60 d., so that at least part of such an eclipse would still be observed if there was a gap of no more than 0.1 yr. in the observations. Omitting the larger gaps in coverage, we then have the equivalent of 9.9 yr of continous photometric monitoring during which six deep minima, four of them in close pairs, were observed. If the six minima were independent events, their distribution is far from Poissonian. For example, if we divided the 9.9 period into 33 intervals of 0.3 yr, an interval long enough to include the double eclipses but not so long as to include both the single and double eclipses in 2007, we have a rate of 6/33 = 0.182 eclipses per interval. A Poissonian distribution would have 27.5 intervals with no eclipse, 5.0 with one eclipse, 0.45 with two eclipse, etc. – far from what is observed. The numbers are too small for a conclusion, but this suggests that the double eclipses are integral events rather than the close proximity of independent single eclipses. This suggestion is supported by the apparent minor eclipse (depending on two observations separated by 2 d.) between the two components of the 2007 double eclipse, and would be strengthened if the apparent eclipses on the rising branches of the 2003.7 and 2007.2 eclipses were real (Fig. 5).
The 2003 and the first 2007 eclipses show a slower recovery than fading, 36 and 44 d., compared with fadings of 0.6 mag in 17 and 10 d. respectively. The recovery from the double eclipse was much faster, 17 d. to rise by 0.9 mag. If we interpret the rise times as the lifetimes of the dust clumps as they rise through the stellar wind in our direction, the simplest explanation of the shorter lifetimes is that the trajectories of the clumps make a small angle to our line of sight and they pass out of it sooner than if the trajectories were exactly aligned to our line of sight.
The particular interest of formation of dust in clumps by WR 106 is that it is not obviously a CWB: WH00 searched for, but did not observe, Balmer absorption lines attributable to an OB companion to the WC9 star in its spectrum. If WR 106 is not a CWB, its circumstellar dust must be formed in some other process.
3.3 Frequent eclipses in WR 104
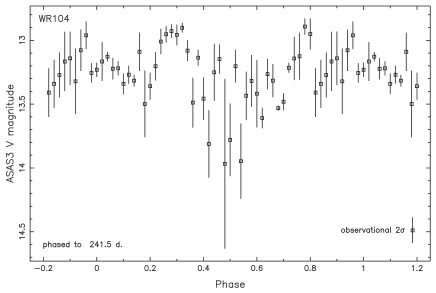
The ASAS-3 light curve of WR 104 (Fig. 6) is reminiscent of that observed by Kato et al. (2002b) during 1994–2001 in showing almost continuous variation, and it differs significantly from all the other stars observed in not having long runs of apparently constant flux. Evidently, WR 104 suffers more eclipses than any other WC9 star observed in this or previous studies, apparently an almost continuous string of eclipses having a range of depths, and sometimes overlapping. Another possible explanation for the variations is variable extinction caused by some of the dust formed in the colliding-wind system entering our line of sight, as proposed by Kato et al. (2002b). They found a period equal to the ‘pinwheel’ rotation period in their photometric data but, as noted above, this was not supported in a preliminary study using their photometry and some early ASAS-3 data (Williams 2008). It is now possible to repeat the period search using the whole ASAS-3 dataset for WR 104, 617 observations compared with 146 used by Kato et al. The datasets were not combined this time as the Kato et al. data are of lower accuracy (0.2–0.3 mag.) than the ASAS-3 data, and are in a different photometric band (unfiltered 400–600 nm). A search for periods in the range 200–300 d. using phase dispersion minimization (PDM, Stellingwerf 1978) showed no evidence for a period near that (241.5 d., Tuthill et al. 2008) of the ‘pinwheel’ rotation. The data were then phase-folded with the 241.5-d. period (Fig. 7), giving the PDM statistic , and do not show the large-scale phased variation of extinction found by Kato et al. The latter used 15 phase bins for their phased light curve in contrast to the 50 used here, which seems the minimum number needed to capture the variations of WR 104. Inspection of the light curve shows well-defined changes of 0.1–0.2 mag., compared with 0.1 mag. for the expected observational error, on the time scale of the P/50 phase bins, so wider phase bins would smother these variations. Phased light curves using narrower binning were also investigated, but none showed systematic variation. The large dispersions seen in some of the phase bins is a consequence of stochastic occurence of deep eclipses independent of the orbital period.
There are so many eclipses that the median is not a good measure of the undisturbed flux level, which is estimated to lie near from inspection of the light curve. Omitting gaps in the observing exceeding 0.1 yr, we have the equivalent of 4.8 yr of continuous photometric coverage, during which WR 104 was brighter than (1 below the estimated undisturbed level) for only about 0.64 yr, implying that eclipses were occurring for seven-eighths of the time. From the light curves, 14 eclipses were identified; some completely observed, and others inferred from well-defined but isolated brightening or fading at the ends of observing runs, of which three had amplitudes in the range 1.5–2.0 mag., eight in 1.0–1.4 mag., and three (probably an underestimate) in 0.5–0.9 mag., giving an average rate of 3.4 yr-1, also probably an underestimate.
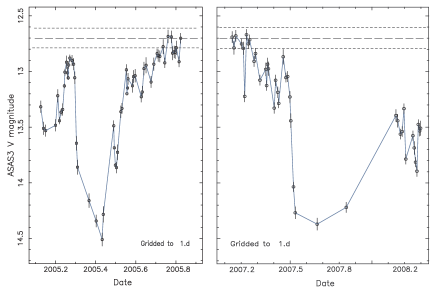
The light curves show much wider minima than the eclipses shown by WR 106, but this might be caused by the partial overlapping of individual events. For example (Fig. 8), there was a reasonably well defined eclipse in 2005, but its recovery appears to have been interrupted by another eclipse, so estimation of the recovery time and clump lifetime comes from measuring the brightening rates, giving 40 d. In 2007, there was an even broader minimum, but it is not obvious whether this was caused by a single clump or several – the data in the second half of 2007 are very sparse, with a gap of 65 d. between the last two observations, and one of 110-d. between the last and the first observations in 2008. During 2008, the light curve looks like noise, but closer examination shows 1-mag eclipses in 2008.4 and 2008.6. Again it was not possible to measure recovery times or clump lifetimes as the recoveries were interupted. Gaps in the coverage make other events harder to characterise, but the steady rise of 0.9 mag. in 0.18 yr in 2002, recovery from an earlier eclipse, suggests a clump lifetime of at least 66 d.
3.4 0bservations of other dust-making WC8–9 stars
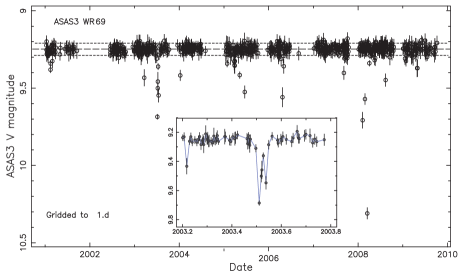
The photometric dispersion in WR 69 seems anomalously high for its brightness (cf. Fig. 1), and the light curve (Fig. 9) shows rather more outliers than the others. The dip in mid-2003 comes from seven observations (some gridded) and is probably a real, low-amplitude, eclipse. Inspection of all the other outliers showed that they were isolated observations. Low-amplitude (-mag.) variability has been observed by Balona et al. (1989), and was found in Hipparcos data by Marchenko et al. (1998) and Koen & Eyer (2002), with different periods, but phasing the ASAS-3 photometry to both of these periods did not reveal any systematic variation. Spectroscopy showed the WC9 star to have an early O-type companion (WH00), and a subsequent observation showed the lines in the two stars to have moved relative to each other, confirming WR 69 as a spectroscopic binary (Williams et al. 2005).
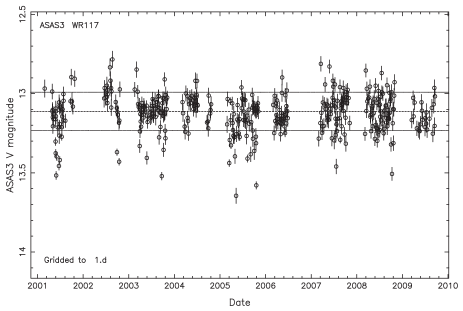
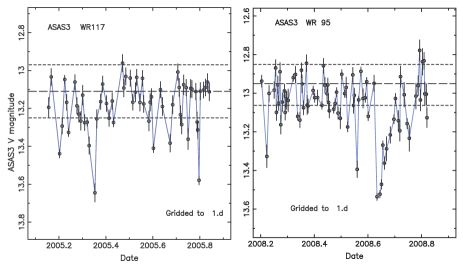
Another star showing slightly high dispersion for its magnitude is WR 117, whose light curve (Fig. 10) shows a fair amount of scatter and a possible 0.5-mag. eclipse defined by four points in 2005.4. This is shown at higher scale in Fig. 11.
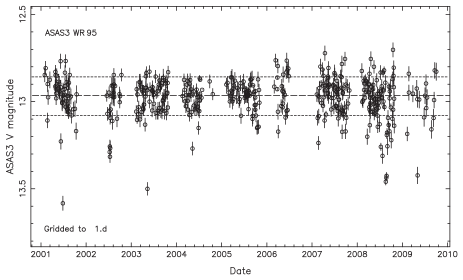
The light curve of WR 95 (Fig. 12) shows a 0.6-mag. eclipse in 2008.6 (Fig 11), with a slow recovery ( 40 d.); and a possible weak (0.3-mag.) eclipse in 2002.3.
No dust eclipses were identified in the light curves of WR 103 or WR 113, which had shown eclipses in the past (see above), based on the equivalents of 3.8 and 5.2 yr of continuous monitoring. Phasing the photometry of WR 113 (CV Ser), omitting the 7 out of 733 magnitudes identified as isolated outliers, to the elements of David-Uraz et al. (2012) clearly showed a broad ( P) 0.02-mag. atmospheric eclipse at phase 0.5, matching their observations and giving a measure of the quality of the ASAS-3 photometry of a bright star. David-Uraz et al. suggested that scattering by dust in the wind of the WC8 component could be a significant contributor to the depth of the eclipse, but this idea suffers from the problem that any dust would also absorb stellar radiation which would heat it – to evaporation, if too close to the star. From the measured by Niemela et al. (1996) and given by David-Uraz et al., the line of sight to the O star can be seen to pass within of the WC8 star. This is very much closer to the star than the minimum distance at which carbon grains can survive the radiative heating, the inner edge of the WR 113 dust cloud (, where is the radius of a single star having the same luminosity as the WC8+O binary) modelled by Williams et al. (1987), or the corresponding distances, 20–30 au, observed and modelled for the WC9+B0 system WR 104 by Tuthill et al. (2008) and Harries et al. (2004), so it is most unlikely that dust can play a part in the atmospheric eclipses.
No well defined eclipse was shown by the third star to have shown eclipses in the past, WR 121, during the equivalent of 3.8 yr of continuous monitoring. Two isolated points 0.2 mag. below median observed on successive nights, supported by a B-quality observation four nights earlier, at the end of the 2008 observing season might point to an eclipse but the coverage was too sparse to be certain.
None of the other eight dust-makers showed evidence for an eclipse in their light curves or, indeed, any significant variation.
4 Discussion
4.1 The incidence of eclipses
Apart from WR 104 and WR 106, in which at least 14 and 6 eclipses with amplitudes greater than 0.5 mag. were observed in the equivalents of 4.8 and 9.9 yr of continuous monitoring respectively, the other 14 dust-making WC8–9 stars accounted for about four eclipses of lower amplitude in the equivalent of yr of continuous monitoring. This very great discrepancy in observed eclipse rates suggests a significant difference between the winds of WR 104 and WR 106 and those of the other WC8–9 stars observed: greater than the high end of a continuous distribution of properties.
An alternative to the very uneven distribution of clump formation in WC9 winds is that all the stars form clumps at rates comparable to WR 104 and WR 106, but that the clumps are confined to narrowly collimated streams, and that only these two stars are favourably inclined to the observer. In this picture, the streams of clumps from the stars showing occasional eclipses have trajectories making slightly larger angles with our line of sight. The problem with this explanation is that it runs contrary to the spectroscopic study of the radial velocities of clumps in WR winds, which show their trajectories to have a range of angles to the line of sight (Moffat & Robert 1991; Robert 1994; Lépine & Moffat 1999), and that it is most unlikely that the two sorts of clump would be formed in such different ways.
The eclipse rates can be compared with the circumstellar dust clouds, as measured by the fractions of the stellar ultraviolet–visible flux which they absorb and re-radiate in the IR. For WR 104 and WR 106, these are about 60 and 23 per cent respectively, compared with 1–10 per cent (Williams et al. 1987) for the other dust makers in this study. Amongst the latter, WR 80 and WR 96 re-radiate approximately 9.5 per cent of their stellar flux in the IR but have not shown eclipses, whereas the stars showing a few eclipses, WR 69, WR 95, WR 117 and perhaps WR 121 have re-radiation rates between 1.7 and 5.8 per cent, and WR 50 is not a known dust maker; so the correlation is not strong. Unfortunately, the other stars shown by Williams et al. (1987) to have high IR re-radiation rates, WR 48a, WR 76 and WR 118, are all too faint for the present study (Fahed et al. (2009) did not observe any eclipses by WR 76 in their study, but the photometry covered only 18 d.) Fainter WC8–9 dust makers, including WR 48a and WR 76, should be observable in the currently progressing surveys such as ASAS-4222http://www.astrouw.edu.pl/asas/?page=asas4 and OGLE-IV (cf. Pietrucowicz et al. 2013). The photometric coverage of at least some of the stars in the present study should be extended to improve our knowledge of the incidence of eclipses in stars like WR 121 and to investigate the possible double or multiple eclipses apparently shown by WR 106.
To study the connection between the dust formed in clumps and that making up the circumstellar dust reservoirs responsible for the IR emission, consider what happens to the dust. The clump apparently starts close to the WC star (Crowther 1997, Veen et al. 1998) and moves out with the wind. The dust condenses quickly, judging by the fading times of the eclipses. As the dust absorbs stellar radiation, it heats up and re-radiates in the IR until either it gets so hot that the dust evaporates, or the clump has moved away from the star sufficiently quickly that the geometric dilution of the stellar radiation heating it is no longer enough to heat it above evaporation temperature. By the end of the eclipse, either the dust has been destroyed, or the dust has survived but the clump has dissipated sufficiently that it no longer provides enough visual absorption to produce a measurable eclipse – but, of course, continues absorbing and re-radiating in the IR. There are two time-scales: the kinematic time for the dust to reach a safe distance (e.g. about 25 au in the case of WR 104 from the modelling by Harries et al. 2004) which would be d. at an average speed of 1200 km s-1, the terminal velocity of the wind. This may be optimistic, the initial acceleration of clumps is rather slow (e.g. Lépine & Moffat 1999), but radiation pressure will accelerate the dust to move faster than the wind in which it condensed. The other time-scale is that for the dust being heated in the stellar radiation field to reach its evaporation temperature. This needs to be modelled, particularly the properties of the original clump and the shielding it must provide to the condensing and newly formed dust – which is beyond the scope of the present study. We can see, however, that the kinematic time-scale is comparable to the recovery times of eclipses, so it seems possible that dust formed in clumps is surviving long enough to reach the ‘safe’ distance and contribute to the circumstellar dust reservoir. Simultaneous optical and IR observations during a dust eclipse would be invaluable in measuring the brightening in the IR and temperature of the dust clump as it moves out in the stellar wind. One star, WR 70 was observed frequently in the IR during the present study, varying with a range of (Williams et al. 2013), but its ASAS-3 magnitudes showed no eclipses or other variation, so the variations in dust emission must be ascribed to changes in its WC9 + B0I wind-collision system.
4.2 Dust formation by WR 104
The absence of variable extinction associated with the orbital motion in WR 104 is unsurprising considering the geometry. We know from the spectroscopy in 1995–97 that dust was in front of the WC9 star and not the OB companion. The winds collide between the stars, and the dust is formed further from the WC9 star, beyond the OB companion, in a well-collimated beam (opening angle , cf. Harries et al. 2004) in the orbital plane, which lies almost in the plane of the sky given the low inclination, . Only in an inclined system like WR 140, is some of the CWB dust modelled to pass in front of the star (Williams et al. 2009) and cause the minor eclipses observed shortly after periastron passage (Marchenko et al. 2003), when the CWB dust formation was briefly active. The high eccenticity of its orbit results in the projected position angle of the wind-collision system swinging through more than on the sky in only around periastron and the dust to be spread very unevenly around the stars.
The IR images of WR 104 (Tuthill et al. 2008) can be used to infer the relative importance to the circumstellar dust reservoir of formation in clumps and formation in the WC9+OB wind-collision system responsible for the dust pinwheel. If dust made in clumps responsible for the eclipses is significant, we would expect to see evidence in the form of extended, possibly clumpy, diffuse emission centred on the star in the IR images. The very observation of pinwheel structures, however, demonstrates that most of the dust emission is in the pinwheel; the composite 2-m image (Tuthill et al. 2008, fig. 8) shows no dust emission above 0.1 per cent of the peak between the arms. This demonstrates that dust formation in clumps is not an important contributor to the total dust being formed by WR 104 – either because comparatively little dust is being made in this process, or because the dust in the clumps does not survive long enough to reach the ‘safe’ distance.
If instead of isotropic clump formation, we consider that WR 104 owes its high rate of observed eclipses to a collimated beam and our favoured viewing angle, we might expect the IR images to show a bright spot in the centre: emission by a column of surviving clump dust. There is no evidence for this; on the contrary, the images show a ‘standoff distance’ of 13 mas (Tuthill et al. 2008), the ‘safe’ distance above, between the brightest dust pixel and the spiral centre, interpreted as the stars, where no emission is seen.
In either case, it is evident that the star having by far the highest rate of eclipses is not receiving a significant contribution to its circumstellar dust cloud by this process. We need to know more about the WR 104 eclipses from multi-colour photometry over a wide wavelength range to make sure that the extinction really is by dust and to measure its properties. Large amplitude () variability was found in the first results from the Bochum southern Galactic Disk survey (Haas et al. 2012) and the combination of such photometry with contemporaneous in the ASAS-4 survey over the next few years would be valuable. Also, WR 104 would be a good candidate for simultaneous IR and optical photometry to determine the behaviour of the dust on the recovery branches of the eclipses.
5 Conclusions
Of the 16 dust-making WC8–9 stars surveyed, most of the eclipses were observed from just two stars, WR 106 and WR 104, while the other 14 stars showed only 3–4 eclipses, none as deep as those in WR 104 or WR 106. It is evident from the IR images of WR 104 that any dust formed in the eclipses is not a significant contributor to its circumstellar dust cloud. The implication of this is that dust formed in occasional eclipses by the other WC8–9 dust makers is also an insignificant contributor to their dust clouds, so that the question of how WC9 stars which are not members of CWBs make their dust still remains open.
The two stars with the highest eclipse rates also have the most luminous dust clouds in the IR and, although dust formed in clumps may not contribute to the circumstellar dust directly, CWBs having higher rates of clumps in the WC9 winds might be more efficient dust makers.
Acknowledgements
This work is based on the All Sky Automated Survey All Star Catalogue and it is a pleasure to thank Grzegorz Pojmański for helpful correspondence. It has made use of the NASA/IPAC Infrared Science Archive, which is operated by the Jet Propulsion Laboratory, California Institute of Technology, under contract with the NASA, and the SIMBAD and VizieR databases, operated at the CDS, Strasbourg. I am grateful to the Institute for Astronomy and UK Astronomy Technology Centre for continued hospitality and access to the facilities of the Royal Observatory Edinburgh.
References
- [AHS] Allen D. A., Harvey P. M., Swings J. P., 1972, A&A, 20, 333
- [photWR] Balona L. A., Egan J., Marang F., 1989, MNRAS, 240, 103
- [GLIMPSE] Churchwell E., et al., 2009, PASP, 121, 213
- [CBK] Cohen, M., Barlow, M.J. & Kuhi, L.V. 1975, A&A, 40, 291
- [ec104] Crowther P. A., 1997, MNRAS, 290, L59
- [WR113] David-Uraz A., et al., 2012, MNRAS, 426, 1720
- [varWC9] Fahed R., Moffat A. F. J., Bonanos A. Z., 2009, MNRAS, 392, 376
- [GH74] Gehrz R. D., Hackwell J.A., 1974, ApJ, 149, 619
- [Bochum] Haas M., Hackstein M., Ramolla M., Drass H., Watermann R., Lemke R., Chini R., 2012, AN, 333, 706
- [HGG140] Hackwell J. A., Gehrz R. D., Grasdalen G. L., 1979, ApJ, 234, 133
- [3D104] Harries T. J., Monnier J. D. Symington N. H. Kurosawa R., 2004, MNRAS, 350, 565
- [Kato106] Kato T., Haseda K., Takamizawa K., Yamaoka H., 2002a, A&A, 393, L69
- [Kato104] Kato T., Haseda K., Yamaoka H., Takamizawa K., 2002b, PASJ, 54, L51
- [HippVar] Koen C., Eyer L., 2002, MNRAS, 331, 45
- [Orbit137] Lefèvre L., et al. 2005, MNRAS, 360, 141
- [clumpsII] Lépine S., Moffat A. F. J., 1999, ApJ, 514, 909
- [HipPhot] Marchenko S. V., et al., 1998, A&A, 331, 1022
- [WR140] Marchenko S. V., et al., 2003, ApJ, 596, 1295
- [hist103] Massey P., Lundström I., Stenholm B., 1984, PASP, 96, 118
- [WR103v] Moffat A. F. J., Lamontagne R., Cerruti M., 1986, PASP, 98, 1170
- [var] Moffat A. F. J., Robert C., 1991, in in van der Hucht K. A., Hidayat B., eds, IAU Symp. No. 143, Wolf-Rayet Stars and Interrelations with other Massive Stars in Galaxies, Kluwer Academic Publishers, Dordrecht, p. 109
- [Clumps1] Moffat A. F. J., Drissen L., Lamontagne R., Robert C., 1988, ApJ, 334, 1038
- [sizes] Monnier J. D., Tuthill P. G., Danchi W. C., Murphy N., Harries T. J., 2007, ApJ, 655, 1033
- [orb140] Monnier J. D., et al., 2011, ApJL, 742, L1
- [CV Ser] Niemela V. S., Morrell N. I., Barba R. H., Bosch G. L., 1996, Rev. Mex. Serie de Conferencias, 5, 100
- [OGLE] Pietrukowicz P., et al., 2013, Acta Astr., 63, 379
- [ASAS-3] Pojmański G., 2002, Acta Astr. 52, 397
- [blobs] Robert C., 1994, Ap&SS, 221, 137
- [R136] Schnurr O., Chené A.-N., Casoli J., Moffat A. F. J., St-Louis N., 2009, MNRAS, 397, 2049
- [2MASS] Skrutskie M. F., et al., 2006, AJ, 131, 1163
- [SSM1] Smith L. F., Shara M., Moffat A. F. J., 1990, ApJ, 348, 471
- [PDM] Stellingwerf R. F., 1978, ApJ, 224, 953
- [WR104] Tuthill P. G., Monnier J. D., Danchi, W. C. 1999, Nature, 398, 486
- [WR104b] Tuthill P. G., Monnier J. D., Lawrance N., Danchi W. C., Owocki S. P., Gayley K. G., 2008, ApJ, 675, 698
- [DustTh] Usov V. V. 1991, MNRAS, 252, 49
- [6thCat] van der Hucht K. A., Conti P. S., Lundström, I., Stenholm B., 1981, Space Sci. Rev., 28, 227
- [WR50etc] van Genderen A. M., Larsen I., van der Hucht K. A., 1990, A&A, 229, 123
- [varBali] van Genderen A. M., et al., 1991, in van der Hucht K. A., Hidayat B., eds, IAU Symp. No. 143, Wolf-Rayet Stars and Interrelations with other Massive Stars in Galaxies, Kluwer Academic Publishers, Dordrecht, p. 129
- [WR103etc] van Genderen A. M., Veijen S. R. G., van der Hucht K. A., 2013, Ap&SS, 345, 133
- [radio50] Veen P. M., Wieringa M. H., 2000, A&A, 363, 1026
- [Eclipse121] Veen P. M., van Genderen A. M., van der Hucht K. A., Li, A., Sterken C., Dominik C., 1998, A&A, 329, 199
- [IAU193] Williams P. M. 1999, in: van der Hucht K. A., Koenigsberger G., Eenens P. R. J., eds, Proc. IAU Symp. No. 193, Wolf-Rayet Phenomena in Massive Stars and Starburst Galaxies, Astron. Soc. Pacific, San Francisco, p. 267
- [Virpi] Williams, P. M., 2008, Rev. Mex. Serie de Conferencias, 33, 71
- [SAAO] Williams P. M., van der Hucht K.A., 2000, MNRAS, 314, 23 (WH00)
- [WHT] Williams P. M., van der Hucht K. A., Thé P. S., 1987, A&A, 182, 91
- [Paper1] Williams P. M., van der Hucht K. A., Pollock A. M. T., Florkowski D. R., van der Woerd H., Wamstecker W. M., 1990, MNRAS, 243, 662
- [WR125b] Williams P. M., van der Hucht K. A., Kidger M. R., Geballe T. R., Bouchet P., 1994, MNRAS, 266, 247
- [WR137ii] Williams P. M., et al., 2001, MNRAS, 324, 156
- [LiegeWC9] Williams P. M., van der Hucht K. A., Rauw G., 2005, in: Rauw G., Nazé Y., Blomme R., Gosset E., eds, Massive Stars and High-Energy Emission in OB Associations, a workshop of the JENAM 2005, ‘Distant Worlds’, Liège 2005, p. 65
- [WR140im] Williams P. M., et al., 2009, MNRAS 395, 1749
- [WR70] Williams P. M., van der Hucht K. A., van Wyk F., Marang F., Whitelock P. A., Bouchet P., Setia Gunawan D. Y. A., 2013, MNRAS, 429, 494
- [WISE] Wright E. L., et al. 2010, AJ, 140, 1868