The Lyman Alpha Reference Sample: III. Properties of the Neutral ISM from GBT and VLA Observations
Abstract
We present new H I imaging and spectroscopy of the 14 UV-selected star-forming galaxies in the Lyman Alpha Reference Sample (LARS), aimed for a detailed study of the processes governing the production, propagation, and escape of photons. New H I spectroscopy, obtained with the 100m Green Bank Telescope (GBT), robustly detects the H I spectral line in 11 of the 14 observed LARS galaxies (although the profiles of two of the galaxies are likely confused by other sources within the GBT beam); the three highest redshift galaxies are not detected at our current sensitivity limits. The GBT profiles are used to derive fundamental H I line properties of the LARS galaxies. We also present new pilot H I spectral line imaging of 5 of the LARS galaxies obtained with the Karl G. Jansky Very Large Array (VLA). This imaging localizes the H I gas and provides a measurement of the total H I mass in each galaxy. In one system, LARS 03 (UGC 8335 or Arp 238), VLA observations reveal an enormous tidal structure that extends over 160 kpc from the main interacting systems and that contains 109 M⊙ of H I. We compare various H I properties with global quantities derived from HST measurements. The measurements of the escape fraction are coupled with the new direct measurements of H I mass and significantly disturbed H I velocities. Our robustly detected sample reveals that both total H I mass and linewidth are tentatively correlated with key tracers. Further, on global scales, these data support a complex coupling between propagation and the H I properties of the surrounding medium.
1 Introduction
The Lyman-alpha emission line () at 1216 Å fulfills several extremely important roles in observations of the high-redshift () Universe. Recombination nebulae re-process of the raw ionizing power of hot stars into a single emission line which acts as a luminous spectral beacon by which to identify galaxies at the highest redshifts (see, e.g., Hayes et al. 2010 and references therein). Further, at the highest redshift it provides the potential for the all-important spectroscopic confirmation of distant galaxies selected by other methods, transforming the status of candidates to objects with secure redshifts (e.g., Stark et al. 2010).
is a resonance line and is readily scattered by neutral hydrogen atoms. This scattering may occur in the interstellar medium (ISM) of the galaxies themselves, or in the circumgalactic medium (CGM) that immediately surrounds them. Scattering in the CGM can lead to extended structures such as those found in high-z emitters (LAE) by Steidel et al. (2011) and Zheng et al. (2011) among others. Inside the ISM, the radiative transport of depends strongly on dust extinction (Atek et al., 2014). This dependence, however, shows large scatter due to the complicated resonant scattering of , in which the visibility of the line is influenced by a large number of factors, including dust content (Charlot & Fall 1993; Verhamme et al. 2008; Atek et al. 2009; Hayes et al. 2010), dust geometry (Scarlata et al. 2009), neutral gas content and kinematics (Kunth et al. 1998; Mas-Hesse et al. 2003; Cannon et al. 2004), and gas geometry (Neufeld 1991; Giavalisco et al. 1996; Hansen & Oh 2006; Laursen et al. 2013; Duval et al. 2014). Taken together, these myriad factors indicate that the true total escape fraction of photons (; defined as the ratio of observed to intrinsic luminosity; Hayes et al. 2005, Hayes et al. 2013), is still poorly understood. Thus, photometric measurements of will reflect the underlying properties of galaxies only in the very broadest statistical sense.
The only way to remedy this complicated situation is to study the emission line in a sample of star-forming galaxies on a spatially resolved basis. From the UV perspective, obtaining images in the nearby Universe is expensive and requires space-based platforms. To this end, our team has acquired data from the Hubble Space Telescope (HST) to produce images of a statistically selected sample of star-forming galaxies in the low- Universe (see Östlin et al. 2014); details about the image processing methods can be found in Hayes et al. (2009). This program, called the “Lyman Alpha Reference Sample” (“LARS”), includes HST Cycle 18 imaging and Cycle 19 spectroscopic observations of 14 galaxies. These HST datasets form the backbone of a comprehensive multi-wavelength observational campaign that will allow great strides forward in our understanding of radiative transport. Since the LARS sample is selected on UV luminosity and H equivalent width, and not on characteristics, the composite sample was designed to overlap with both high- and low- star-forming galaxies. LARS will form a critical local interpretive benchmark for studies of high- galaxies for decades to come, and is well placed to take advantage of the remaining HST lifetime and motivate future observations with JWST.
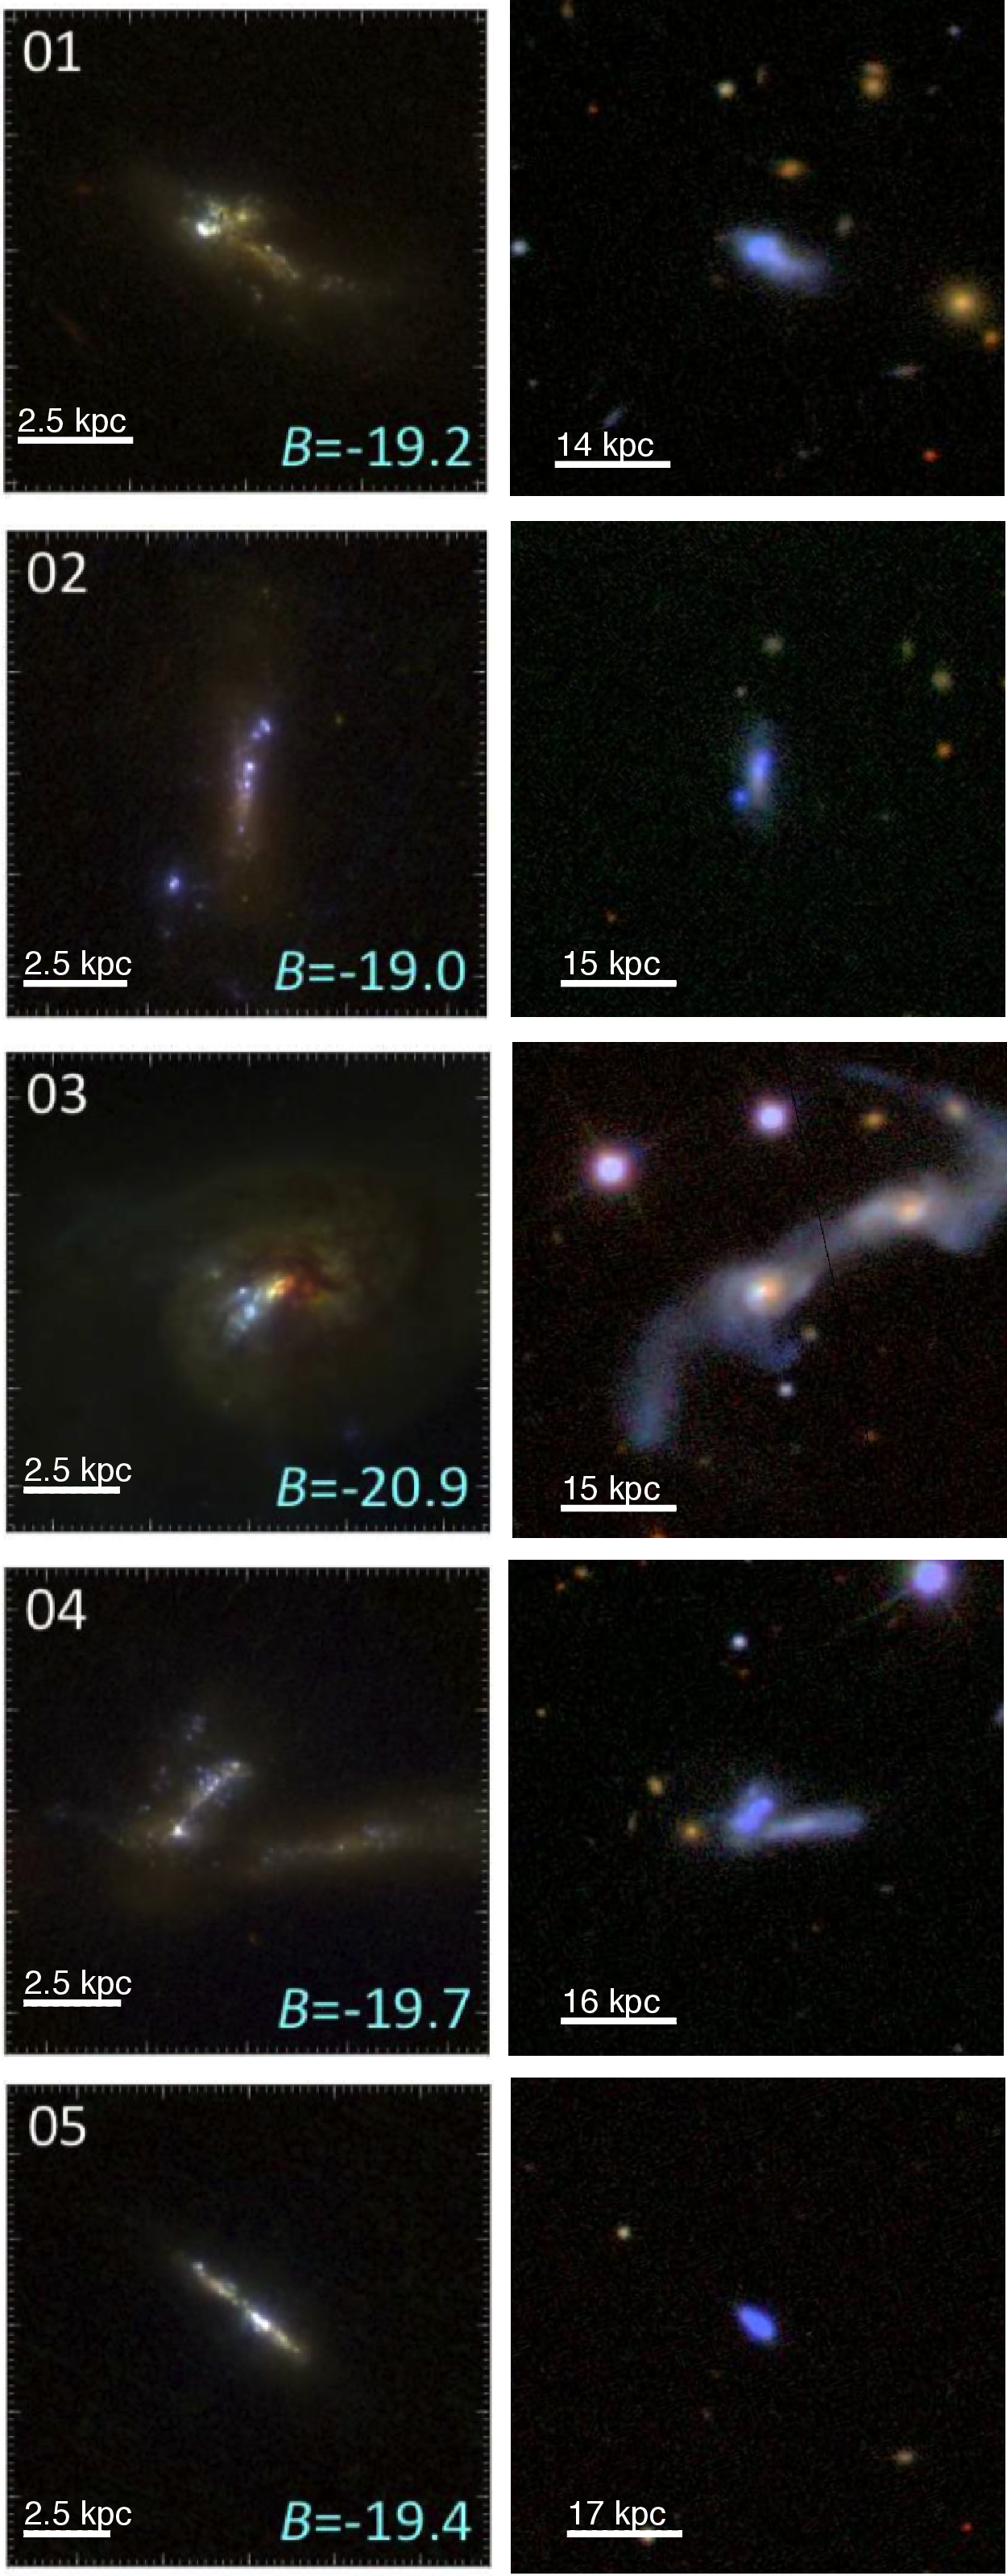
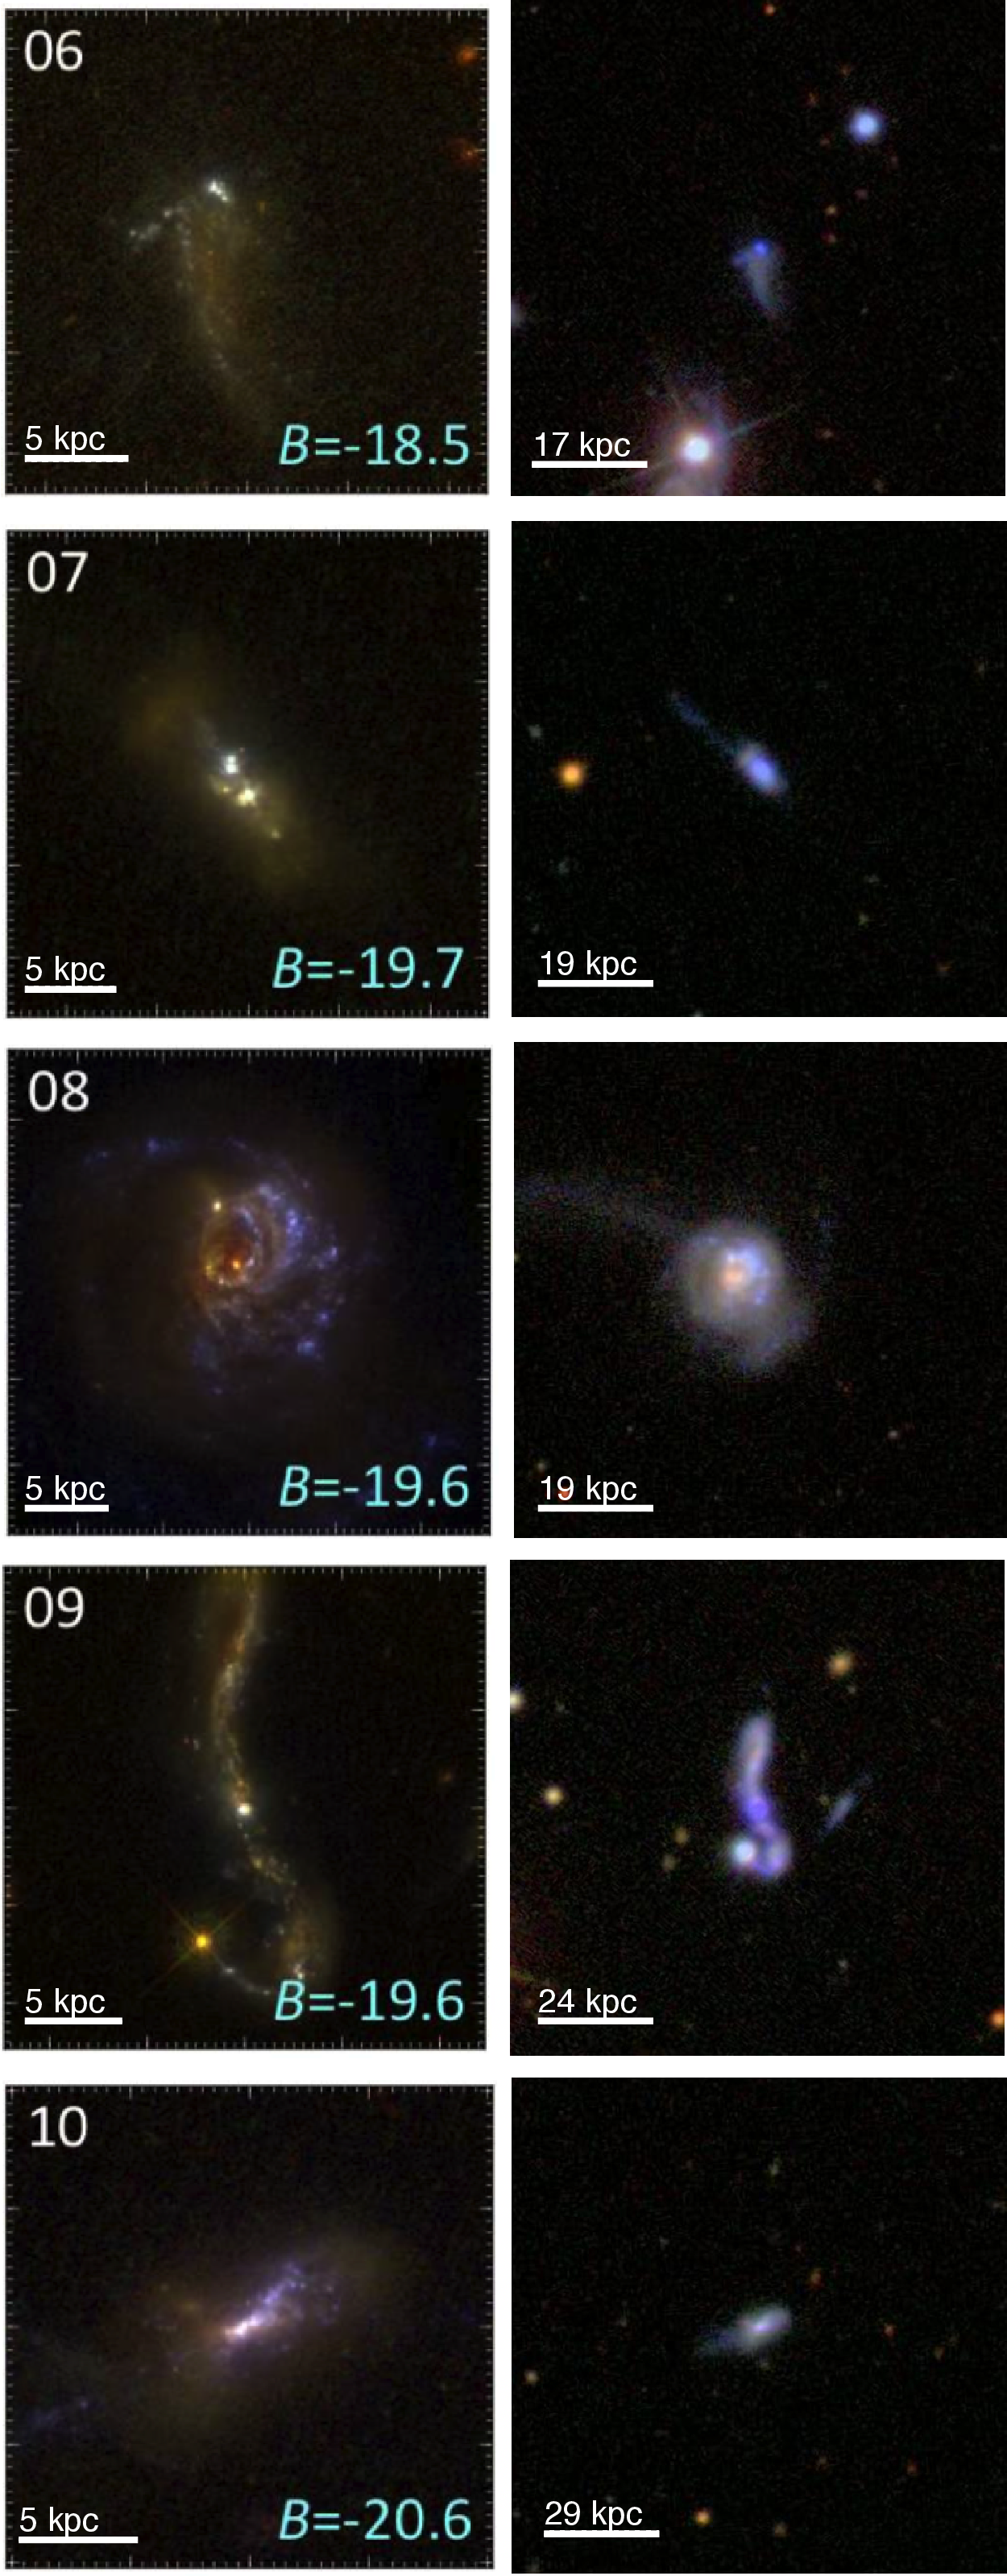
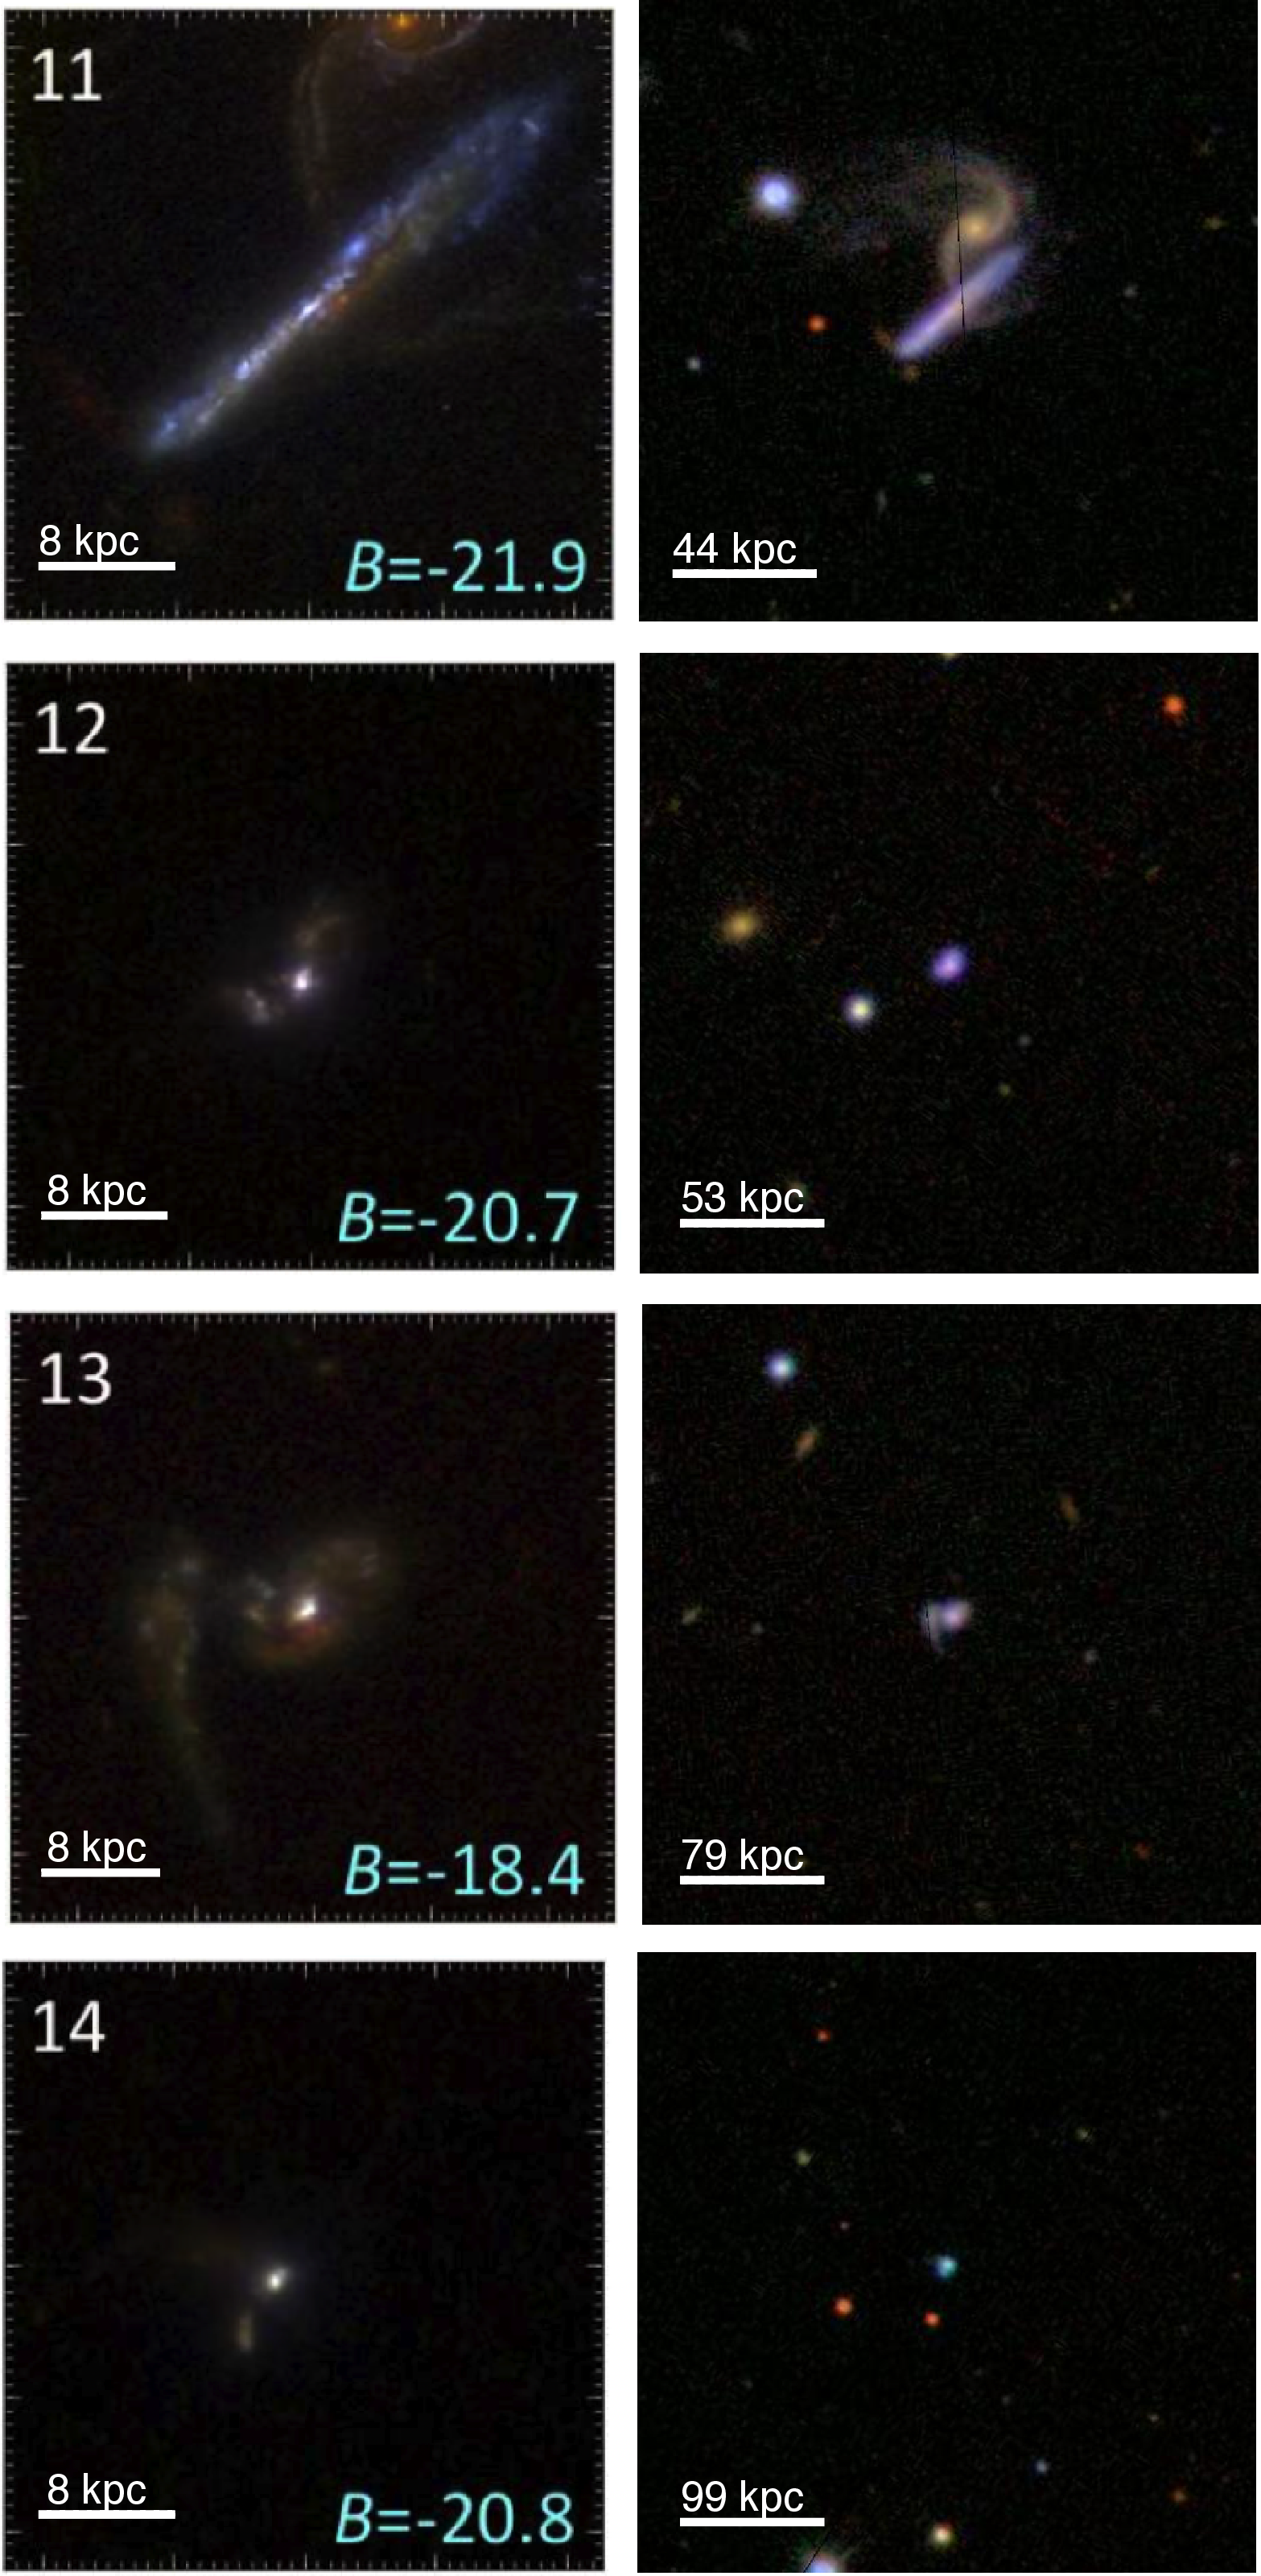
The LARS program (including sample selection) is described in detail in Östlin et al. (2014) and Hayes et al. (2014), hereafter referred to as Papers I and II respectively. Preliminary results derived from the images of the LARS galaxies are presented in Hayes et al. (2013). That work showed that in many LARS galaxies, emission is prominent on physical scales that exceed those of both the massive stellar populations and the star formation regions that give rise to the photons; this trend is very prominent in the panels of Figures 1, 2, and 3, which show optical and UV images of the LARS galaxies. This may point towards photons being resonantly scattered to large radii in most of the LARS galaxies, although other possibilities have been proposed, such as ionization caused by hot plasma (Otí-Floranes et al., 2012). It is likely that multiple of the aforementioned physical properties (dust content and geometry, neutral gas content, kinematics, geometry) are facilitating this efficient resonant scattering.
In order to decouple the effects of dust and neutral gas kinematics and densities, the images must be compared with spatially resolved information about the neutral ISM. While UV and optical absorption line spectroscopy offers one avenue to address this issue, such data are limited to those regions in the foreground of only the brightest continuum sources (usually the emission line nebulae themselves). While our team is pursuing such analyses (see Rivera-Thorsen et al., in preparation, and profile modeling from Orlitova et al., in preparation), these avenues should be complemented by direct probes of the neutral interstellar medium in all regions of the LARS galaxies. To this end, in this manuscript we begin a detailed exploration of the neutral hydrogen in the LARS galaxies by presenting new single-dish HI spectroscopy and spatially resolved interferometric H I imaging. We use these data to derive global properties and to study the properties of the H I gas on bulk scales.
Previous spatially resolved H I observations of galaxies in which radiative transport has been studied in detail are few. While the sample of systems with spectroscopic information about is robust, there are comparatively few systems that have direct imaging (see the discussion in Hayes et al. 2005, Hayes et al. 2009, Östlin et al. 2009, and references therein). For those systems that do, there has, until the present work, been no systematic investigation of the H I on a spatially resolved basis; only a few selected systems have detailed H I studies in the literature.
Cannon et al. (2004) presented H I observations of two of the most well-studied and nearby -emitting galaxies in the local Universe, ESO 338IG 004 (Tol 1924416) and IRAS 08339+6517. In each galaxy, extended neutral gas connects the target and nearby neighbors, suggesting that interactions have played an important role in triggering the massive starbursts in ESO 338IG 004 and IRAS 08339+6517. The close proximity of the companions suggests that the interactions were recent. Since both primary systems are emitters, these data support two possible interpretations of escape from starburst galaxies: either a) the bulk ISM kinematics provides the means of escape for photons by shifting H I atoms out of resonance, or b) the H I is sufficiently clumpy on scales below our resolution to allow for efficient escape. These interpretations are further supported by H I (Bergvall & Jorsater, 1988) and observations (Kunth et al., 1998) of ESO400-G43.
In this work, we begin to extend this type of analysis to the entire LARS sample. Basic properties of the LARS galaxies are summarized in Table 1. Figures 1, 2, and 3 show optical and UV images of the 14 LARS galaxies, with the left and right columns displaying the color HST images and the SDSS color images respectively. The right column includes the immediate surroundings, while the left column has smaller fields of view, and are scaled to show detail in the galaxies.
We organize this manuscript as follows. In § 2 we describe the data acquisition, reduction, and analysis. § 3 presents the single-dish H I profiles of the 14 LARS galaxies, while § 4 presents spatially resolved H I images of 5 of the 14 LARS systems. We discuss each system individually in § 5, and discuss various correlations between galaxy global properties in § 6. We draw our conclusions in § 7. Throughout this paper we adopt the value of H0 70 1.4 km s-1 Mpc-1 from the averaged WMAP 7 year data as presented in Komatsu et al. (2011).
2 Observations, Data Reduction and Analysis
2.1 GBT Data
We obtained data from the National Radio Astronomy Observatory 100m Robert C. Byrd Green Bank Telescope (GBT111The National Radio Astronomy Observatory is a facility of the National Science Foundation operated under cooperative agreement by Associated Universities, Inc.) under program GBT/11A-057 (Legacy ID QO13; P.I. Östlin). Data were acquired in four observing sessions in March and April of 2011. Position switching observations were performed for all sources; 32,768 channels over the 12.5 MHz of total bandwidth produce a spectral resolution of 381.469 Hz (0.08 km s-1 ch-1).
All reductions were performed in the IDL environment222Exelis Visual Information Solutions, Boulder, Colorado, using the GBTIDL package designed at NRAO. We first imported the raw data for each galaxy into GBTIDL using standard averaging techniques, with zenith opacity coming from atmospheric data from the NRAO CLEO weather system. The data was moderately contaminated by terrestrial radio frequency interference (RFI); bad data were identified by examining individual spectra, blanked, and interpolated.
The standard position switching algorithms in GBTIDL were used to produce a combined spectrum for each galaxy. To increase the Signal to Noise Ratio (SNR) of the observations we first averaged the reference spectrum by 16 channels. This procedure can have a negative effect on the baseline shape, increasing the order of the polynomial (often 3rd order) that we used to fit and subtract the continuum (see Table 2 for the order of the fit for each galaxy). The SNR was quite low on most of the LARS galaxies and we thus smoothed our spectrum by 256 channels resulting in a velocity resolution of 20km s-1. Flux and width measurements were taken on this smoothed profile. Two regions were selected by hand for each galaxy: the first around the profile, and the second in an area free from RFI (used as an RMS noise region).
The redshifts of the LARS galaxies (see table 1) place some of them in proximity to a bandpass filter in the 1.2-1.3 GHz region. This bandpass filter is designed to shield against a local radar signal, but contributes higher than usual system temperature (Tsys) values (and therefore system noise) to calibrated data in this frequency range. Further, the Tsys values fluctuated markedly from one spectral scan to the next. The affected galaxies were all non detections (LARS 12, LARS 13, and LARS 14) and have markedly higher Tsys values (in particular LARS 13) than would otherwise be expected. It should also be noted that these three galaxies are at the largest redshifts in our sample.
Systematically measuring the flux and width of irregular, low SNR, H I spectra can be challenging. To do so, we have modified previously well known measurement techniques and find that they are robust over the range of SNR and profile shapes in our data. Our measurement routines take as inputs the smoothed spectrum and the region suspected of containing the galaxy. In our initial tests of archival data for NGC 5291 (available in the distribution of GBTIDL), we found that hand selecting regions of the profile could add additional bias, causing the width and flux measurements to vary by 2-5%. Instead, we opted to use minimization techniques to fit Gaussian components (a single component fit for galaxies with a single peak and a multi component fit for double-horned profiles) to the smoothed spectrum. These components were used to guide later analysis and ensured repeatability in our results even with low SNR. These Gaussian fits serve only to guide analysis, however, and the flux and width measurements follow the methodology described in Springob et al. (2005). This method fits lines to the profile in the region over which it varies the most (here between 15% and 85% of the peak value) and measures width properties from these fits. Springob et al. (2005) found that this reduced the dependence on noise on their measurements versus direct measurements. We modified this method to respond better to low SNR values and to handle single peaked data more accurately. We consider this method to be the “best representation” of the width measurements for these spectra, although it is not the only method (e.g., the busy function; Westmeier et al., 2014). We recorded two SNRs based on the peak-to-rms ratio and on the integrated flux to integrated rms ratio.
The flux accuracy of GBT data using standard reduction techniques is quoted as 10% in the GBTIDL calibration guide. The primary error terms are the RMS fluctuations of the spectra in the region around the target and the subjectivity of selecting the baseline regions and RMS/profile regions. In testing it was seen that increasing the order of the baseline generally led to increasing error. We thus adopt a 10% flux error for “good” profiles and a conservative 20% for “irregular” profiles.
Special attention was paid to the error terms presented in Springob et al. (2005) as modified from Schneider et al. (1990). The error term given there adds an error associated with the quality of the baseline fit. Because we have assumed a separate baseline error, we remove this term to get a more or less standard error term:
| (1) |
where is the noise in units of Jy km s-1, and W is the area of integration for the profile. The width at 50% of the maximum value (W50) results reported are highly dependent on the accuracy of the method described in Springob et al. (2005) which, as mentioned in the above discussion, breaks down at lower SNRs.
The error for the width and systemic velocity measurements is based on the equations found in Schneider et al. (1990).
| (2) |
This equation is doubled to give the error of the width measurements W20 and W50, which refer to the width at 20% and 50% of the maximum, respectively.
2.2 VLA Data
We obtained D-configuration Very Large Array333The National Radio Astronomy Observatory is a facility of the National Science Foundation operated under cooperative agreement by Associated Universities, Inc. H I spectral line imaging of five LARS galaxies under program VLA/13A-181 (Legacy ID AC 1123; P.I. Cannon). These data were obtained with a standard WIDAR correlator configuration that provides 16 MHz of total bandwidth. 1,024 channels deliver a native spectral resolution of 3.3 km s-1. The data were acquired in March and April of 2013, during seven observing sessions; details are summarized in Table 3.
Data reductions followed standard prescriptions in CASA444Common Astronomy Software Application (CASA) is developed by the NRAO. and in AIPS555Astronomical Image Processing System (AIPS) is developed by the NRAO.. The wide bandwidth and frequency range of these observations resulted in a significant amount of radio frequency interference that was removed from the data. Bandpass and flux calibrations were derived using either 3C147 or 3C286 (see Table 3). The gains and phases were then calibrated using observations of the phase calibrators, which were typically separated by 20 minutes of on-source integration time. The wide bandwidth allowed for hundreds of channels of line-free continuum to be fit and subtracted. For LARS 02 and LARS 09, which each had two separate observing sessions, we combined the separate observations into a single dataset for each galaxy.
The calibrated data were then inverted and cleaned using the CLEAN algorithms in CASA. To maximize SNR, the datasets for LARS 04 and LARS 08 were spectrally smoothed to a final velocity resolution of 10 km s-1. A Gaussian UVTAPER was applied to produce cubes with beam sizes of 1′; the resulting cubes were then convolved to circular beam sizes. The beam sizes and rms noises of the final datacubes are summarized in Table 4.
Moment maps were derived using standard blanking procedures. First, each datacube was spatially smoothed to a circular beam size that is larger than the original. The resulting smoothed cube was then blanked at the 2.5 level, where is the rms noise in line-free channels of the cube. This blanked cube is then inspected by hand, and only features that are spatially coincident across two or more consecutive channels are deemed to be real emission and kept in the final blanked cube. This cube is then used as a blanking mask against the original, unconvolved cube. Moment maps are then derived using standard procedures. We assume a 10% uncertainty on the overall calibration and absolute flux scale of the VLA images.
It is important to emphasize that all of the LARS galaxies are at distances of more than 100 Mpc (zopt 0.028; see Table 1); even with angular resolutions that are exquisite for H I work (e.g., 5″ 2.4 kpc at a distance of 100 Mpc), we are sensitive only to the bulk H I properties of the neutral gas in these galaxies. As such, the VLA images presented here are used only to study the global morphology and large-scale H I kinematics. A detailed study of the H I on finer physical scales will require deep observations in more extended array configurations.
2.3 Data
We use global data for all 14 LARS galaxies as presented in Paper I and Paper II. The HST data were obtained with the Wide Field Camera 3 (WFC3) and Advanced Camera for Surveys (ACS) using H and H filters, and a combination of U, B, and I bands for FUV continuum imaging. We also acquired data with the Solar Blind Channel using a bandpass designed to isolate emission.
We reduced imaging data using MULTIDRIZZLE666Fruchter, A. and Sosey, M. et al. 2009, ”The MultiDrizzle Handbook”, version 3.0, (Baltimore, STScI) in the standard HST pipelines and used the Lyman-alpha extraction Software (LaXs) (Hayes et al., 2009) to continuum subtract the UV data. We refer the reader to Paper I and II for details of this process. The final global properties (see Paper I and table 5) are measured within apertures that correspond to twice the Petrosian radius ( = 0.2; Petrosian, 1976). This reduces the effect of noise on the measurements at large radii.
3 GBT HI Global Profiles
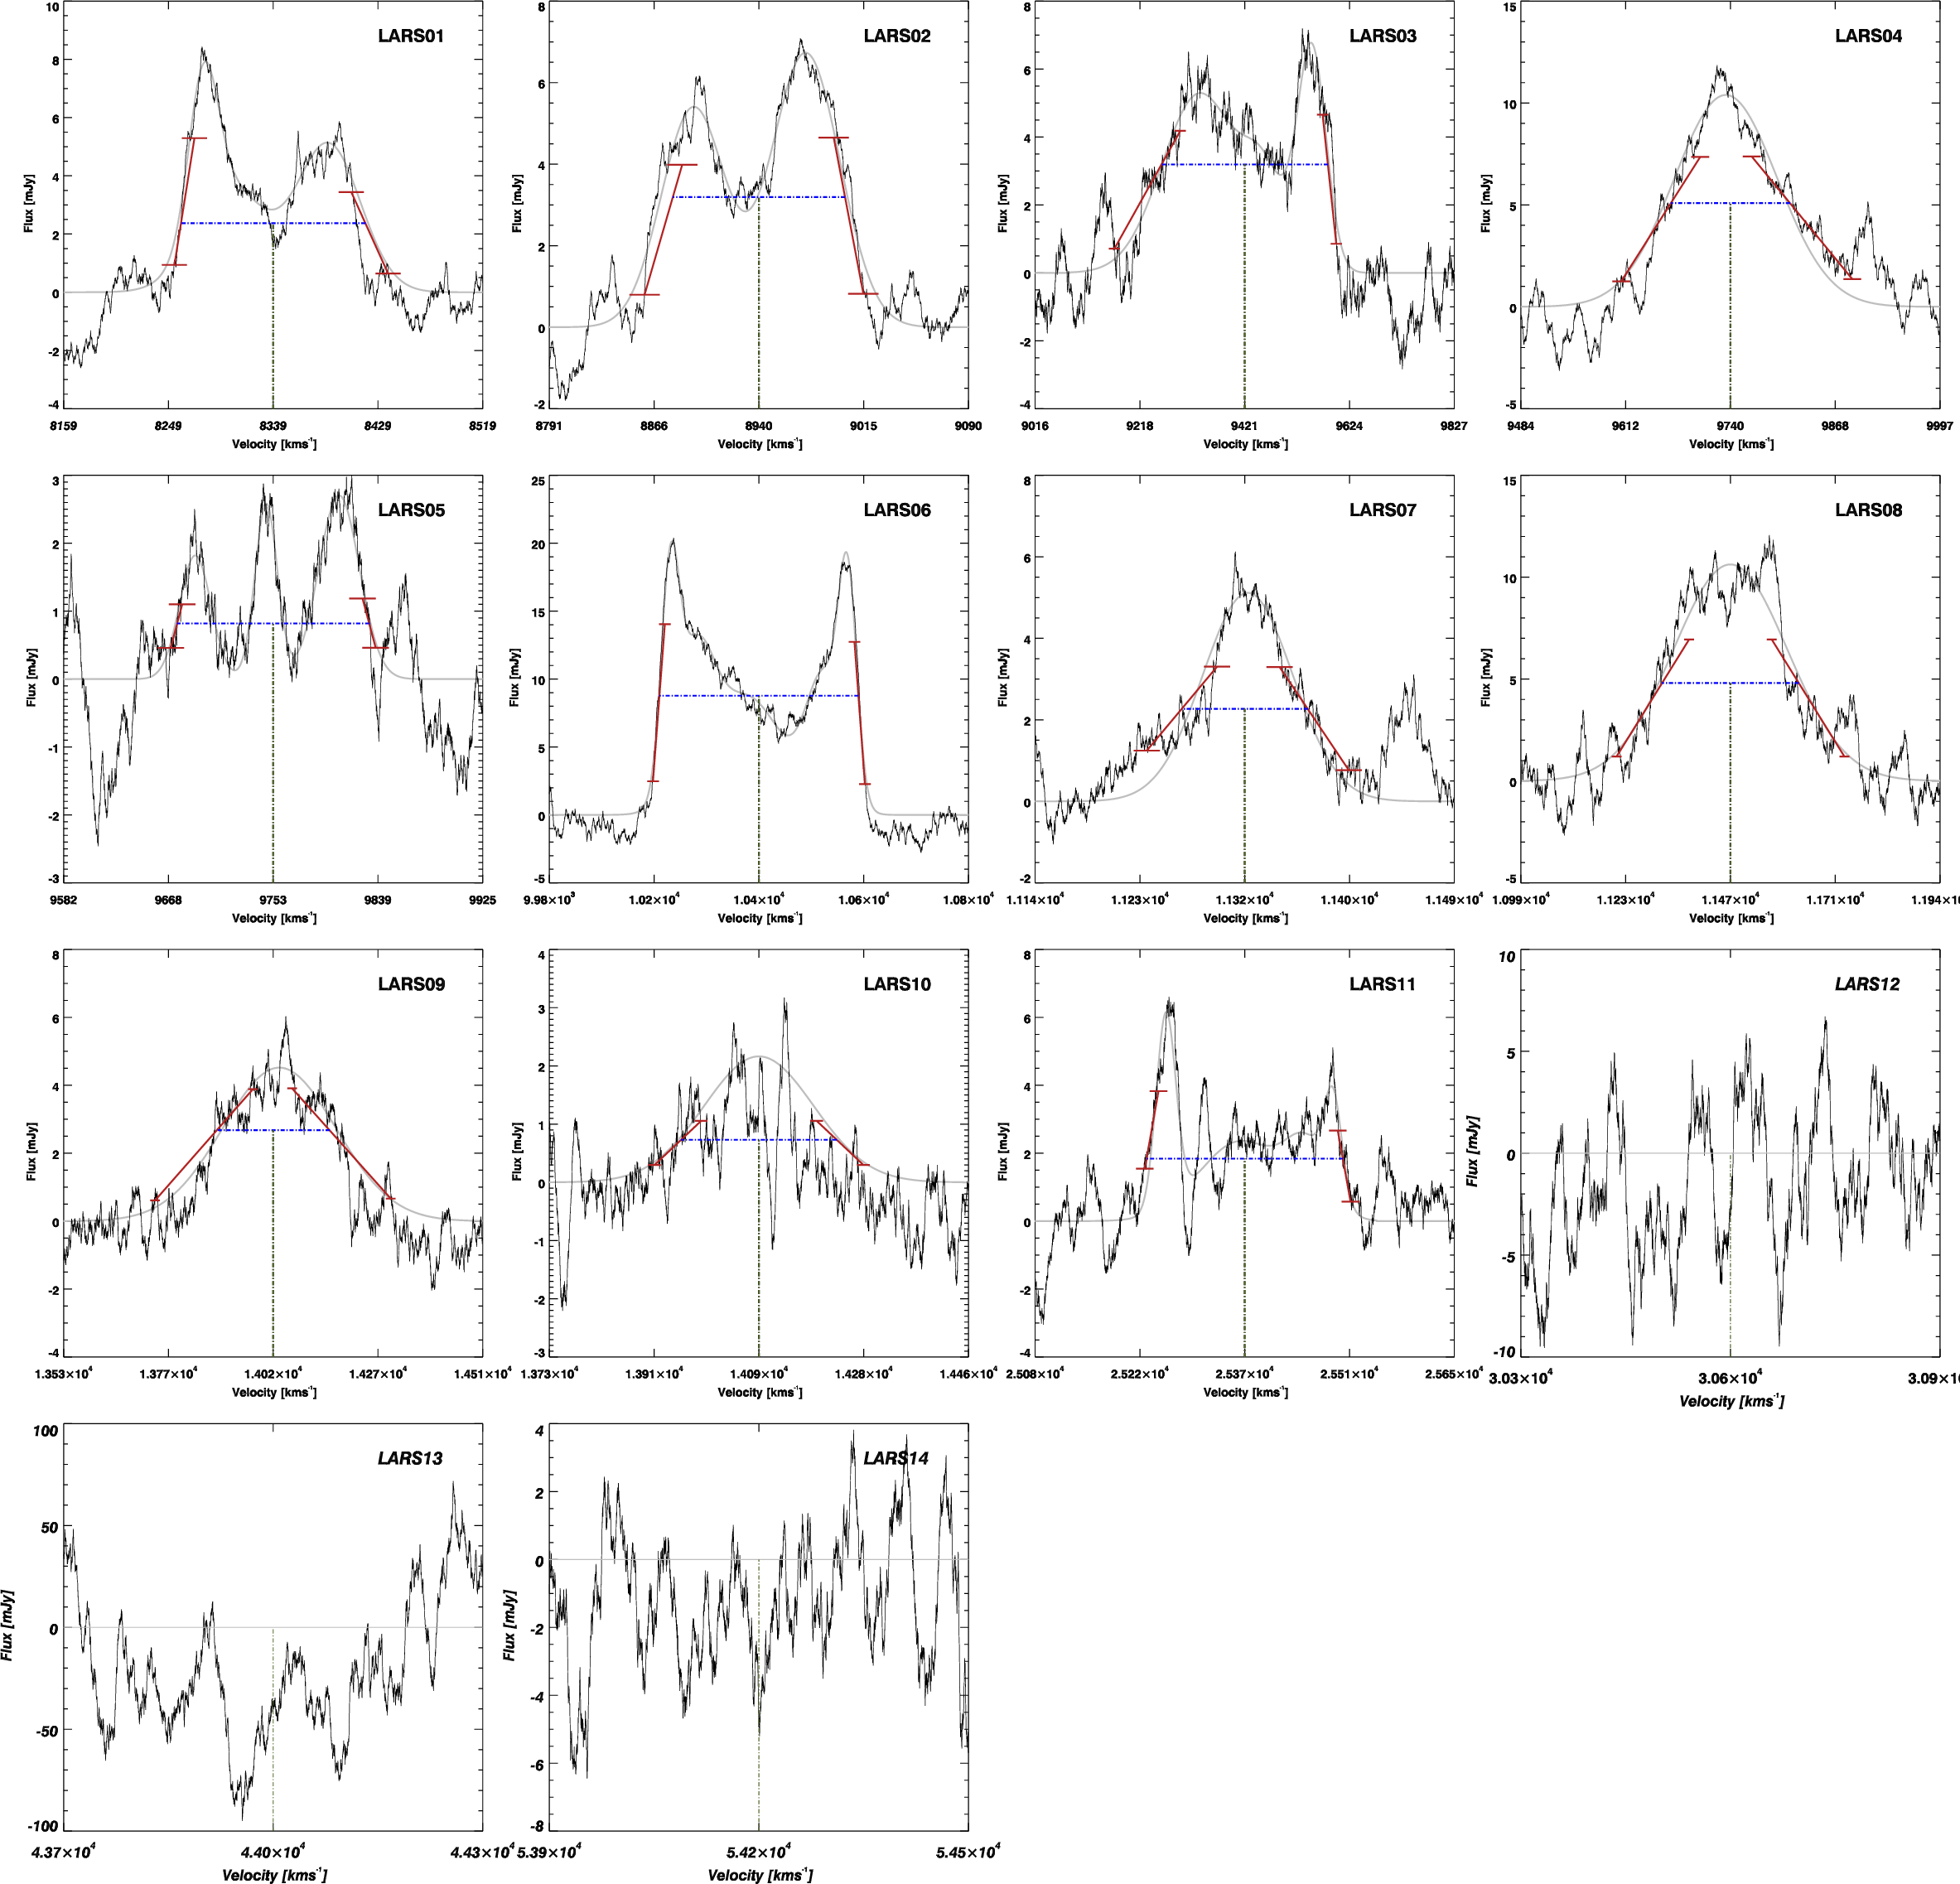
Presented in Figure 4 are the fully smoothed and reduced GBT H I profiles of the LARS galaxies. Plotted over these are the Gaussian fits in gray, solid lines in red showing the sides of the profile used in the peak W50 calculations, and the peak W50 line itself shown as a horizontal blue dotted line. A discussion of each galaxy is included below.
The observed properties from our GBT observations of each galaxy can be found in Table 2 along with properties derived from these using methods described below. The distances of each galaxy are calculated from the standard LARS luminosity distances. The H I mass in units of M⊙ is calculated via where D is the distance in Mpc and SHI is the H I flux integral in units of Jy km s-1. We will discuss the mass value for each galaxy in section 5. Overall we find that our detections and mass estimates show a strong dependence on distance.
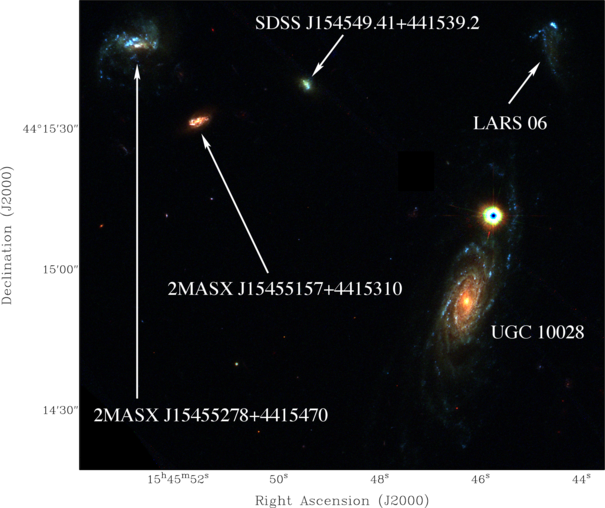
It is important to emphasize that the 8′ primary beam of the GBT at 21 cm is sensitive to all H I-bearing objects in the observed frequency range. Even for the closest LARS galaxy (LARS 01; D=120 2.4 Mpc), this 8′ beam subtends a projected circular area that is nearly 280 kpc in diameter; the potential for contamination in the GBT beam is significant. We thus examined SDSS images of the area surrounding each LARS galaxy for nearby objects. Objects with spectroscopic data available from SDSS that might have contributed to the GBT flux are noted below. These objects have velocities within 300 km s-1 of the target LARS galaxy and are within the 8′ primary beamsize of the GBT. Optical images of the fields that contain possible confusing sources (LARS 06 and LARS 11) are shown in Figures 5 and 6; these two sources are discussed in more detail in § 5. We used the SDSS g band to convert to luminosity Lg, which we compared with a log(MHI/LB) value of 0.5 for late type galaxies found in (Haynes & Giovanelli, 1984). The masses of potential contamination galaxies are computed from this ratio. We also use the 22.2 magnitude limit for the SDSS to determine the possible contributions from optically dim sources of contamination. For our closest nine galaxies this is roughly 106 M⊙ of H I; this increases to 108 for our furthest two systems. This information is also presented in Table 2.
The profiles in Figure 4 show a variety of H I structure. Some galaxies are simple single peak profiles (e.g, LARS 04, LARS 09), while others show complex and asymmetric profiles (e.g., LARS 01, LARS 03). Still other systems have H I spectra that are almost certainly confused; the classic double-horn profile of LARS 06 is likely due to the contribution of UGC 10028, a large spiral galaxy located only 1′ to the southeast of LARS 06 (see Figure 5).
Various observed properties of each GBT H I profile, and the quantities derived from these, are tabulated in Table 2: column 1 identifies the galaxy number; column 2 is the systemic velocity in km s-1; column 3 is the linewidth at 50% in km s-1; column 4 is the linewidth at 20% in km s-1; column 5 is the velocity offset between the optical velocity and the H I central velocity; column 6 is the the single-dish integrated flux in Jy km s-1; column 7 is the mass from the single-dish measurements in units of 109 M⊙; column 8 is the SNR from the integrated flux and the peak; column 9 is the rms noise value of the GBT in units of mJy; column 10 gives the baseline polynomial fit used in the calibration of the GBT spectrum; column 11 is the classification of the profile (‘S’ for single-horned, ‘D’ for double-horned, ‘N’ for no detection, ‘I’ for highly irregular shapes, or the presence of RFI near the signal region, and ‘C’ for confusion due to known nearby galaxies.)
4 VLA H I Images
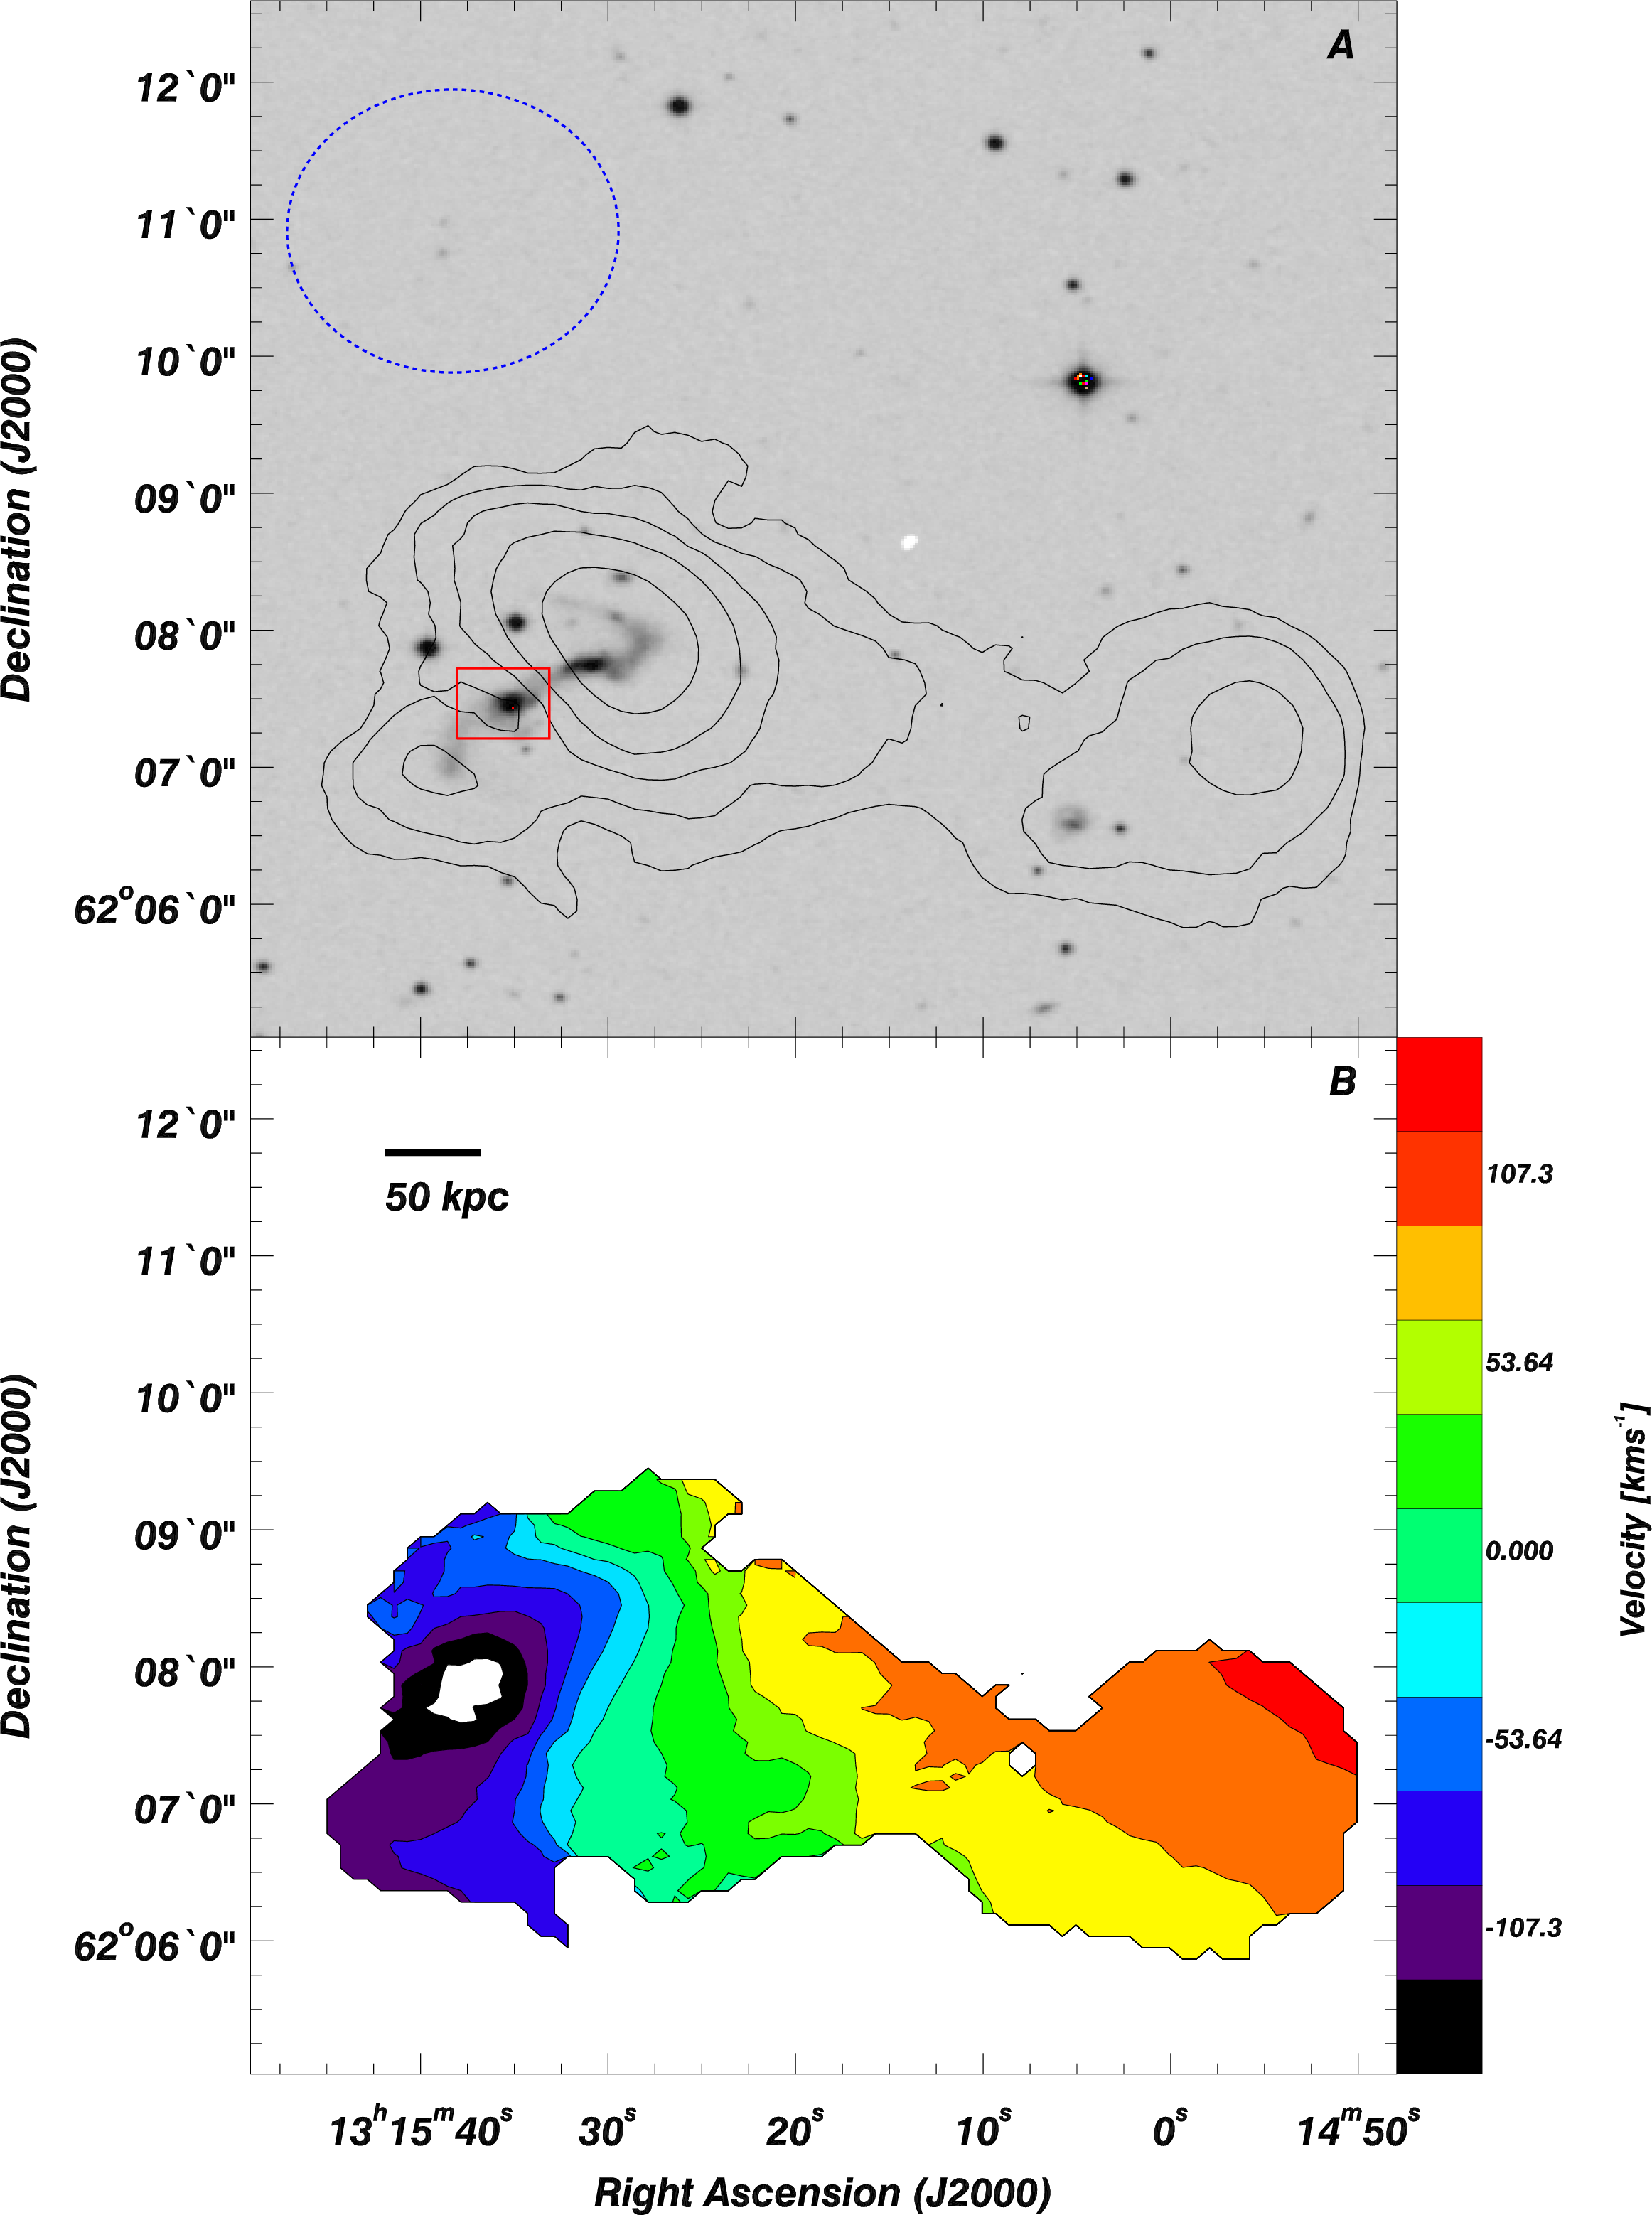
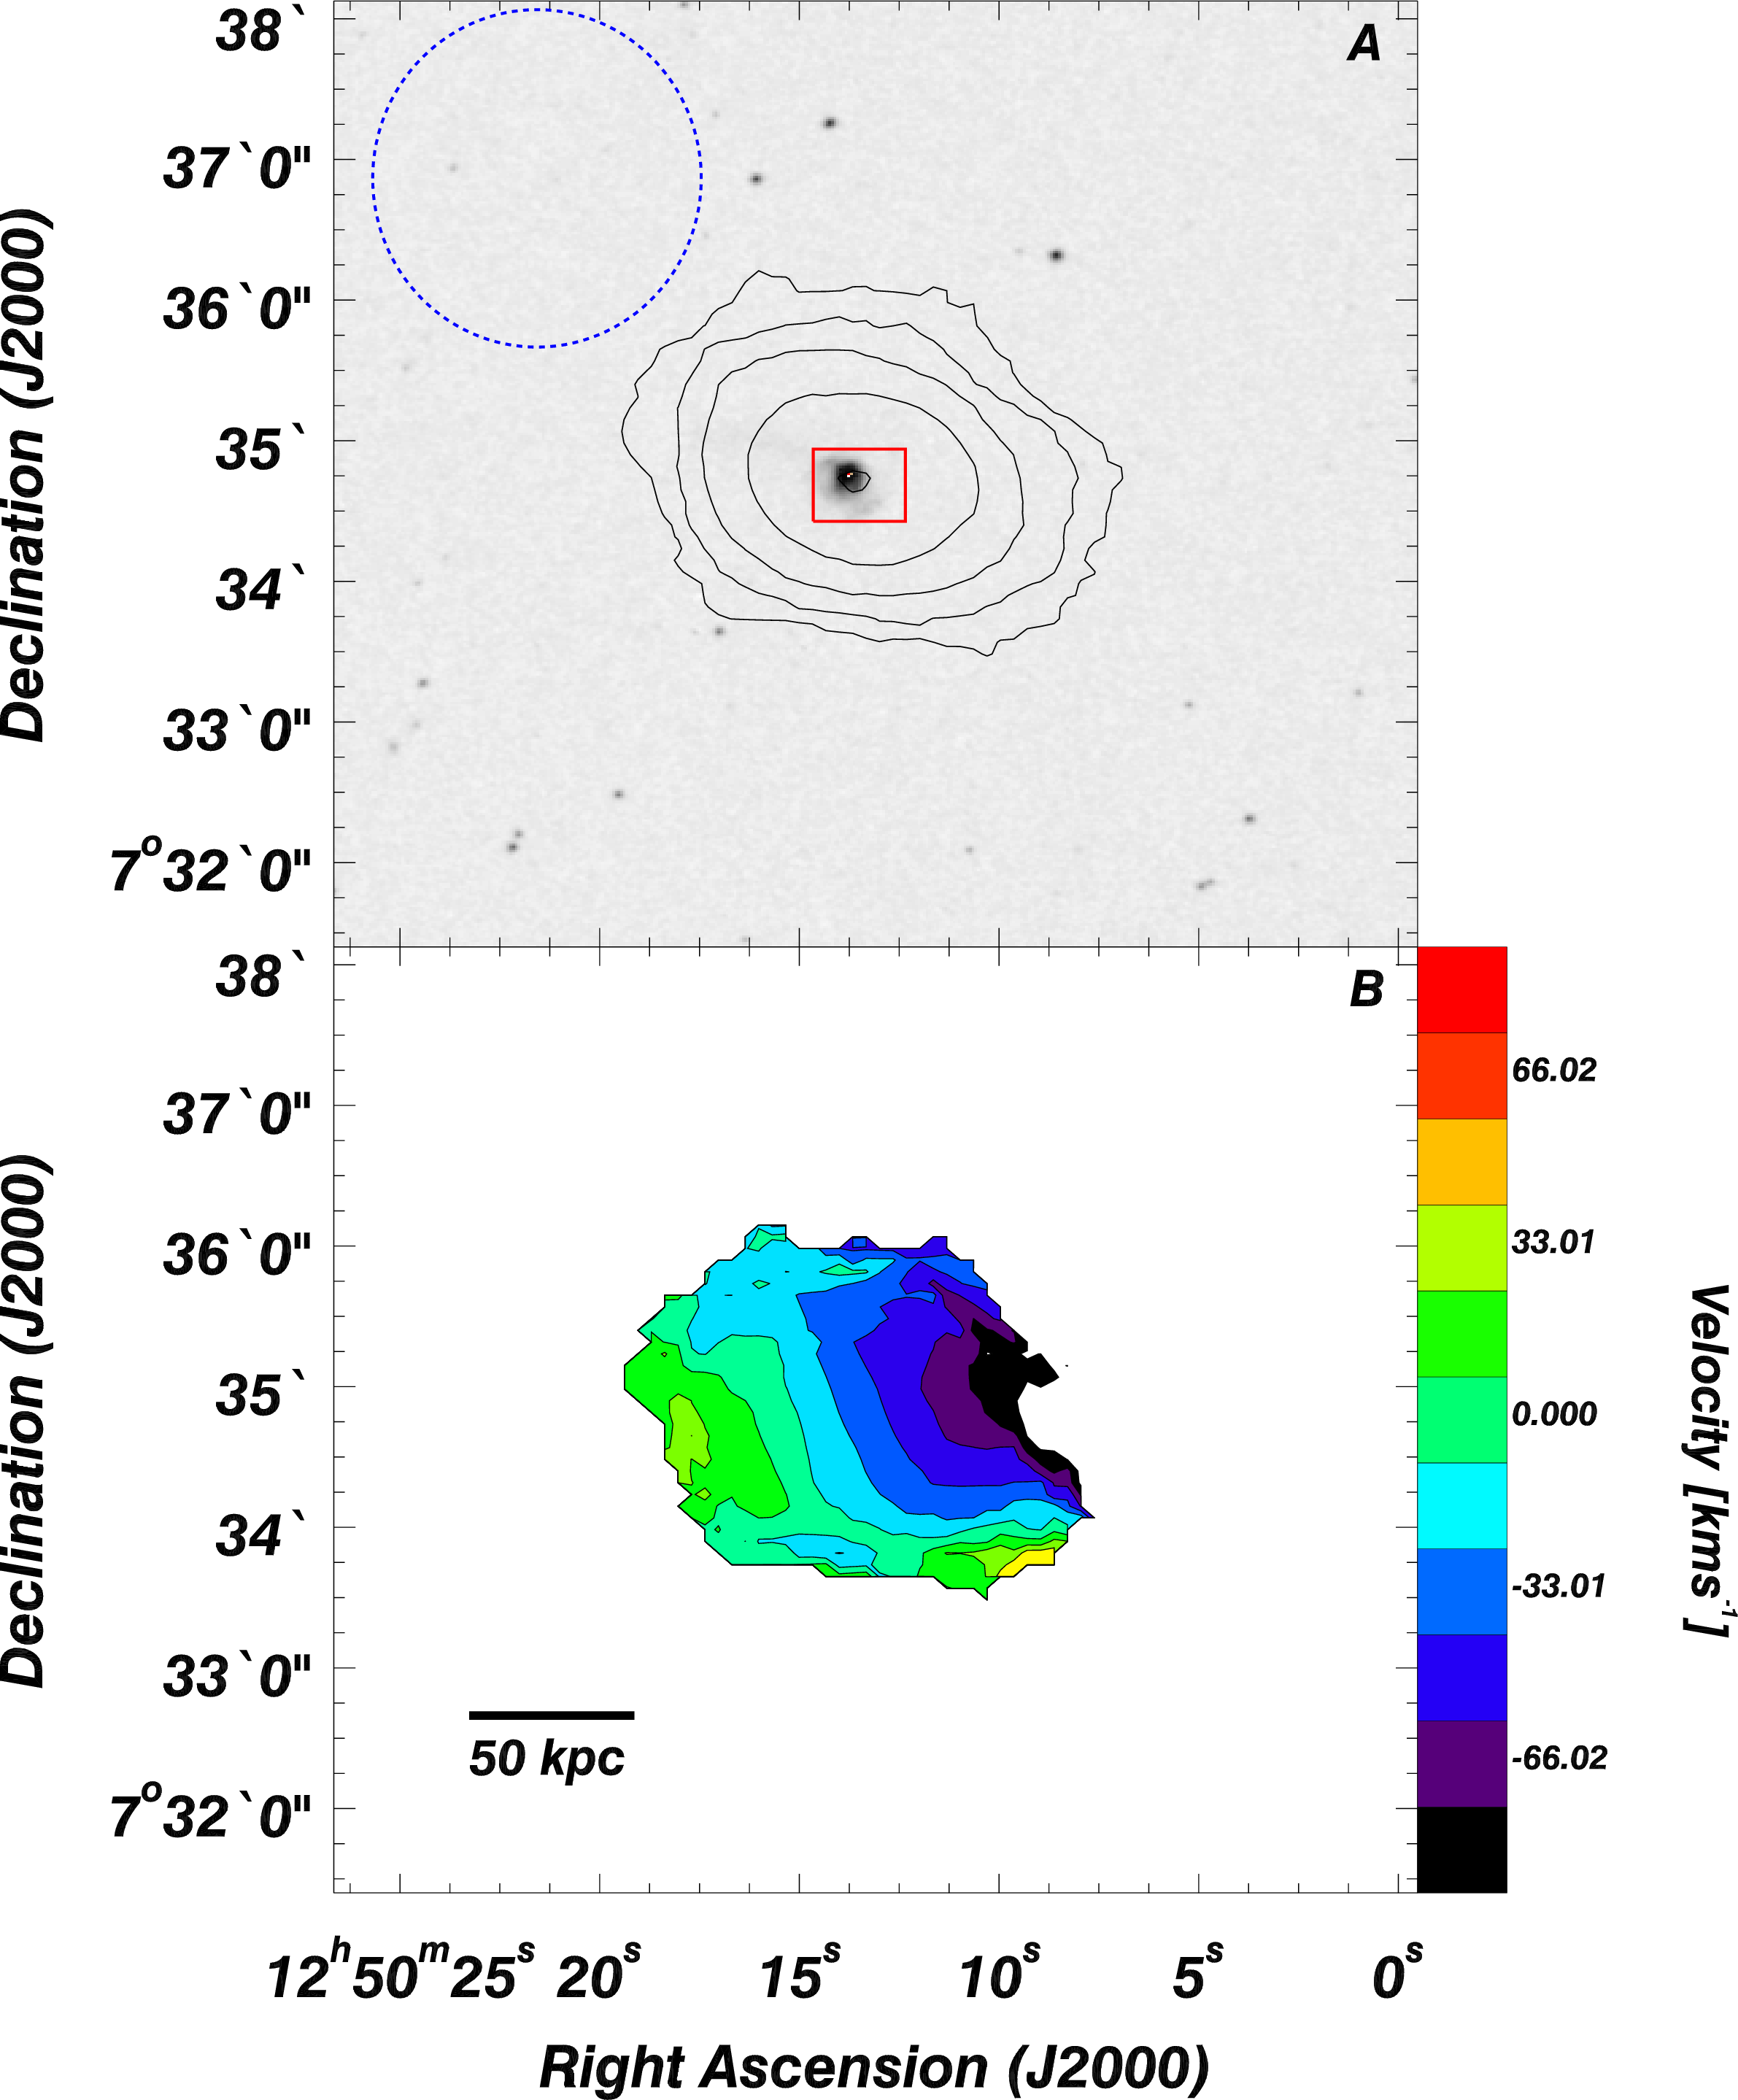
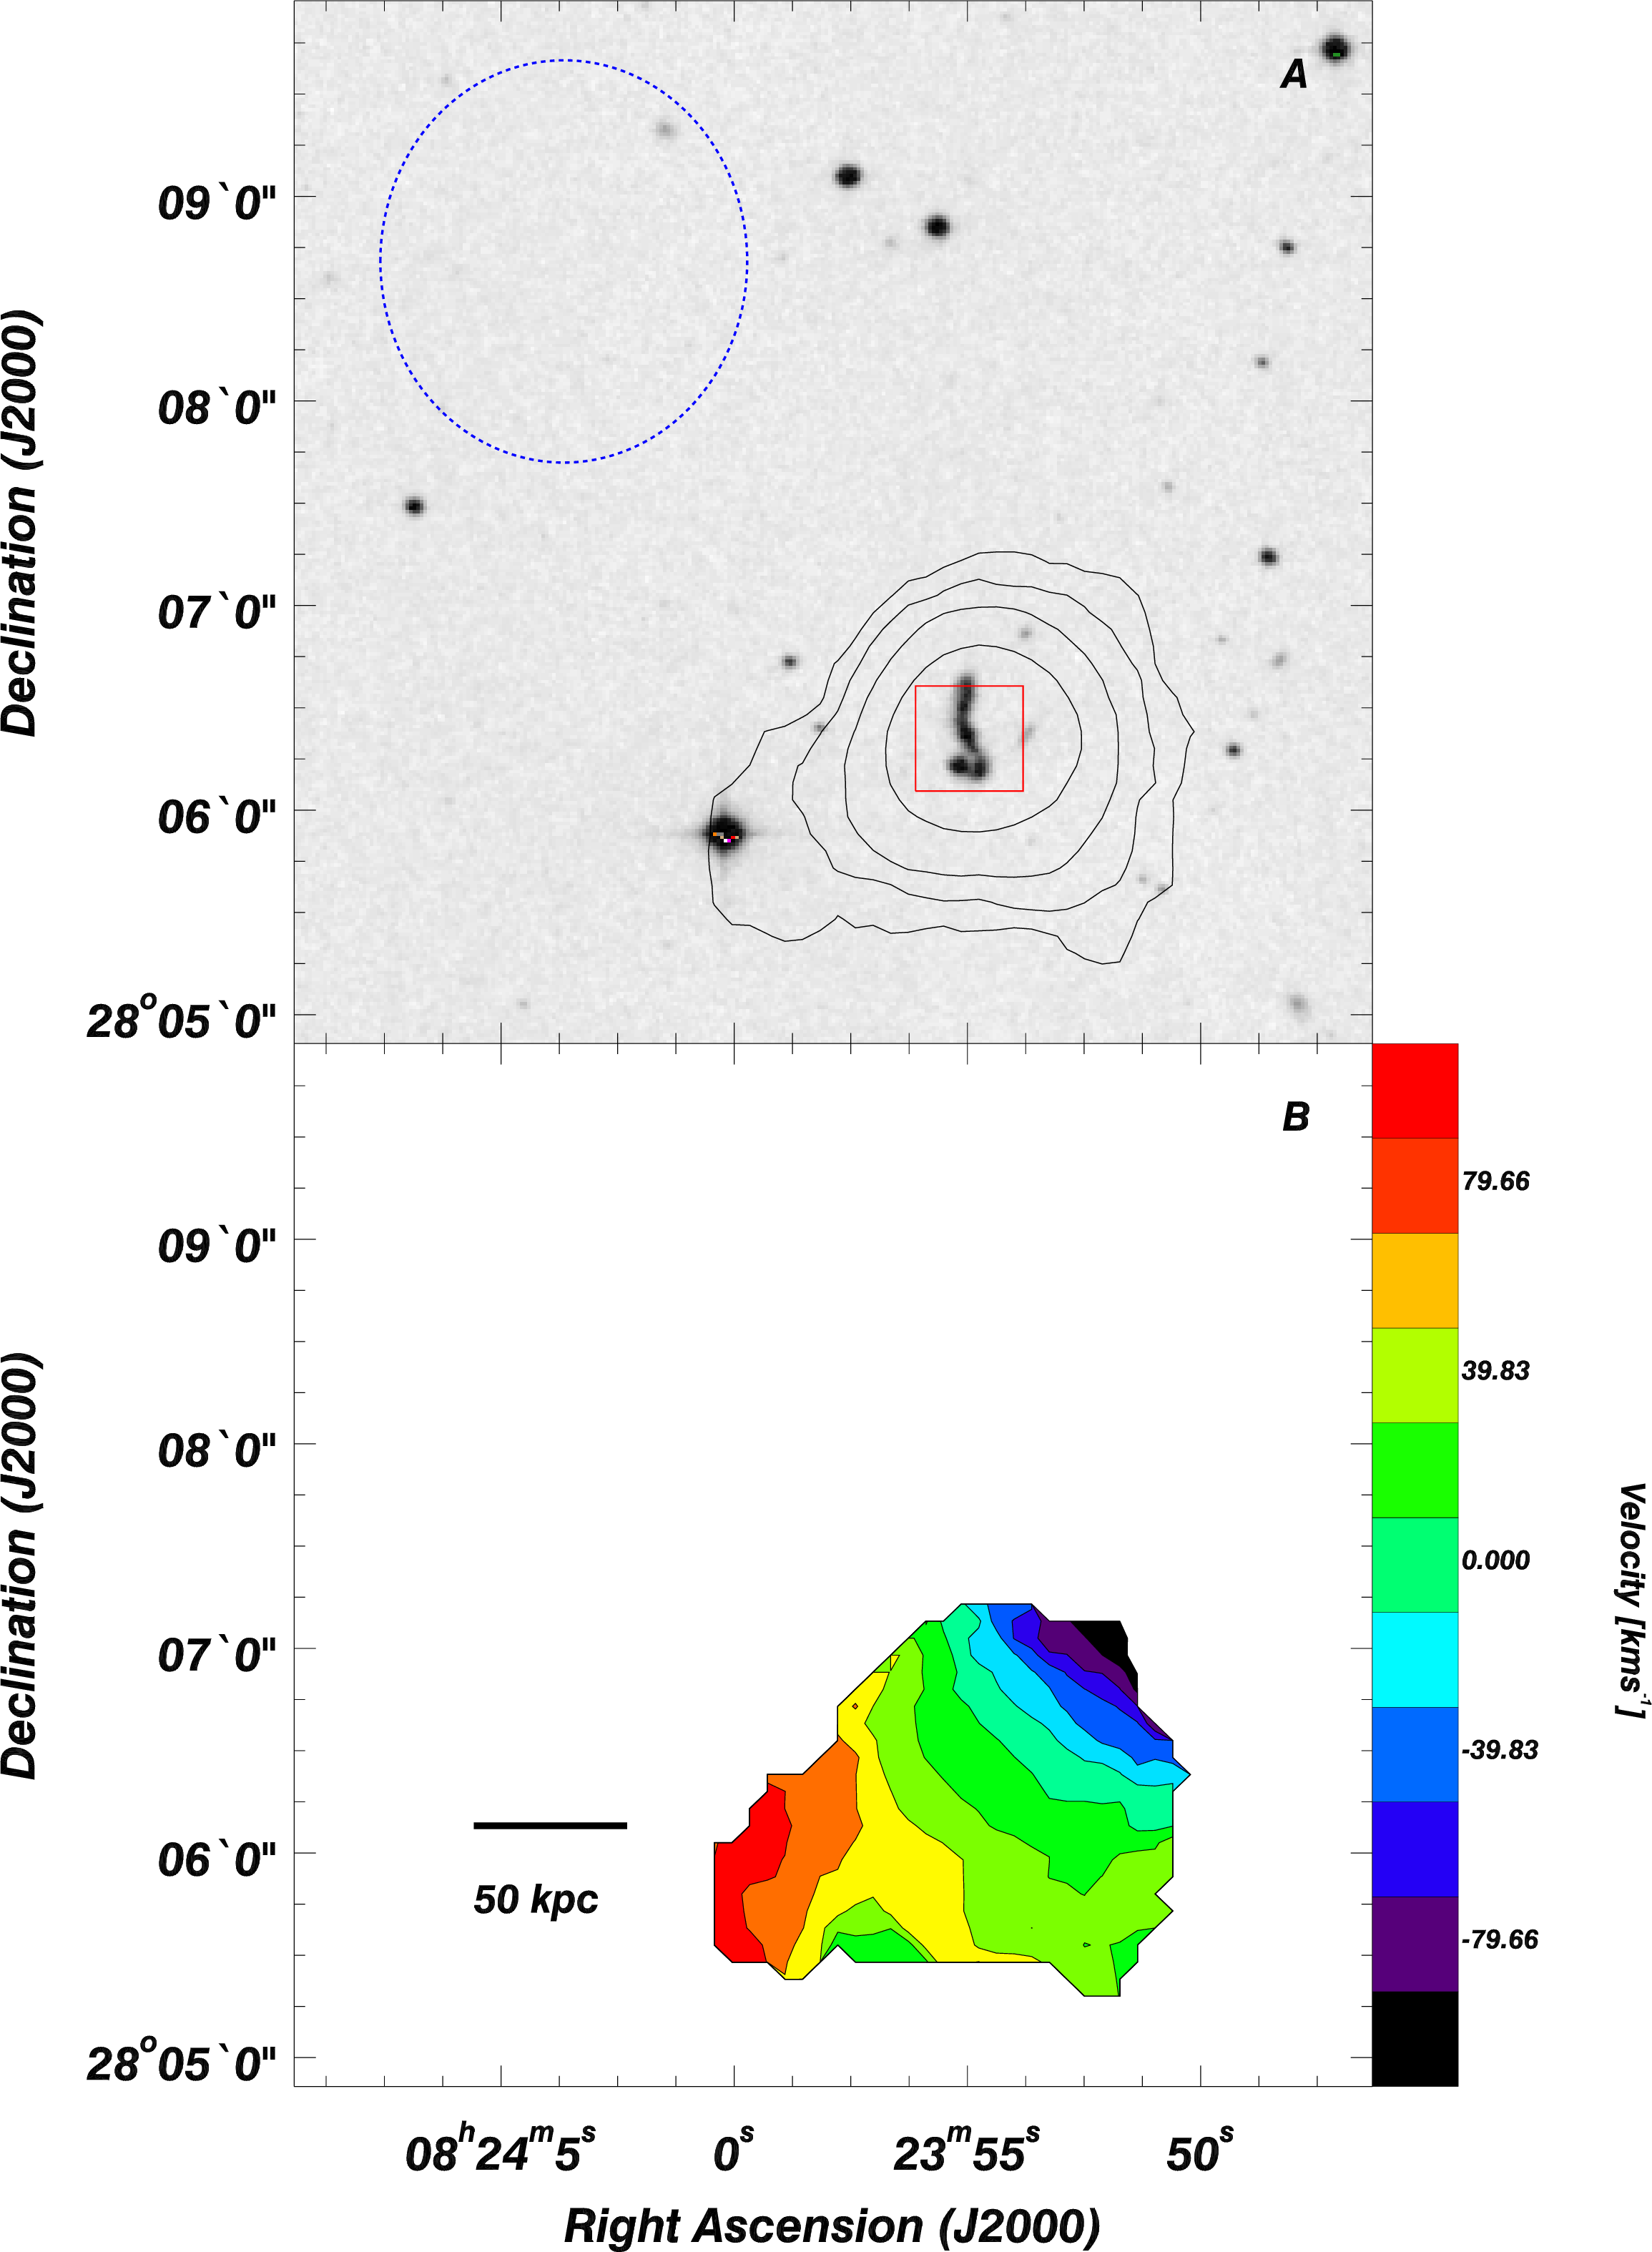
The H I moment zero (representing H I mass surface density) and moment one (representing intensity-weighted velocity) images of the 5 LARS galaxies observed in program 13A-181 are presented in Figures 7, 8, 9, 10, and 11. In panel (a) of each figure, a Digitized Sky Survey image is overlaid with contours of H I mass surface density (individual contour levels are provided in the caption to each figure). The beam size is shown by a blue circle, while a red square shows the location of the HST pointing for which we have UV imaging (see discussion in Paper I and II). In panel (b) of each figure, the H I moment one image (representing intensity weighted velocity) is presented in a rainbow color format; the velocity scale of each galaxy is shown by a colorbar.
Based on the distances and optical angular sizes of the LARS galaxies (of order 1′ or less; see Figures 1, 2, and 3), one would expect the H I to be distributed on similar angular scales. At the resolution of these data (beam sizes between 59″ and 72″), the LARS galaxies would thus appear as unresolved sources in the H I data cubes. As we discuss below, three of the LARS galaxies have H I morphologies consistent with this interpretation. Surprisingly, two of the sources have H I distributions that largely exceed the beam size; we discuss these sources in detail below.
It is important to stress that even in cases where galaxies are unresolved by an H I beam, one can still extract bulk characteristics of the neutral ISM because of the spectrally resolved nature of the data. Detailed kinematic analyses (e.g., rotation curve work or spatially resolved position-velocity diagrams) will be unavailable in such cases. However, within the spatial and spectral resolution elements of the data, one can derive bulk constraints on the motions of the H I gas.
We use the VLA H I images of the 5 LARS galaxies presented here to constrain two critical properties. First, the H I data allow us to localize the H I associated with the LARS galaxy. This in turn allows us to accurately measure the total H I mass of each system. These interferometric measurements often recover less of the H I flux, and therefore mass, than the GBT measurements. We attribute this to the low SNR of H I in these galaxies, the possible presence of low surface brightness H I features missed by the VLA in extended regions or velocity space, and flux contamination from other galaxies, although we suspect that this is only relevant in the cases marked as confused.
It is interesting to note that at the distances of the LARS galaxies, interferometric observations are perhaps better suited to determine the H I mass than single-dish observations (for example, the 60″ characteristic resolution of the present data are about a factor of three better than the H I beam of Arecibo, the largest single-dish radio telescope in the world, and a factor of eight better than our GBT resolution), simply because of the potential for contamination in the single-dish beam. Second, the present data are sensitive to large-scale distributions of H I gas, some of which is expected to be tidal in origin based on the optical morphologies of the LARS galaxies alone (see, e.g., Figures 1, 2, and 3).
In Table 4 we present VLA H I quantities for our five targeted galaxies derived in the same method as described above for the GBT data. Column 1 identifies the galaxy number; column 2 is the systemic velocity in km s-1; column 3 is the linewidth at 50% in km s-1; column 4 is the linewidth at 20% in km s-1; column 5 is the velocity offset between the optical velocity and the H I central velocity; column 6 is the the interferometric integrated flux in Jy km s-1; column 7 is the mass in units of 109 M⊙; column 8 is the rms noise value in units of mJy/Beam; column 9 is the median global column density of H I from a column density map convolved with the beam size given in 1019 cm-2.
5 Discussion of Individual Galaxies
We now present discussion of each LARS target based on our new H I data and on the HST imaging presented in Hayes et al. (2013), Paper I, and Paper II.
5.1 LARS 01
LARS 01 is a strong emitter, with a global EW of 46 Å (Paper I) and a moderate star formation rate (a few M⊙ yr-1). The single-dish H I observations (see Figure 4) reveal an asymmetric double-horn profile with peak SNR of 6.5 and linewidth at 50% of 160 km s-1. We recover a total H I flux of 0.7 Jy km s-1 which at our distance of 118 Mpc gives an H I mass of 2.3 M⊙. A search of the SDSS field revealed no other objects within a 300 km s-1 velocity range.
Assuming that the H I profile is unconfused, the asymmetric line shape and offset from the optical velocity is suggestive of bulk outflow of H I. Consistent with this interpretation is the observation in Paper II that LARS 01 shows extended H and H emission. Further, preliminary results from COS spectroscopy show that within the COS aperture (2.5″ diameter), large column densities of neutral hydrogen are outflowing at around 128 km s-1 with respect to the H velocity. Note that LARS 01 will be studied in detail within Paper I, while Rivera-Thorsen et al. (in preparation) will present the COS analysis of the whole sample. Interstellar metal lines are blueshifted with respect to the systemic velocity of the galaxy, and there is a distinct lack of static gas in the COS aperture. This is consistent with the recent results from Wofford et al. (2013), whose analysis of the interstellar OI, Si II and CII lines in this galaxy also yields an outflow of the neutral gas at 130 km s-1 (not including the geocoronal velocity offset applied by these authors). This large shift is also seen in our measurement of the systemic velocity of H I in LARS 01.
As the closest LARS galaxy, future interferometric H I observations of LARS 01 will be especially interesting.
5.2 LARS 02
This galaxy is the strongest emitter (in terms of escape fraction) in the sample with a EW 82 Å, yet has one of the lowest (H or UV-based) star formation rates. The GBT spectrum is double peaked (see Figure 4) and has a linewidth 140 km s-1. The total single-dish H I flux is 0.7 Jy km s-1, which gives a mass of 2.7 M⊙ at our derived distance of 127 Mpc. We find no sources of potential contamination in the SDSS field.
The VLA images of LARS 02 (see Figure 7) reveal a compact distribution of H I gas; the H I is only slightly resolved by the 59″ (36.3 kpc) beam. The H I column densities peak at 2 1020 cm-2 (although the marginally resolved nature of the source strongly suggests that the H I distribution is more localized, with correspondingly higher mass surface densities). There is evidence for coherent rotation in this source; the isovelocity contours shown in panel (b) of Figure 7 are parallel from 15 – 15 km s-1of the systemic velocity of 8960 km s-1. A coarse estimate of the dynamical mass of the system can be made by assuming that this rotational velocity is occurring over the angular diameter of the beam, and that the total projected rotation velocity is symmetric about a dynamical center. The resulting Mdyn = 3.8 109 M⊙ (which will increase for any non-zero value of disk inclination, but will decrease depending on the actual size of the rotating component of the disk) is consistent with the interpretation in Paper II of LARS 02 being among the more dwarf-like systems in LARS. We stress that this dynamical mass estimate is meant to be representative only.
5.3 LARS 03
LARS 03 is the nuclear region of the southeastern galaxy in the spectacular Arp 238 interacting pair. Note that Figure 1 shows the large-scale interacting morphology very clearly in the SDSS panel, while the HST imaging covers only the southern of the two nuclei, and only a relatively small portion of the total interacting system. Paper II finds that LARS 03 is a weak emitter. Interestingly, the luminosity increases as a function of distance from the source, suggesting that photons are readily being scattered to large distances even though the extension parameter (, defined as the ratio between the and H Petrosian radii) is unity.
Based on the interacting morphology of the system, we expect both an irregular global H I profile and extended H I structure. Both of these expectations are borne out by the data. The GBT profile of LARS 03 (see Figure 4) is double-peaked and asymmetric. The linewidth exceeds 300 km s-1 at the 50% level, and there is evidence for low surface brightness H I emission on even larger velocity scales (W20 = 380 62 km s-1, and the profile shows weak evidence for H I emission over a range as large as 600 km s-1).
The H I morphology and kinematics of LARS 03 clearly indicate a violent interaction between the two galaxies. The H I emission is extended many beam sizes beyond the optical galaxy. As shown in Hayes et al. (2013), emission is found in the southeast of the two interacting galaxies (although those authors point out that the nature of emission on larger spatial scales is not constrained by data presently in hand). Our VLA images reveal that the H I surface density maximum is coincident with the Northwest of the two interacting galaxies (although this is within one beam width at the present spatial resolution). This region is not included in the present HST observations. The total H I mass in the interacting system is 9 109 M⊙, and the average H I column density as revealed by our VLA beam is 4.8 cm-2. An enormous tidal feature, which is contiguous in velocity space from the two interacting galaxies, extends 160 kpc to the west-southwest and contains 1.6 109 M⊙ of HI gas. Because of the large distance separating this component from the main body of LARS 03 we decide to remove this mass from the total H I mass estimate of LARS 03 itself. This extended tidal structure is reminiscent of that in the local -emitting starburst galaxies Tol 1924416 and IRAS 083396517 found by Cannon et al. (2004), in which the large-scale neutral gas kinematics are interpreted to be critical for radiative transport. Although we do not probe the same physical scales in this work, we can conclude from this large tidal feature that the neutral gas is strongly disturbed.
Even with these interesting H I kinematics and the obvious interacting nature of the system, which contributes to its luminous infrared nature, LARS 03 remains a relatively weak emitter of photons, that would be undetected in most high-redshift surveys. While the ever increasing emission to higher radii is tantalizing, more data is needed to draw firm conclusions.
5.4 LARS 04
LARS 04 has a strong single peaked H I profile with a width at 50% of 150 km s-1 (see Figure 4). We classify it as an unconfused source; although SDSS J130757.13+542310.6 (Vopt = 9714 km s-1) is located 5.56′ to the southwest, it is not detected in our VLA imaging (see below). LARS04 has an irregular morphology in the UV and is a net Lya absorber, just showing a weak asymmetric emission on top of a large, damped absorption profile within the HST COS aperture (2.5″ in diameter). Paper II has shown that weak diffuse emission is present, but scattered to very large galactocentric radii.
We recover a total single-dish H I flux of 1.6 Jy km s-1 which yields an H I mass of 7.3 M⊙ at the adopted distance of 140 Mpc. The VLA H I imaging (see Figure 9) reveals extended emission with a median H I column density of 4.1 cm-2 [maximum angular extent roughly twice that of the 71″ (47.5 kpc) beam]; interestingly, this extended H I component is in the same directional sense as the optical morphology. Higher spatial resolution observations of LARS 04 with the VLA are both technically feasible (sufficient source brightness) and will be very useful in assessing the localized morphology and kinematics.
There is coherent rotation of the source apparent at this low spatial resolution. Specifically, the isovelocity contours are mostly parallel over 100 km s-1 (see Figure 9). Using the same approach as for LARS 02 above, this implies a dynamical mass of Mdyn 1.4 1010 M⊙ (again, with no inclination correction and with the assumption of the H I rotating over one beam diameter). However, based on the highly irregular optical morphology (which Figure 1 shows to be suggestive of an interaction), it is likely that the localized neutral gas kinematics are more complicated than simple disk rotation; the coarse beam size is likely smoothing out the kinematic details of this system.
5.5 LARS 05
LARS 05 is an edge-on galaxy (see Figure 1), with net absorption at very small radii and emission at larger radii, and at the physical scales relevant in this work [see discussion in Paper II]. The GBT H I profile (see Figure 4) shows a very weak signal that is near the noise level. While the SNR is low, the peaks in the spectrum may represent the top of the horns of a typical double-horn profile that is expected for a highly inclined disk galaxy. We derive an H I flux integral of 0.55 Jy km s-1, which, at a distance of 140 Mpc, corresponds to an H I mass of 2.4 M⊙. This galaxy has no known companions or contaminants in the GBT field of view.
5.6 LARS 06
LARS 06 is an irregular galaxy that has the weakest H and UV-based star formation rates in the entire LARS sample; it is a absorber on all physical scales. The optical morphology suggests an interaction scenario, with the southern tail being UV luminous but H dim compared to the main star forming knots in the northern portion of the system. Interestingly, this is the LARS system with the lowest measured nebular abundance [see discussion in Paper II].
The GBT H I profile of the LARS 06 field has the highest SNR of any of the LARS galaxies. This is almost certainly due to confusion within the beam. As Figure 5 shows, LARS 06 is separated from the disk galaxy UGC 10028 by only 1′ (43 kpc at the adopted distance of 148 Mpc). Although the redshift-derived velocity values differ for these two galaxies by 200 km s-1, the H I velocity of the total system is centered directly at the velocity of UGC 10028. This single-dish H I spectrum is a classical double horn profile indicative of the rotation of a massive and inclined H I disk; the width of the profile is 370 km s-1 at 50% of the maximum. The H I flux of 4.4 Jy km s-1 yields a total H I mass of 2.3 M⊙; this can be compared with the estimate of the stellar mass of LARS 06, 2.1 109 M⊙, from Paper II. While gas to stellar mass ratios of this size are not unreasonable, a comparison of the optical morphologies of UGC 10028 and LARS 06 strongly suggests that the former system is contributing significantly to the flux in this field. From the SDSS g-band luminosity, we estimate the H I mass of UGC 10028 as 4.1109 M⊙. This represents roughly 20% of the total mass seen in the system, but we caution that this might be an over or under estimation if the galaxy does not follow the same relation as other galaxies.
There are three other galaxies in the vicinity of LARS 06 that could also be contributing to the observed flux integral. As discussed in the caption of Figure 5, LARS 06 and UGC 10028 are also in close angular proximity to 2MASX J15455278+4415470, 2MASX J15455157+4415310, and SDSS J154549.41+441539.2. Based on the optical velocity, 2MASX J15455278+4415470 appears to be roughly 1000 km s-1 in the background of LARS 06 and UGC 10028. Only photometric redshifts are available for 2MASX J15455157+4415310 and SDSS J154549.41+441539.2, and each appears to also be at larger distances than LARS 06 and UGC 10028; emission line spectroscopy will be required to determine the absolute velocities of these systems.
Wide-bandwidth VLA observations of this complex field will be able to localize the neutral gas components of each system; this is an ideal target for subsequent high spatial resolution observations. LARS 06 is also the only detected galaxy that lies significantly off of our observed gas fraction-stellar mass relationship (see discussion in § 6 below), most likely due to this contamination.
5.7 LARS 07
LARS 07 is a near edge-on disk system that shows one of the highest equivalent widths of the LARS sample. The GBT spectrum shown in Figure 4 is measured as a single peak profile with a linewidth of 92 km s-1 at 50% of maximum; a second peak is separated from this main component by 120 km s-1. Due to the low SNR of this putative second peak, we measure the H I properties of the source using only the higher SNR component. With this assumption, LARS 07 has the narrowest linewidth of any galaxy in our sample. The H I flux is 0.47 Jy km s-1, corresponding to an H I mass of 2.9 M⊙ at the adopted distance of 161 Mpc.
5.8 LARS 08
LARS 08 is a metal-rich, low-inclination system (see Figure 2 and discussion in Paper II). The distribution of UV, , and H emission is strongly asymmetric in the galaxy, being much more prominent on the western side of the disk than on the eastern side. The system is a emitter on all spatial scales.
The GBT spectrum of LARS 08 (see Figure 4) shows a broad, possibly double-peaked profile with a linewidth of 310 km s-1 at 50% of the peak. The single-dish H I integrated flux is 3.4 Jy km s-1, yielding a total H I mass of 2.2 M⊙ at the adopted distance of 160 Mpc. The galaxy appears to be isolated, with no known neighbors in the GBT beam with similar velocities. The median column density of H I is 2.5 cm-2.
As Figure 10 shows, the detected H I emission is highly localized to the 72″ (56.9 kpc) beam. The source appears to be undergoing bulk rotation; while the velocity field is formally unresolved, the nearly parallel isovelocity contours span 80 km s-1 (note that the first moment map represents intensity-weighted velocity; for faint, unresolved sources one would expect a compressed velocity scale in the first moment compared to a spectrum). Taken as projected rotation with no inclination correction (which is likely substantial, given the apparent optical inclination), the implied dynamical mass is 1.1 1010 M⊙. Higher spatial resolution H I observations of LARS 08 would be very interesting to pursue, since this system appears to be undergoing normal rotation and lacks obvious signatures of large-scale kinematic disturbances in our H I maps, even though COS spectroscopy shows significant outflow activity (see details in Rivera-Thorsen et al., in preparation).
5.9 LARS 09
LARS 09 is an extended system with two prominent arms that are rich in H-emitting star formation regions (note that a careful inspection of Figure 2 shows that there is a prominent foreground star at the southern end of the disk). The optical morphology is consistent with the source being either a loose spiral or an interacting pair. The system is a global emitter at large scales (R 10 kpc); the morphology is similar to that of the optical/UV, although more extended in all directions from the disk.
The GBT spectrum (see Figure 4) is broad (linewidth of 270 km s-1 at 50% of the peak) and relatively low SNR. The total H I single-dish flux is 1.2 Jy km s-1, which gives a mass of 1.2 M⊙ at a distance of 200 Mpc. The profile is not contaminated by any other known sources within the GBT beam. The median H I column density is 1.2 cm-2
The VLA images presented in Figure 11 show that the source is essentially unresolved by the 59″ (57.2 kpc) beam. The H I maximum is co-spatial with the optical body; there is weak evidence for extended gas that is only slightly larger than the beam size (see, for example, the extended material to the east-southeast of the optical body in Figure 11). However, we do not interpret this as evidence of extended tidal structure due to the marginal extension compared to the beam size.
The intensity weighted velocity field of LARS 09 covers a large range (200 km s-1) and is severely disturbed. There are some isovelocity contours that are roughly parallel in the northwest region of the system; however, at the position of the optical body these contours deviate significantly from regularity. The kinematic information in these images suggests that the interaction scenario for the optical morphology may be appropriate. The presence of diffuse emission in this source, combined with the irregular kinematics and morphology, make this a prime target for higher resolution H I observations.
5.10 LARS 10
LARS 10 is an irregular source that shows high equivalent width emission arising from a diffuse component that extends beyond the optical body of the source [see discussion in Paper I]. The optical morphology is consistent with an advanced merger state. The GBT profile is broad (280 km s-1 at 50% of maximum), although of low SNR; the total flux integral of 0.29 Jy km s-1 corresponds to a total H I mass of 4.1 M⊙ at the adopted distance of 250 Mpc. The weak H I flux integral will make high resolution interferometric observations of LARS 10 challenging.
5.11 LARS 11
LARS 11 is a dramatic edge-on galaxy that is in close angular proximity to a field spiral galaxy (CGCG 046-044 NED01 at 14h03m47.0s, +06°28′26″). LARS 11 appears to be in the foreground of this object (LARS 11 is at zopt = 0.0843, while CGCG 046-044 NED01 has a photometric redshift derived from SDSS of 0.1); this is apparent by the disk of LARS 11 visually obstructing one of the spiral arms of CGCG 046-044 NED01. Figure 6 shows that LARS 11 is separated from two other field galaxies with similar velocities by less than the GBT beam: SDSS J140401.00+062901.7 at 14h04m01.0s 06°29′02″, and SDSS J140353.36+062504.8 at 14h03m53.3s +06°25′05″. Given this complex field, we classify the GBT profile of LARS 11 as potentially confused. Further, RFI was present near the expected frequency of the H I spectral line from LARS 11; this required extensive flagging.
The H I profile of LARS 11 shown in Figure 4 is broad (W50 = 260 km s-1) and is distributed in multiple peaks. This may represent a broad rotation profile from LARS 11, or it may be indicative of multiple sources contributing to the H I flux within the beam. Assuming that the full H I flux integral of 0.75 Jy km s-1 is only associated with LARS 11, the implied neutral hydrogen mass is 2.3 1010 M⊙ at the adopted distance of 360 Mpc. VLA imaging of LARS 11 would be very useful for localizing the H I emission from the various sources in this complex field.
6 Global Characteristics of the LARS Galaxies
Due to resonant scattering with neutral hydrogen atoms, the radiative transport of photons may well have its strongest dependence on the characteristics of the H I that surrounds the star forming regions in which the photons are produced. With the present H I spectroscopy and imaging, we now have a first order understanding of the neutral gas contents of many of the LARS galaxies. Comparing the qualities of the global H I reservoirs with the detailed characteristics of each system derived from HST imaging allows us to probe what roles H I kinematics and density play in governing radiative transport.
We focus on four global properties derived from the present H I observations of the 11 lowest-redshift LARS galaxies (those for which the GBT spectra provide meaningful measurements or limits); for the galaxies where it is available (LARS 02,03,04,08,09) we use the total fluxes and masses VLA images preferentially over the GBT data. In general the VLA data recovers 30% less flux than the GBT data, which contributes to 6% shorter linewidths. As mentioned in section 4, this is most likely due to a combination of decreased surface brightness sensitivity in the VLA data and decreased contamination from other sources.
First, the H I linewidth (specifically, the width at 50% of the maximum W50) is a distance-independent variable that has been shown to correlate with absolute magnitude and thus to serve as a proxy for mass in star-forming disk galaxies (Tully & Fisher, 1977). For rotationally dominated galaxies, a larger H I linewidth can often be interpreted as an indicator of a more massive galaxy. To know with certainty, a detailed study of the dynamics and complete censuses of the baryonic components of individual galaxies is needed. In our case, the galaxies with irregular morphology may have linewidths that are significantly increased due to kinematic disturbances and merging activity.
The second global parameter we examine is the total H I mass of each LARS galaxy. This parameter is of course related to the H I linewidth, but not in a one to one sense. The LARS galaxies span a range of morphological types, including violent interactions (e.g., LARS 03), disk-dominated spirals (e.g., LARS 05 and LARS 11), and irregulars (e.g., LARS 04, LARS 06). While for disk dominated systems the H I linewidth and H I mass should be closely correlated, for the other types of systems the H I line profile may not only be indicative of rotation; H I gas from multiple components may create irregular single-dish profiles. Examples of this are clearly seen in the GBT spectra (Figure 4) and in the VLA images (see, e.g., Figure 8).
Third, we examine the offset in velocity between the centroid of the H I profile and the known systemic velocity of each LARS galaxy as derived from optical spectroscopy. Assuming that such offsets are caused by large-scale kinematic deviations from regularly rotating galaxy disks (e.g., tidal interaction, gas outflow or infall), this offset parameter can be considered a rough proxy for the presence or absence of large-scale motions of neutral gas. As discussed in Cannon et al. (2004) and above for LARS 03, we find evidence for extended tidal structure in some -emitting galaxies. However, we also find systems that are strong emitters that do not show such extended neutral gas components (e.g., LARS 02; see § 5.2 above).
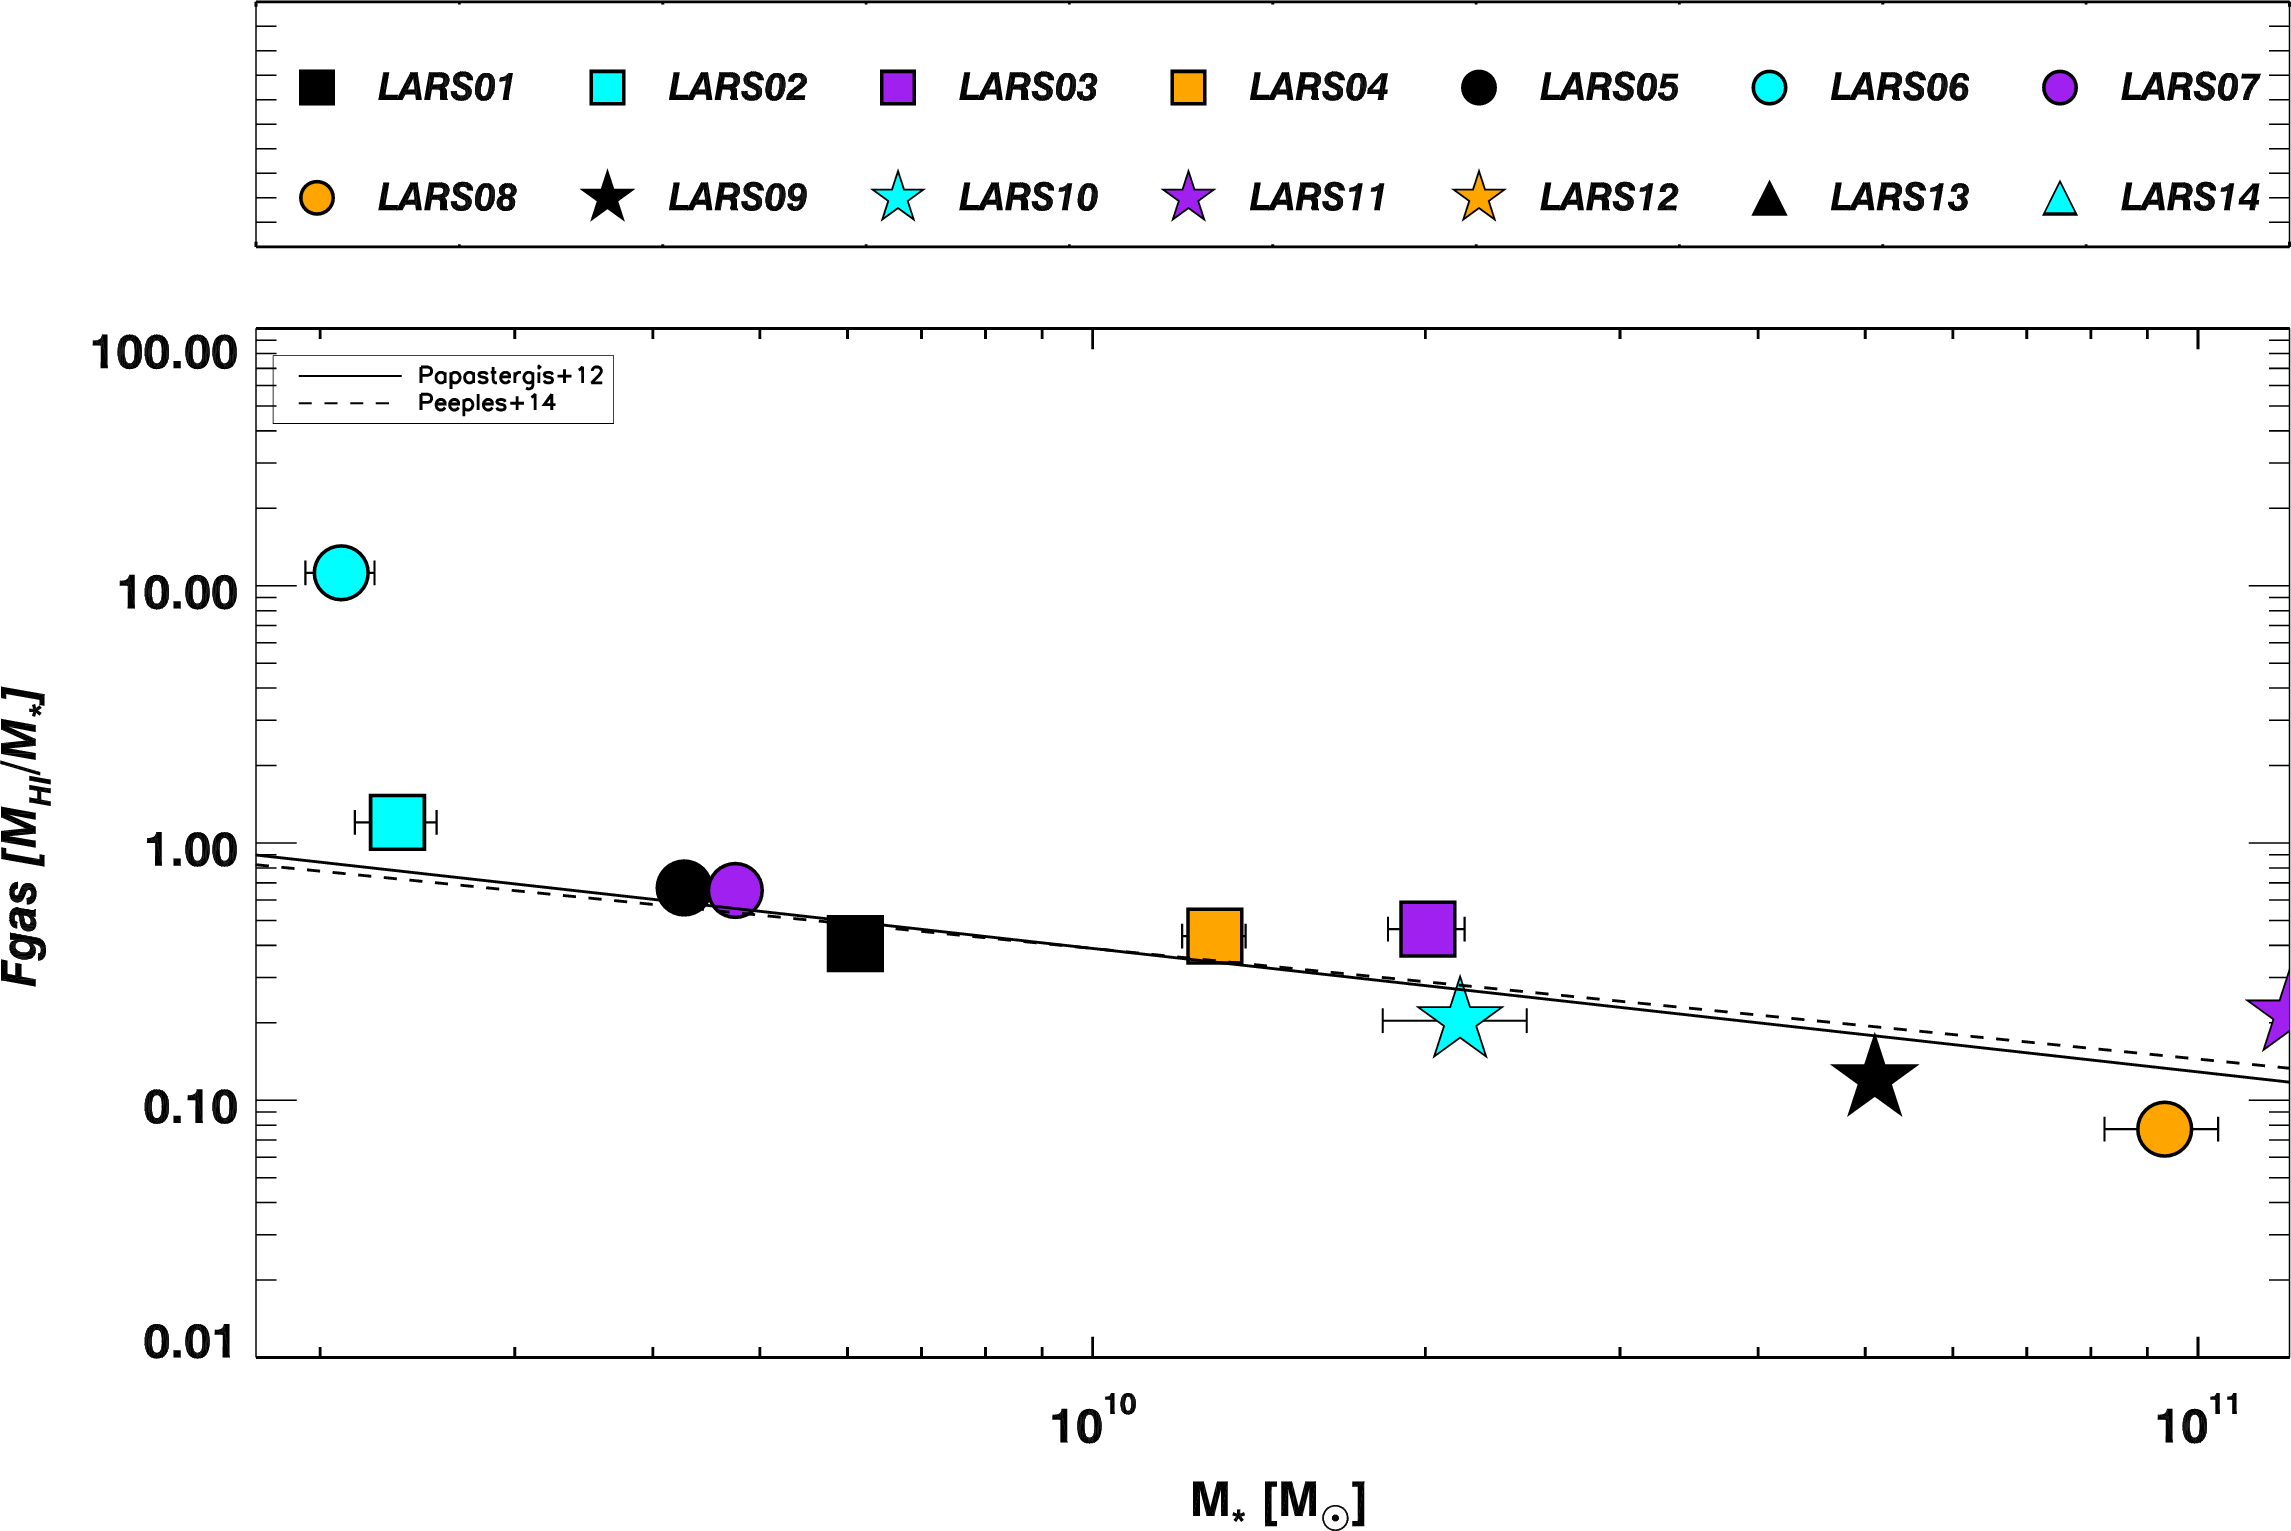
Finally, we examine the gas mass fraction defined as the H I mass divided by the stellar mass. Numerous works have shown that normal, star-forming disk galaxies populate a robust trend of decreasing gas fraction with increasing stellar mass (see recent results in Huang et al. 2012, Papastergis et al. 2012, Peeples et al. 2014, and various references therein). In Figure 12 we show the gas fraction as a function of total stellar mass (M∗) derived from 2-component SED modeling to the HST data (see Paper II and Hayes et al. 2009 for details). Except for LARS 06, whose H I flux integral is likely strongly contaminated by the nearby field spiral UGC 10028 (see discussion in § 5.6 and Figure 5), the LARS galaxies closely follow the derived relations for nearby galaxies as found in Papastergis et al. (2012) and Peeples et al. (2014).
It is important to remain cognizant of the possible confusion within the GBT beam for some of the sources without VLA data. In particular, the H I properties of LARS 06 are almost certainly contaminated by UGC 10028, and those of LARS 11 may be contaminated by SDSS J140401.00+062901.7 and/or SDSS J140353.36+062504.8. If these sources are in fact contaminated, then the H I linewidths and masses will be overestimated; the velocity offsets may or may not change.
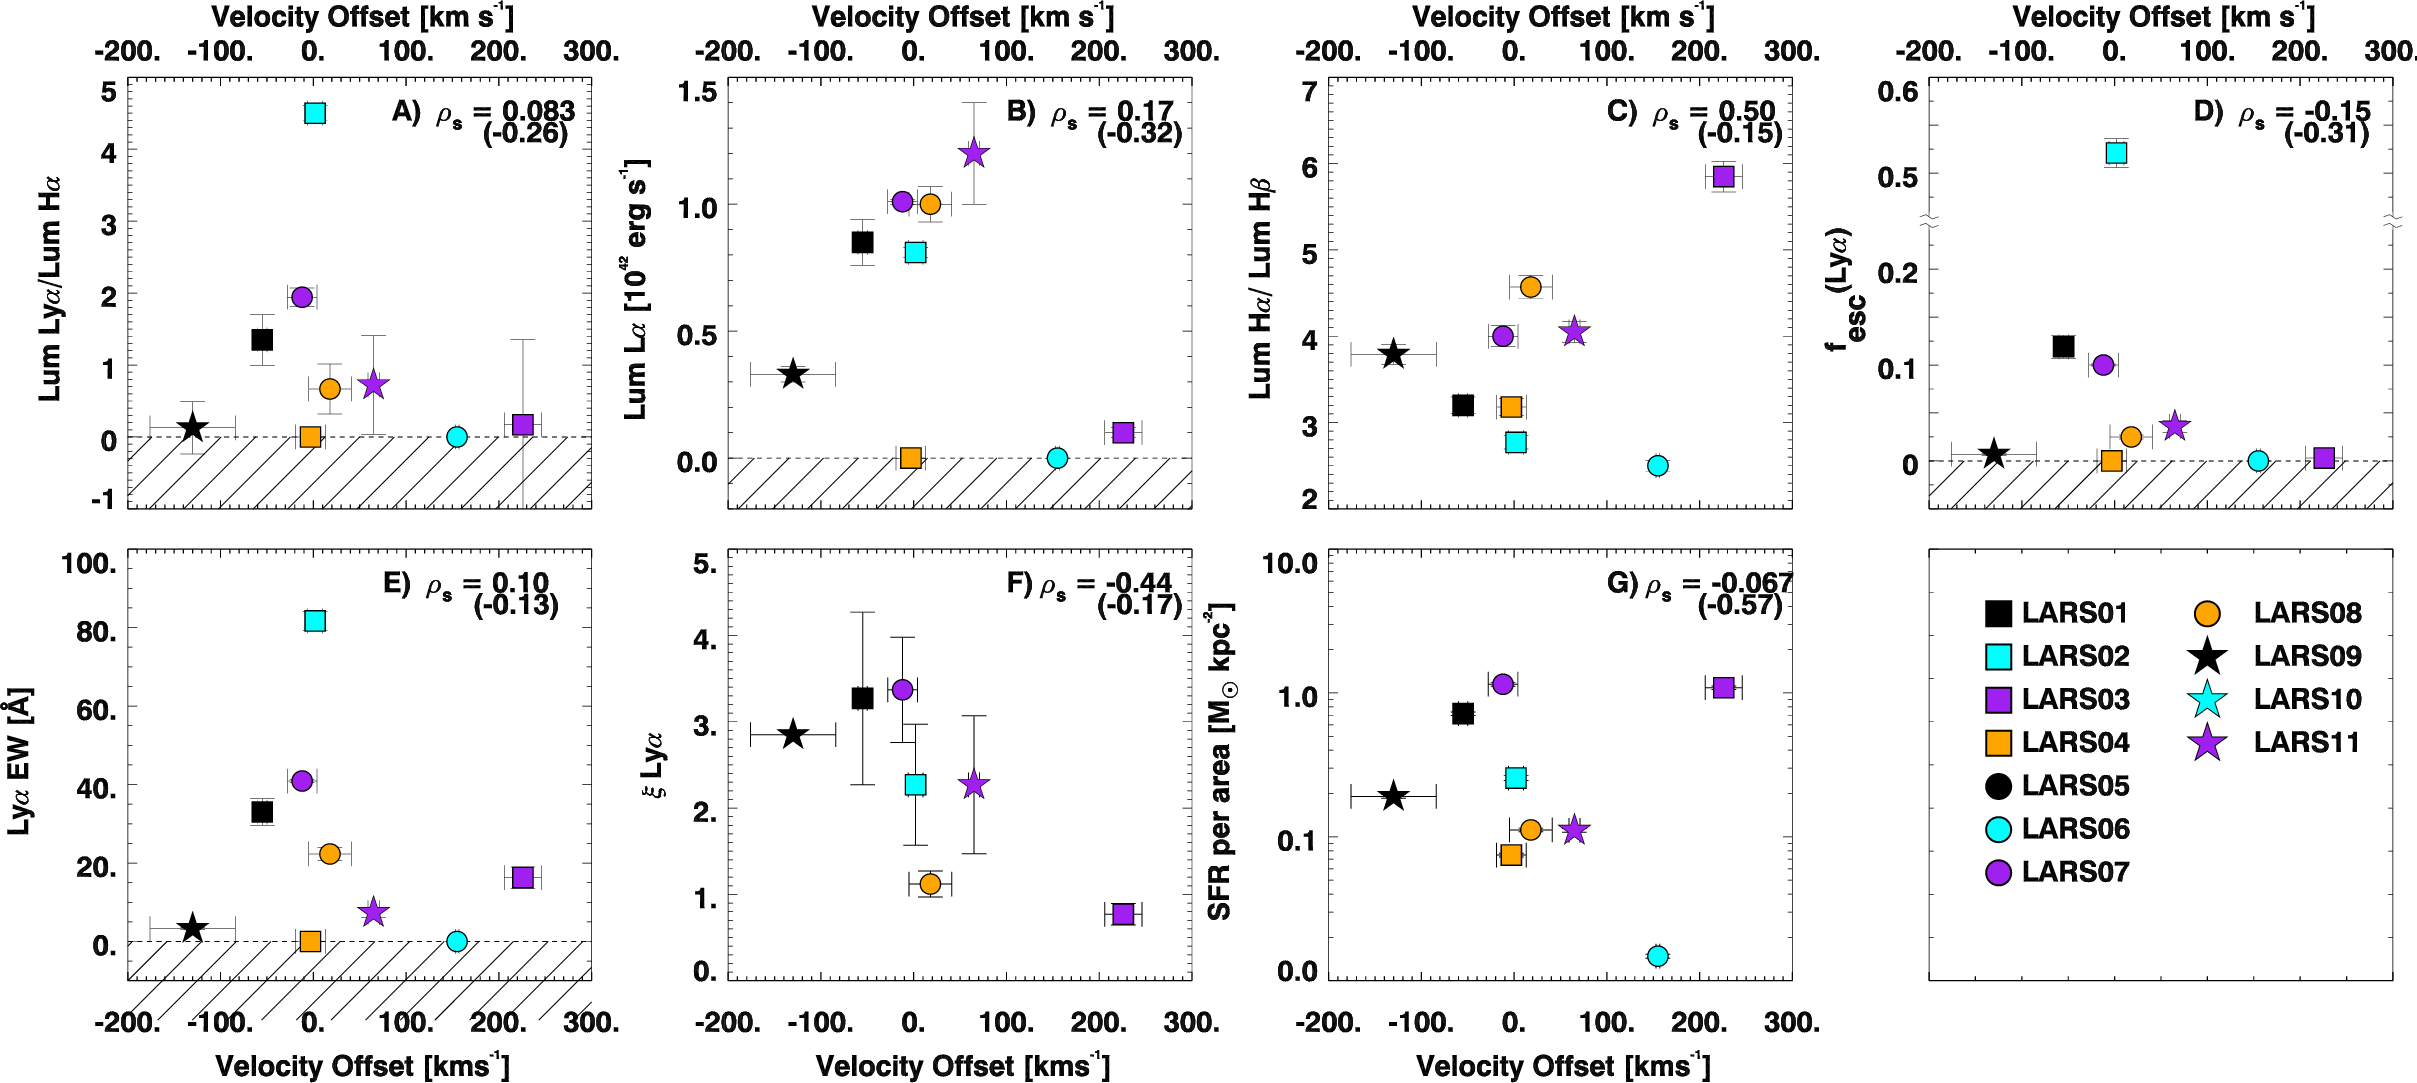
We examine the relationships of these four H I-based quantities with seven global properties derived from HST data in Paper II: the /H flux ratio, the luminosity, the H/H flux ratio, the escape fraction, the equivalent width, the extension parameter ( ), and the SFR per unit area within the Petrosian radius ( = 0.2; see Paper II). As discussed in detail in Hayes et al. (2014), there is a complex interrelation between these (and other) properties in the process of radiative transport; the total luminosity of a given galaxy does not correlate in a statistically significant way with any individual quantity. Further, there is significant variation in these values as a function of position within an individual galaxy; some galaxies appear as net absorbers within the disk and as net emitters when the diffuse halo is included. Nevertheless, we seek statistical comparisons with many of the global quantities of both and H I. These comparisons most closely match detections of higher-redshift emitters and will constrain one of the many poorly understood aspects of propagation and detection in the distant universe.
From a simplified interpretative standpoint, these seven global quantities can be related as follows. The H/H ratio indicates extinction; deviations above the intrinsic ratio of 2.86 (Osterbrock, 1989) indicate non-zero E(BV) values. These E(BV) values can in turn be used to derive the intrinsic luminosity of a system based on its observed (and extinction corrected) H luminosity and also to estimate the escape fraction. The /H ratio has a (Case B) recombination value of 8.7. Lower values can indicate stronger suppression of versus H (e.g., by attenuation from dust, or by resonant scattering away from the production site); super-recombination values are seen in a few localized regions of the LARS galaxies, as well as in some of the large scattered halos surrounding some of the systems (see Paper I and Paper II). The equivalent width is related to the recent star formation history of the galaxy or region; global values of 100 Å indicate constant star formation over 100 Myr timescales, while values exceeding 250 Å occur only in the very youngest burst episodes (Schaerer et al. 2003 and Raiter et al. 2010.)
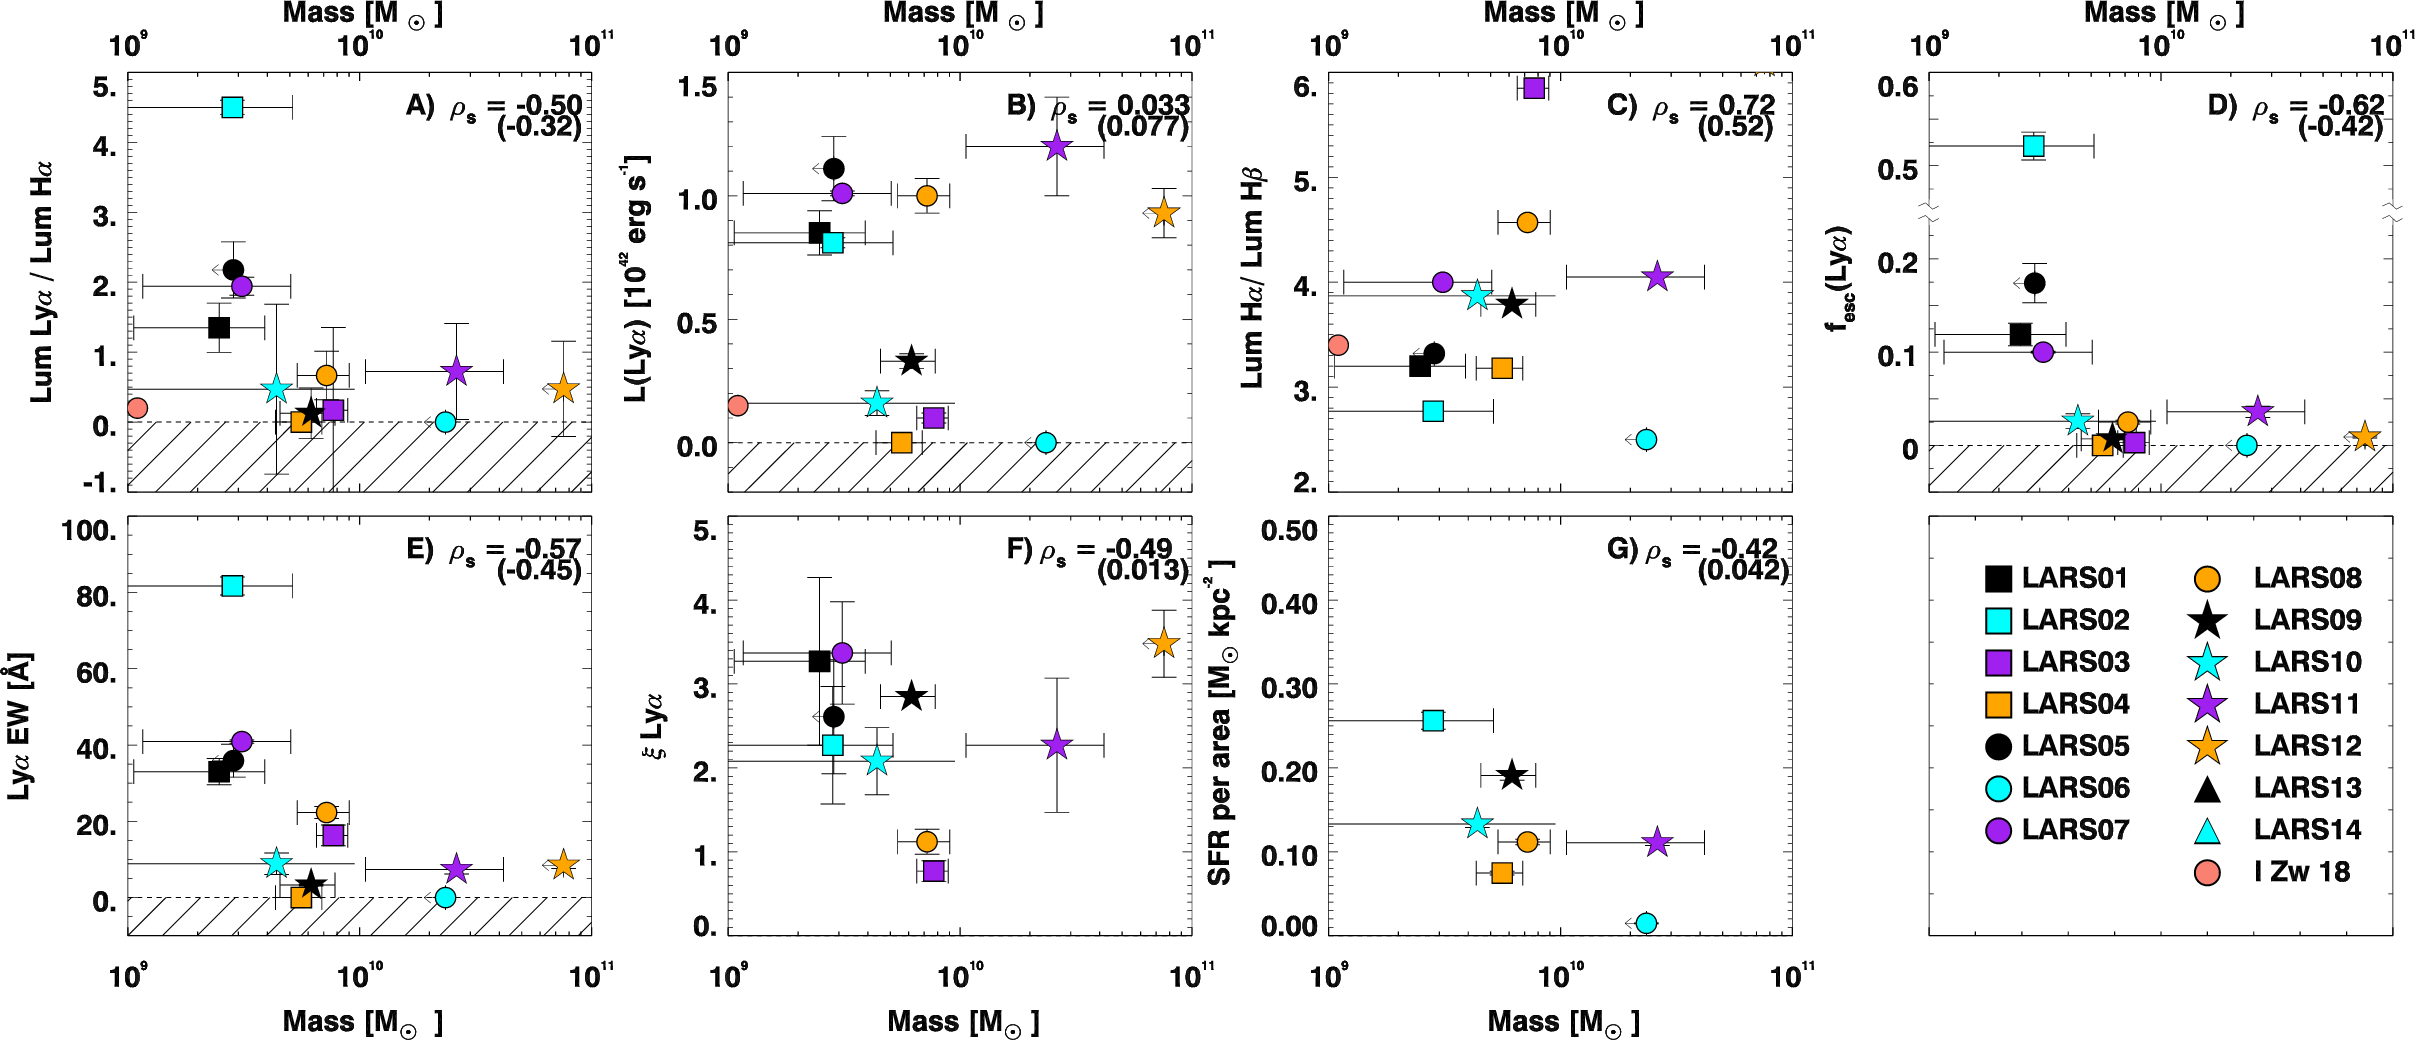
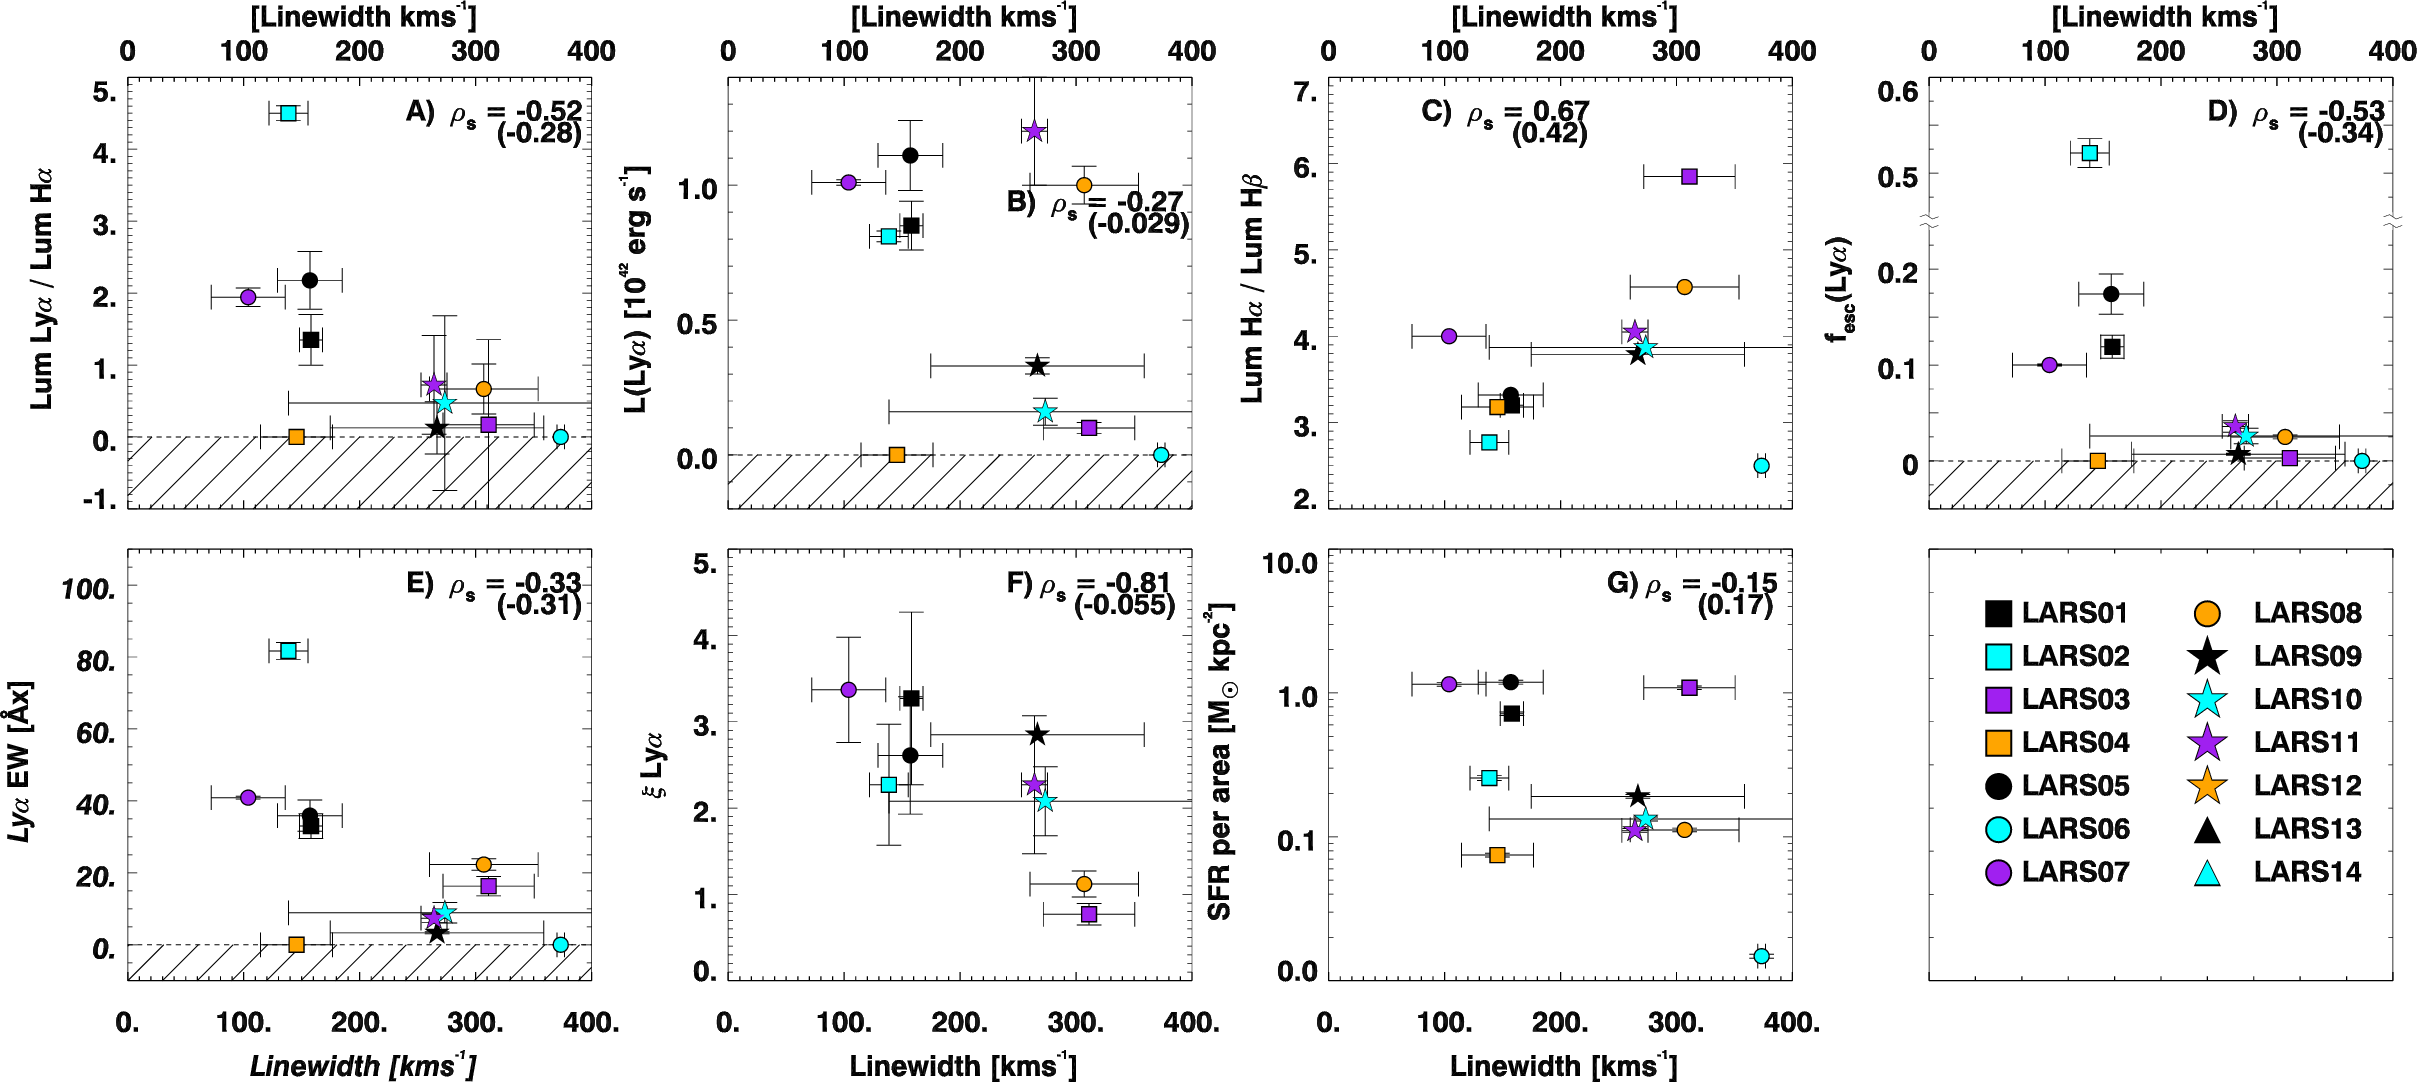
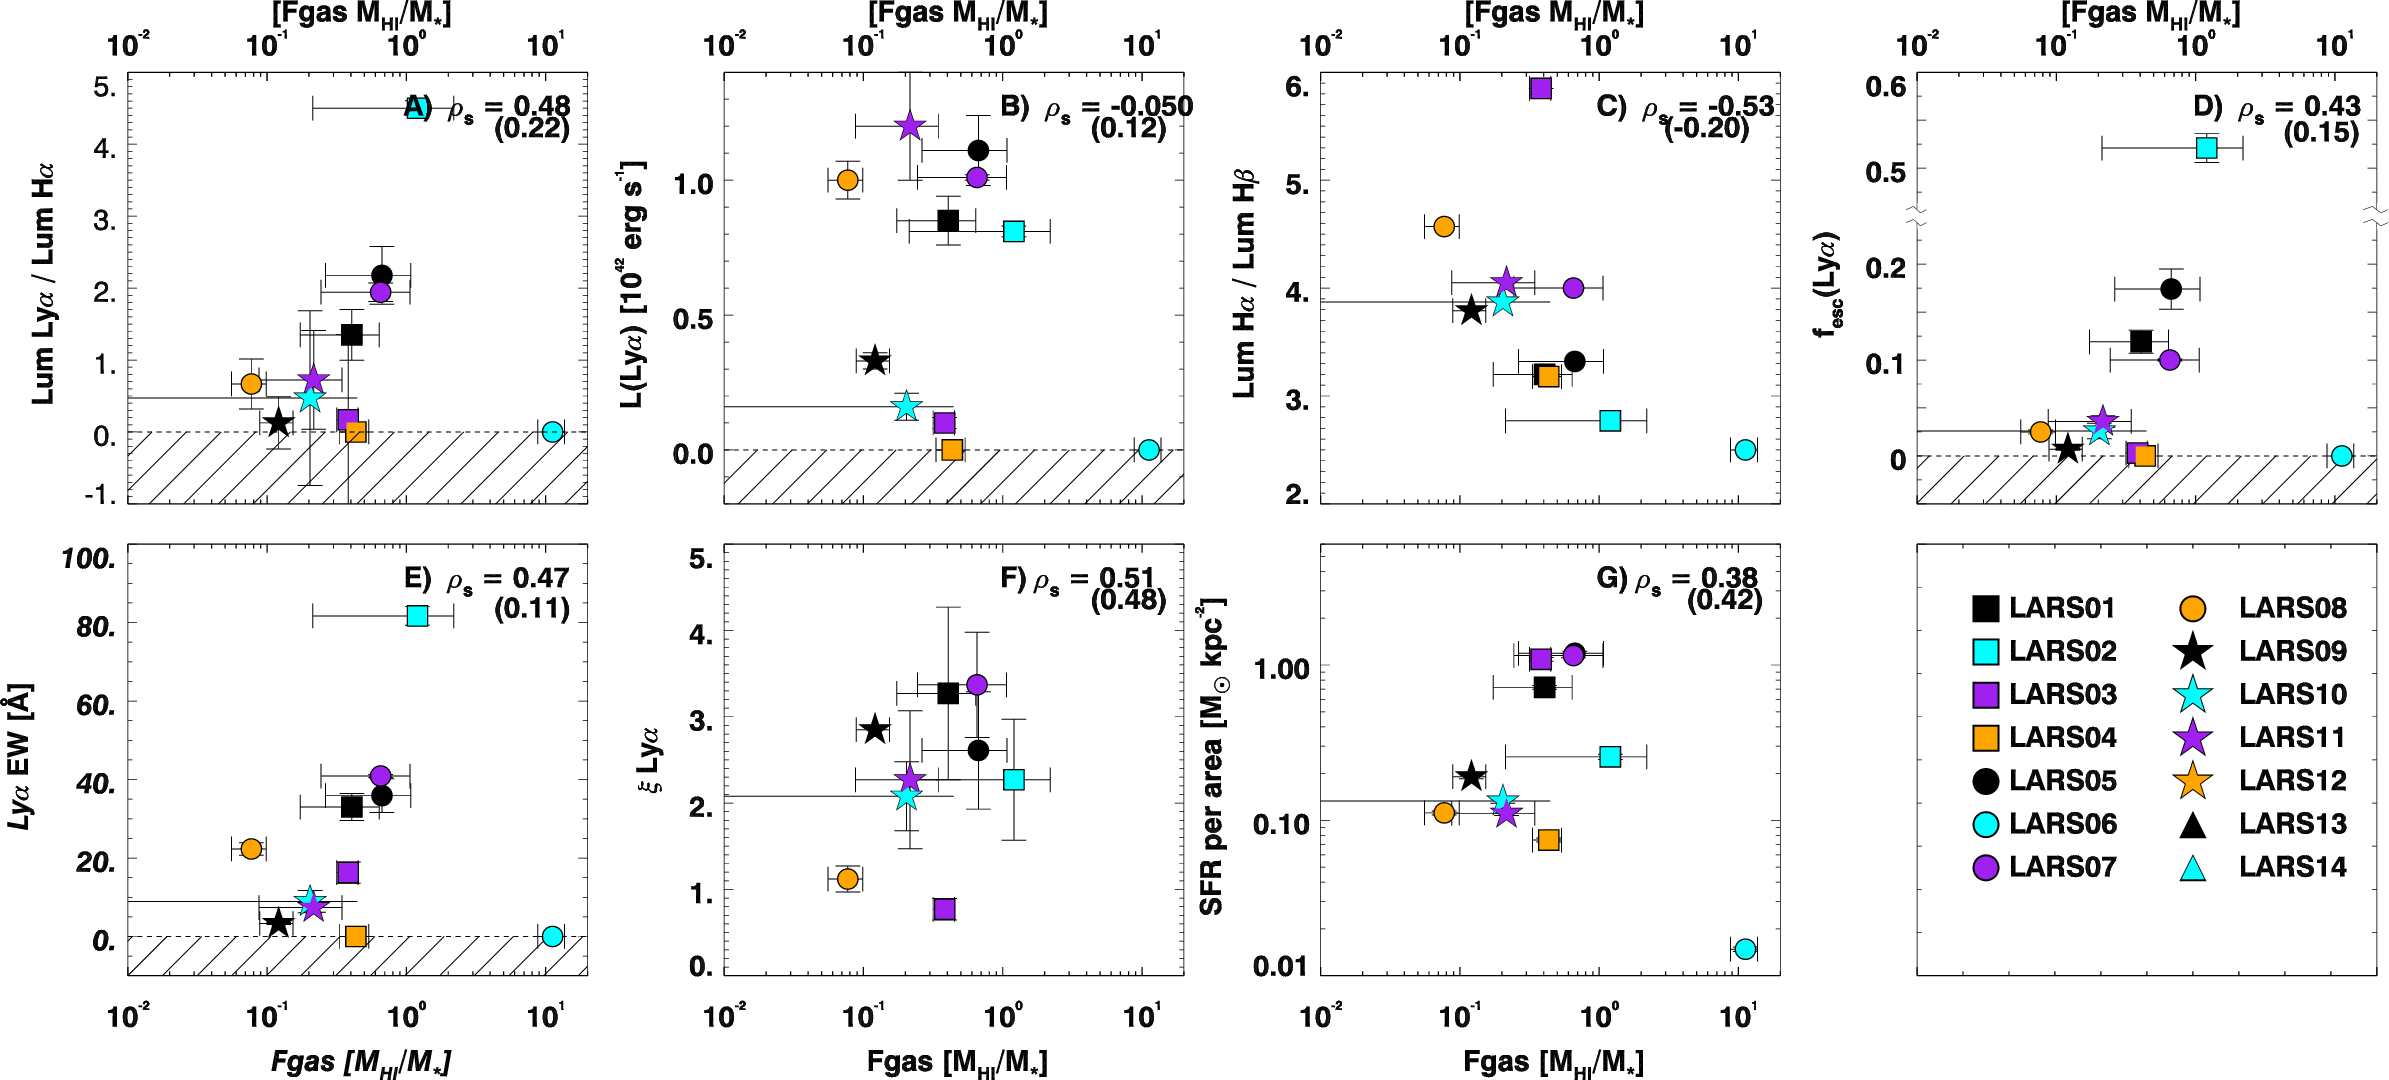
We present scatter plot comparisons of the four global H I-derived properties and seven global HST-derived properties in Figures 13, 14, 16, and 15. We restrict the properties to positive values, which has the effect of setting EW and luminosity measurements equal to zero. We mark this region on the plots with a hashed region. We use the Spearman correlation coefficient to quantify possible monotonic correlations between these properties; a perfect correlation or anti-correlation between two properties will have values of 1 or 1, respectively. Each panel of Figures 13 through 16 shows the corresponding value. To estimate the errors on these correlation coefficients we resample the properties 1000 times with a random realization of the associated errors and measure, recording the correlation coefficients each time. For each correlation we show the value from the sample of uncontaminated detections as the primary result, and include the value for the entire sample including upper limits and confused detections below.
Overall the results do not show strong evidence of correlation between properties ( 0.6 or 0.6). We present all correlations in Table 6, along with the dispersion and discuss the correlations for each H I property below.
6.1 Linewidth
The H I line width is significantly anti-correlated with the extension parameter, (see figure 14). This is the strongest evidence of correlation in the entire sample. The H I line width is positively correlated with the Hα/Hβ ratio (see further discussion below). Two factors are possibly at play here. Either larger H I quantities scatter photons to extended radii, or interactions increase both the linewidth and preferentially block photons at short radii.
6.2 Mass
Two anti-correlations, and a positive correlation appear comparing the H I mass of our sample of well detected galaxies (see Figure 13). The escape fraction ( = 0.63), and EW ( = 0.60) show tentative evidence for anti-correlation, which do not appear when including the marginal detections. Interestingly, the Hα/Hβ ratio shows strong evidence of correlation ( = 0.75). It has been known for some time that more massive star forming galaxies (hence those with larger H I masses and linewidths) are dustier, and that the Balmer decrement scales accordingly (e.g., Brinchmann et al., 2004; Lee et al., 2009; Garn & Best, 2010). How this correlation may be connected to the underling propagation is not entirely clear.
6.3 Gas Fraction
We see no conclusive evidence of correlations with any of the global properties using either the whole sample or the positive detections. The strongest correlation is with the H/H ratio ( = -0.53).
6.4 Velocity Offset
We find no significant correlation between the velocity offsets and the various properties. This might be due to our velocity smoothing and the large extent over which we are probing the velocity information. The strongest correlation is with with the H/H ratio ( = 0.50).
7 Discussion and Conclusions
We have presented new GBT spectroscopy and VLA H I spectral line imaging of the galaxies in the “Lyman Alpha Reference Sample” (“LARS”). LARS is a comprehensive, multi-wavelength study of 14 UV-selected star-forming galaxies that functions as a local benchmark for studies of emission and absorption at higher redshifts. The centerpiece is a suite of HST images that allows us to study emission and related quantities on a spatially resolved basis. The preliminary results presented in Hayes et al. (2013) showed that most of the LARS galaxies have large, diffuse halos of emission that exceed the sizes of the stellar populations; this is strong evidence for the importance of resonant scattering in the neutral hydrogen gas component. The HI structure and content are important pieces for understanding the origin of the Ly-alpha halos and their different sizes. Our current HI angular resolution probes the large-scale global properties rather than those in the immediate vicinity of the Ly-alpha halo regions imaged with HST. Nevertheless, these provide important insights into the galaxy structure and environment. The LARS survey products are described in Paper I of this series (Östlin et al., 2014); the integrated properties of the LARS galaxies as derived from the HST imaging are presented in Paper II of this series (Hayes et al., 2014).
In this manuscript we present a first exploration of the H I properties of the LARS galaxies. Using data from the GBT 100 m telescope, we have presented direct measurements of the neutral gas contents of 11 of the 14 galaxies; we place limits on the three most distant (z 0.1) LARS galaxies. These profiles show a wide variety of structure. Some systems harbor multi-component profiles that are indicative of interaction or the presence of nearby companions; others show more simple single H I peaks. Two sources (LARS 06 and LARS 11) are likely confused with nearby galaxies. We fit each of these profiles in order to derive global line properties, including systemic velocity, linewidths, H I flux integrals, and H I masses.
For a subset of five of the LARS galaxies, we also present new, low-resolution H I spectral line imaging obtained with the VLA. These H I images allow us to localize the H I associated with each galaxy. Three of the systems (LARS 02, LARS 08, and LARS 09) are unresolved at this angular resolution, while LARS 04 is resolved by a few beams. LARS 03 is highly resolved by the present data; we have discovered an enormous tidal structure that contains more than 109 M⊙ of H I, and that extends more than 160 kpc from the main interacting galaxies in the LARS 03 system. Based on the recovered flux integrals from these VLA data, each of the five systems presented here would be amenable to higher spatial resolution observations. The VLA C and B configurations would offer a factor of roughly 4 and 10 improvement in resolution respectively, but at the cost of longer integration times.
In particular LARS 03 presents an interesting case where we have unequivocal evidence of kinematic disturbances on large scales, yet no accompanying boost relative to non-disturbed galaxies in escape fraction. A high resolution follow up with the VLA and future radio telescopes, especially coupled with larger maps of the flux, would disentangle the local versus global kinematic effects, and probe the escape on physical scales larger than the 10 kpc already probed in the HST imaging.
Using these new GBT and VLA data, as well as the results derived from HST imaging and presented in Paper II, we compare various global H I and properties. While the sample is small, we find a few intriguing correlations in our robustly detected galaxies: The H I linewidths are strongly anti-correlated with ( = 0.81), while the total H I masses show anti-correlations with escape fraction and EW. Additionally, both the H I linewidths and the H I masses are each correlated with the Hα/Hβ ratio. These intriguing but tentative (anti-)correlations are in general agreement with a significant dependence of propagation on the total mass and thus the H I mass of the source, and is in general agreement with previous work by Laursen et al. (2009) which found that the escape fraction decreases with increasing virial mass. These results also support the general trend that properties appear to correlate with total galaxy mass, as found in Paper II. That work showed that emission (quantified by equivalent width, escape fraction, etc.) is systematically larger in lower mass galaxies. Given the variety of properties that scale roughly with mass (e.g., metallicity, dust content, star formation rate, UV colors, etc.), a larger statistical sample of galaxies will be needed in order to better quantify these trends.
The famous metal-poor blue compact dwarf galaxy I Zw18 reminds us that the trend of lower mass galaxies having larger luminosities or escape fractions is not always true. While the system has an extremely low nebular oxygen abundance (Skillman & Kennicutt, 1993), an appreciable star formation rate (Cannon et al., 2002), and a substantial UV luminosity (Grimes et al., 2009), Kunth et al. (1998) showed that I Zw 18 is in fact a absorber. This process was explained by numerous scattering events in the neutral, and, most importantly, static ISM even in the complete absence of dust (Atek et al., 2009). Future local studies should seek to expand the number of low-mass systems with analyses similar to the ones presented here for LARS.
Although it is tempting to view the increasing /H with decreasing mass as a result of less gas mass being available for scattering, this theory must be cast in the light of results that suggest that gas fraction increases with increasing redshift (e.g., Tacconi et al., 2013), and that lower mass galaxies tend to be more gas-rich (Saintonge et al., 2011) and less dusty (e.g., Blanc et al., 2011). In Figure 12 we see that the LARS galaxies fit the general trend with gas mass fraction.
While halos seem to appear in systems with a range of H I linewidths, large /Hα values only appear in galaxies with H I smaller linewidths. Large halos are also correlated with less massive galaxies, and with increasing velocity offsets. We interpret this to mean that low H I linewidths are necessary but not sufficient for escape, while larger line widths contribute to the overall effects of destruction by dust, extinction, and scattering.
The bulk of the evidence presented by previous work shows the importance of H I properties, especially kinematic details, in determining the escape of photons (e.g. Mas-Hesse et al. 2003). This process is mostly governed by local effects, and it is unclear at this time what global H I properties are required for the escape and propagation of photons. The asymmetric GBT profiles and evidence of emission in the presence of large column densities of H I both point to interesting sub-resolution kinematic and density effects.
A larger sample of galaxies with data like those presented here will allow us to place these correlations on a more statistically robust footing. The HST eLARS program has been approved for 54 orbits and contains 28 more galaxies within our nominal sensitivity range of z 0.08. In addition, higher resolution follow up observations will allow us to determine kinematic details on more applicable scales for a number of our galaxies. This program will likely be the largest statistical sample of both H I and detected galaxies until new advances of radio telescopes, such as the Square Kilometer Array777https://www.skatelescope.org, push H I detections to 20-100 kpc scales at z .
References
- Atek et al. (2008) Atek, H., Kunth, D., Hayes, M., Östlin, G., & Mas-Hesse, J. M. 2008, A&A, 488, 491
- Atek et al. (2009) Atek, H., Kunth, D., Schaerer, D., et al. 2009, A&A, 506, L1
- Atek et al. (2014) Atek, H., Kunth, D., Schaerer, D., et al. 2014, A&A, 561, A89
- Bergvall & Jorsater (1988) Bergvall, N., & Jorsater, S. 1988, Nature, 331, 589
- Blanc et al. (2011) Blanc, G. A., Adams, J. J., Gebhardt, K., et al. 2011, ApJ, 736, 31
- Brinchmann et al. (2004) Brinchmann, J., Charlot, S., White, S. D. M., et al. 2004, MNRAS, 351, 1151
- Cannon et al. (2002) Cannon, J. M., Skillman, E. D., Garnett, D. R., & Dufour, R. J. 2002, ApJ, 565, 931
- Cannon et al. (2004) Cannon, J. M., Skillman, E. D., Kunth, D., Leitherer, C., Mas-Hesse, M., Östlin, G., & Petrosian, A. 2004, ApJ, 608, 768
- Charlot & Fall (1993) Charlot, S., & Fall, S. M. 1993, ApJ, 415, 580
- Duval et al. (2014) Duval, F., Schaerer, D., Östlin, G., & Laursen, P. 2014, A&A, 562, A52
- Finkelstein et al. (2008) Finkelstein, S. L., Rhoads, J. E., Malhotra, S., Grogin, N., & Wang, J. 2008, ApJ, 678, 655
- Garn & Best (2010) Garn, T., & Best, P. N. 2010, MNRAS, 409, 421
- Giavalisco et al. (1996) Giavalisco, M., Koratkar, A., & Calzetti, D. 1996, ApJ, 466, 831
- Grimes et al. (2009) Grimes, J. P., Heckman, T., Aloisi, A., et al. 2009, ApJS, 181, 272
- Hansen & Oh (2006) Hansen, M., & Oh, S. P. 2006, MNRAS, 367, 979
- Hartmann et al. (1988) Hartmann, L. W., Huchra, J. P., Geller, M. J., O’Brien, P., & Wilson, R. 1988, ApJ, 326, 101
- Hayes et al. (2005) Hayes, M., Östlin, G., Mas-Hesse, J. M., et al. 2005, A&A, 438, 71
- Hayes et al. (2009) Hayes, M., Östlin, G., Mas-Hesse, J. M., & Kunth, D. 2009, AJ, 138, 911
- Hayes et al. (2010) Hayes, M., Östlin, G., Schaerer, D., et al. 2010, Nature, 464, 562
- Hayes et al. (2013) Hayes, M., Östlin, G., Schaerer, D., et al. 2013, ApJ, 765, L27
- Hayes et al. (2014) Hayes, M., Östlin, G., Duval, F., et al. 2014, ApJ, 782, 6
- Haynes & Giovanelli (1984) Haynes, M. P., & Giovanelli, R. 1984, AJ, 89, 758
- Huang et al. (2012) Huang, S., Haynes, M. P., Giovanelli, R., et al. 2012, AJ, 143, 133
- Jester et al. (2005) Jester, S., et al. 2005, AJ, 130, 873
- Komatsu et al. (2011) Komatsu, E., et al. 2011, ApJS, 192, 18
- Kunth et al. (1998) Kunth, D., Mas-Hesse, J. M., Terlevich, E., et al. 1998, A&A, 334, 11
- Laursen et al. (2009) Laursen, P., Sommer-Larsen, J., & Andersen, A. C. 2009, ApJ, 704, 1640
- Laursen et al. (2013) Laursen, P., Duval, F., Östlin, G. 2013, ApJ, 766, 124
- Lee et al. (2009) Lee, J. C., Gil de Paz, A., Tremonti, C., et al. 2009, ApJ, 706, 599
- Mas-Hesse et al. (2003) Mas-Hesse, J. M., Kunth, D., Tenorio-Tagle, G., et al. 2003, ApJ, 598, 858
- Neufeld (1991) Neufeld, D. A. 1991, ApJ, 370, L85
- Osterbrock (1989) Osterbrock, D. E. 1989, Research supported by the University of California, John Simon Guggenheim Memorial Foundation, University of Minnesota, et al. Mill Valley, CA, University Science Books, 1989, 422 p.,
- Östlin et al. (2009) Östlin, G., Hayes, M., Kunth, D., et al. 2009, AJ, 138, 923
- Östlin et al. (2014) Östlin, G.,Hayes, M., et al. 2014, ApJ, in preparation
- Otí-Floranes et al. (2012) Otí-Floranes, H., Mas-Hesse, J. M., Jiménez-Bailón, E., et al. 2012, A&A, 546, A65
- Papastergis et al. (2012) Papastergis, E., Cattaneo, A., Huang, S., Giovanelli, R., & Haynes, M. P. 2012, ApJ, 759, 138
- Peeples et al. (2014) Peeples, M. S., Werk, J. K., Tumlinson, J., et al. 2014, ApJ, 786, 54
- Petrosian (1976) Petrosian, V. 1976, ApJ, 209, L1
- Raiter et al. (2010) Raiter, A., Schaerer, D., & Fosbury, R. A. E. 2010, A&A, 523, A64
- Saintonge et al. (2011) Saintonge, A., Kauffmann, G., Kramer, C., et al. 2011, MNRAS, 415, 32
- Scarlata et al. (2009) Scarlata, C., Colbert, J., Teplitz, H. I., et al. 2009, ApJ, 704, L98
- Schaerer (2003) Schaerer, D. 2003, A&A, 397, 527
- Schlafly & Finkbeiner (2011) Schlafly, E. F., & Finkbeiner, D. P. 2011, ApJ, 737, 103
- Schneider et al. (1990) Schneider, S. E., Thuan, T. X., Magri, C., & Wadiak, J. E. 1990, ApJS, 72, 245
- Skillman & Kennicutt (1993) Skillman, E. D., & Kennicutt, R. C., Jr. 1993, ApJ, 411, 655
- Springob et al. (2005) Springob, C. M., Haynes, M. P., Giovanelli, R., & Kent, B. R. 2005, ApJS, 160, 149
- Stark et al. (2010) Stark, D. P., Ellis, R. S., Chiu, K., Ouchi, M., & Bunker, A. 2010, MNRAS, 408, 1628
- Steidel et al. (2011) Steidel, C. C., Bogosavljević, M., Shapley, A. E., et al. 2011, ApJ, 736, 160
- Tacconi et al. (2013) Tacconi, L. J., Neri, R., Genzel, R., et al. 2013, ApJ, 768, 74
- Tully & Fisher (1977) Tully, R. B., & Fisher, J. R. 1977, A&A, 54, 661
- Verhamme et al. (2008) Verhamme, A., Schaerer, D., Atek, H., & Tapken, C. 2008, A&A, 491, 89
- Westmeier et al. (2014) Westmeier, T., Jurek, R., Obreschkow, D., Koribalski, B. S., & Staveley-Smith, L. 2014, MNRAS, 438, 1176
- Wofford et al. (2013) Wofford, A., Leitherer, C., & Salzer, J. 2013, ApJ, 765, 118
- Zheng et al. (2011) Zheng, Z., Cen, R., Weinberg, D., Trac, H., & Miralda-Escudé, J. 2011, ApJ, 739, 62
| Galaxy | Alternate | RA | Dec | VoptaaDerived from SDSS spectroscopy. | zoptaaDerived from SDSS spectroscopy. | DistancebbValues derived from luminosity distance. | Morphological TypeccMorphologies provided to guide the reader and are presented from optical imaging and Paper II. Irregulars have no obvious spiral structure in the optical disk and mergers have an obvious interacting companion. Galaxies marked as dwarves have stellar masses lower than 1010M⊙. |
|---|---|---|---|---|---|---|---|
| name | (J2000) | (J2000) | (km s-1) | (Mpc) | |||
| LARS 01 | Mrk 259 | 13:28:44.50 | +43:55:50 | 8394 | 0.028 | 120 | Dwarf Irregular |
| LARS 02 | SDSS J090704.88+532656.6 | 09:07:04.88 | +53:26:56 | 8934 | 0.030 | 130 | Dwarf Irregular |
| LARS 03 | Arp 238 | 13:15:35.60 | +62:07:28 | 9204 | 0.031 | 130 | Merger |
| LARS 04 | SDSS J130728.45+542652.3 | 13:07:28.45 | +54:26:52 | 9743 | 0.033 | 140 | Irregular |
| LARS 05 | Mrk 1486 | 13:59:50.91 | +57:26:22 | 10133 | 0.034 | 150 | Edge-on Dwarf Spiral |
| LARS 06 | KISSR 2019 | 15:45:44.52 | +44:15:51 | 10223 | 0.034 | 150 | Dwarf Irregular |
| LARS 07 | IRAS 1313+2938 | 13:16:03.91 | +29:22:54 | 11332 | 0.038 | 170 | Dwarf Edge-on Spiral |
| LARS 08 | SDSS J125013.50+073441.5 | 12:50:13.50 | +07:34:41 | 11452 | 0.038 | 170 | Spiral |
| LARS 09 | IRAS 0820+2816 | 08:23:54.96 | +28:06:21 | 14150 | 0.047 | 210 | Edge-on Spiral |
| LARS 10 | MRk 0061 | 13:01:41.52 | +29:22:52 | 17208 | 0.057 | 260 | Merger |
| LARS 11 | SDSS J140347.22+062812.1 | 14:03:47.22 | +06:28:12 | 25302 | 0.084 | 380 | Edge-on Spiral |
| LARS 12 | SBS 0934+547 | 09:38:13.49 | +54:28:25 | 30608 | 0.102 | 470 | Dwarf Irregular |
| LARS 13 | IRAS 0147+1254 | 01:50:28.39 | +13:08:58 | 43979 | 0.147 | 700 | Irregular |
| LARS 14 | SDSS J092600.40+442736.1 | 09:26:00.40 | +44:27:36 | 54172 | 0.181 | 880 | Dwarf |
| Galaxy | VsysaaValues from non-detections are from the SDSS optical redshifts. | W50b,cb,cfootnotemark: | W20bbThese values are derived from fits to the slopes on either side of the profile. See discussion in § 2. | Velocity Offset | S | MHI | SNR | RMS | BaselineeeOrder of polynomial that was fit to the GBT baseline. | TypeffThe classification of the profile: ’S’ for single-horned, ’D’ for double-horned, ’C’ for confusion caused by other galaxies, ’I’ for an irregular profile, ’N’ for no detection. |
|---|---|---|---|---|---|---|---|---|---|---|
| (km s-1) | (km s-1) | (km s-1) | (km s-1) | (Jy km s-1) | (109 M⊙) | (Sum, Peak) | (mJy) | Fit Order | ||
| (1) | (2) | (3) | (4) | (5) | (6) | (7) | (8) | (9) | (10) | (11) |
| LARS 01 | 8339 5 | 160 10 | 180 16 | 55 5 | 0.70 0.07 | 2.5 0.3 | (3.1, 6.5) | 1.1 | 2 | D |
| LARS 02 | 8940 8 | 140 17 | 150 26 | 3 8 | 0.70 0.07 | 2.8 0.3 | (2.2, 2.9) | 1.8 | 3 | D |
| LARS 03 | 9421 20 | 310 39 | 380 62 | 230 20 | 1.6 0.2 | 6.9 0.7 | (3.1, 4.9) | 1.2 | 3 | D |
| LARS 04 | 9740 16 | 150 31 | 260 49 | 3 16 | 1.6 0.2 | 7.7 0.8 | (5.1, 11.) | 1.0 | 3 | S |
| LARS 05 | 10117 14 | 160 28 | 170 44 | 10 14 | 0.55 | 2.9 | (1.3, 1.5) | 1.1 | 1 | I |
| LARS 06 | 10378 12 | 370 3 | 390 5 | 155 2 | 4.4 0.4 | 23. 2 | (9.5, 18.) | 1.1 | 3 | D |
| LARS 07 | 11315 16 | 100 32 | 170 50 | 10 16 | 0.47 0.05 | 3.1 0.3 | (3.3, 6.2) | 0.86 | 3 | S |
| LARS 08 | 11468 23 | 310 47 | 470 73 | 20 23 | 3.4 0.3 | 22. 2 | (5.7, 11.) | 0.91 | 3 | I |
| LARS 09 | 14020 46 | 270 92 | 490 140 | 130 46 | 1.2 0.1 | 13. 1 | (2.8, 7.3) | 0.73 | 3 | S |
| LARS 10 | 17284 69 | 280 140 | 380 220 | 70 69 | 0.29 0.03 | 4.5 0.5 | (1.1, 2.1) | 0.69 | 3 | C |
| LARS 11 | 25366 56 | 260 11 | 290 18 | 65 6 | 0.75 0.08 | 26. 3 | (2.9, 6.4) | 0.89 | 3 | D |
| LARS 12 | (30609) | (264) | (290) | N/A | 2.9 | 150 | N/A | 3.4 | 3 | N |
| LARS 13 | (43980) | (264) | (290) | N/A | 33 | 3800 | N/A | 38. | 5 | N |
| LARS 14 | (54172) | (264) | (290) | N/A | 1.7 | 310 | N/A | 2.0 | 1 | N |
| Galaxy | Observation | Primary | Phase | Flux | Integration |
|---|---|---|---|---|---|
| Date | Calibrator | Calibrator | DensityaaFlux density of phase calibrator derived during calibration. | Time | |
| (UT) | (Jy) | (min.) | |||
| (1) | (2) | (3) | (4) | (5) | (6) |
| LARS 02 | 2013 Apr 3-4 | 0542+498=3C147 | J0834+5534 | 8.28 0.014 | 225.9 |
| LARS 02 | 2013 Apr 5-6 | 0542+498=3C147 | J0834+5534 | 8.35 0.013 | 225.5 |
| LARS 03 | 2013 Apr 14 | 1331+305=3C286 | J1400+6210 | 4.42 0.017 | 200.4 |
| LARS 04 | 2013 Mar 30 | 1331+305=3C286 | J1252+5634 | 2.29 0.025 | 120.4 |
| LARS 08 | 2013 Apr 16 | 1331+305=3C286 | J1254+1141 | 0.858 0.0058 | 119.8 |
| LARS 09 | 2013 Mar 3-4 | 0542+498=3C147 | J0741+3112 | 2.02 0.0056 | 306.2 |
| LARS 09 | 2013 Mar 26-27 | 0542+498=3C147 | J0741+3112 | 2.09 0.050 | 281.1 |
| Galaxy | Vsys | W50aaThese values are derived from fits to the slopes on either side of the profile. See discussion in § 2. | W20aaThese values are derived from fits to the slopes on either side of the profile. See discussion in § 2. | Velocity Offset | SHI | MHI | RMS | N ccAssumed linewidths for non detections are the average linewidth of detected sources. |
|---|---|---|---|---|---|---|---|---|
| (km s-1) | (km s-1) | (km s-1) | (km s-1) | (Jy km s-1) | (109 M⊙) | (mJy/BeambbThe final circular beam sizes of the VLA data presented here are 59″, 62″, 71″, 72″, and 59″, for LARS 02, LARS 03, LARS 04, LARS 08, and LARS 09, respectively.) | (1019 cm-2) | |
| (1) | (2) | (3) | (4) | (5) | (6) | (7) | (8) | (9) |
| LARS 02 | 8960 2 | 140 4 | 150 6 | 26 6 | 0.36 0.036 | 1.4 0.15 | 0.50 | 2.6 |
| LARS 03 | 9520 10 | 170 20 | 300 32 | 316 32 | 2.2 0.22 | 7.8 0.94ddMass of main component of galaxy not including tidal tail. | 1.0 | 0.96 |
| LARS 04 | 9760 2 | 180 4 | 190 6 | 15 6 | 1.2 0.12 | 5.8 0.58 | 1.0 | 4.8 |
| LARS 08 | 11450 2 | 240 4 | 250 7 | -1 7 | 1.8 0.18 | 12. 1.2 | 1.0 | 2.6 |
| LARS 09 | 14070 9 | 310 18 | 330 28 | -79 28 | 0.60 0.060 | 6.2 0.62 | 0.50 | 1.2 |
| Galaxy | LLyα | LHα | f | SFR | Metallicity | WLyα | M∗ | |
|---|---|---|---|---|---|---|---|---|
| (1042 cgs.) | (1042 cgs.) | (M⊙yr-1) | (12+log(O/H)) | () | (109M⊙) | |||
| (1) | (2) | (3) | (4) | (5) | (6) | (7) | (8) | (9) |
| LARS 01 | 0.850.09 | 0.630.019 | 0.1190.012 | 3.140.09 | 8.260.04 | 33.03.44 | 6.100.25 | |
| LARS 02 | 0.810.02 | 0.180.005 | 0.5210.015 | 1.010.03 | 8.230.04 | 81.72.36 | 2.350.20 | |
| LARS 03 | 0.100.02 | 0.590.018 | 0.0030.000 | 2.410.07 | 8.380.20 | 16.32.71 | 20.11.6 | |
| LARS 04 | 0.00 | 0.600.018 | 0.000 | 3.370.10 | 8.200.04 | 0.00 | … | 12.90.85 |
| LARS 05 | 1.110.13 | 0.510.015 | 0.1740.021 | 3.230.10 | 8.130.04 | 35.94.32 | 4.270.10 | |
| LARS 06 | 0.00 | 0.080.002 | 0.000 | 0.620.02 | 8.080.06 | 0.00 | … | 2.090.15 |
| LARS 07 | 1.010.01 | 0.520.016 | 0.1000.001 | 2.610.08 | 8.360.05 | 40.90.41 | 4.750.11 | |
| LARS 08 | 1.000.07 | 1.500.045 | 0.0250.002 | 8.810.26 | 8.500.15 | 22.31.59 | 93.311 | |
| LARS 09 | 0.330.03 | 2.610.078 | 0.0070.001 | 15.00.45 | 8.400.05 | 3.310.28 | 2.85 | 51.01.4 |
| LARS 10 | 0.160.05 | 0.340.010 | 0.0260.008 | 2.290.07 | 8.510.14 | 8.902.82 | 21.53.2 | |
| LARS 11 | 1.200.20 | 1.660.050 | 0.0360.006 | 22.30.67 | 8.430.30 | 7.381.22 | 1212.6 | |
| LARS 12 | 0.930.10 | 1.960.059 | 0.0090.001 | 13.30.40 | 8.350.05 | 8.490.87 | 7.411.5 | |
| LARS 13 | 0.720.08 | 2.460.074 | 0.0100.001 | 18.80.56 | 8.500.12 | 6.060.68 | 59.21.8 | |
| LARS 14 | 4.460.43 | 1.990.060 | 0.1630.016 | 11.00.33 | 8.150.05 | 39.43.83 | 1.750.10 |
| W50 | MHI | Velocity Offset | fgas | |
|---|---|---|---|---|
| Property | aaValues are for all galaxies with a positive, unconfused detection. Standard deviation values are given in square brackets. | aaValues are for all galaxies with a positive, unconfused detection. Standard deviation values are given in square brackets. | aaValues are for all galaxies with a positive, unconfused detection. Standard deviation values are given in square brackets. | aaValues are for all galaxies with a positive, unconfused detection. Standard deviation values are given in square brackets. |
| (1) | (2) | (3) | (5) | (4) |
| /H | 0.52 [0.2] | 0.53 [0.06] | 0.083 [0.08] | 0.47 [0.4] |
| Lum( ) | 0.27 [0.1] | 0.05 [0.1] | 0.17 [0.04] | 0.00 [0.1] |
| H/H | 0.67 [0.1] | 0.75 [0.1] | 0.50 [0.05] | 0.45 [0.3] |
| f | 0.53 [0.2] | 0.63 [0.1] | 0.15 [0.1] | 0.40 [0.4] |
| EW | 0.33 [0.2] | 0.60 [0.1] | 0.10 [0.1] | 0.45 [0.3] |
| 0.81 [0.1] | 0.45 [0.1] | 0.44 [0.2] | 0.57 [0.1] | |
| SFR area-1 | 0.15 [0.1] | 0.40 [0.2] | 0.067 [0.04] | 0.43 [0.2] |