AKARI IRC 2.5–5 m spectroscopy of infrared galaxies over a wide luminosity range
Abstract
We present the result of a systematic infrared 2.5–5 m spectroscopic study of 22 nearby infrared galaxies over a wide infrared luminosity range () obtained from AKARI Infrared Camera (IRC). The unique band of the AKARI IRC spectroscopy enables us to access both the 3.3 m polycyclic aromatic hydrocarbon (PAH) emission feature from star forming activity and the continuum of torus-dust emission heated by an active galactic nucleus (AGN). Applying our AGN diagnostics to the AKARI spectra, we discover 14 buried AGNs. The large fraction of buried AGNs suggests that AGN activity behind the dust is almost ubiquitous in ultra-/luminous infrared galaxies (U/LIRGs). We also find that both the fraction and energy contribution of buried AGNs increase with infrared luminosity from to , including normal infrared galaxies with . The energy contribution from AGNs in the total infrared luminosity is only 7% in LIRGs and 20% in ULIRGs, suggesting that the majority of the infrared luminosity originates from starburst activity. Using the PAH emission, we investigate the luminosity relation between star formation and AGN. We find that these infrared galaxies exhibit higher star formation rates than optically selected Seyfert galaxies with the same AGN luminosities, implying that infrared galaxies could be an early evolutionary phase of AGN.
Subject headings:
galaxies: active — galaxies: nuclei — infrared: galaxies1. INTRODUCTION
Dust emission gives us crucial information to understand both the history of cosmic star formation in galaxies and that of supermassive black hole (SMBH) growth in galactic centers. Intense star formation produces a great amount of dust, which makes its activity invisible in the ultraviolet band but visible in the infrared band. Similarly, the central engines of active galactic nuclei (AGNs) are surrounded by dusty “tori” (Krolik & Begelman, 1986). Since optical and ultraviolet lights are very easily obscured by the torus, the most complete search for AGNs can be made by detecting hard X-rays from the central engine or infrared emission from the heated dust. Utilizing X-ray data of the Chandra Deep Field South, Brightman & Ueda (2012) reported that the fraction of “Compton-thick” AGNs (those with absorption column densities of cm-2) increases with redshift from to . This fact implies that the level of dust-obscuration of AGN may be correlated to the star formation activity, which has a peak at (Hopkins & Beacom, 2006). Indeed, Goulding et al. (2012) gathered all available Spitzer spectra of local Compton-thick AGNs and found strong starburst (SB) features in their average infrared spectrum, suggesting that SB activity and highly obscured tori are somehow coupled each other. Ichikawa et al. (2012) also reported the same trend for buried AGNs with small opening angles of tori (“new type” AGNs; Ueda et al., 2007; Winter et al., 2009; Eguchi et al., 2009, 2011) detected in the Swift/BAT survey. Although hard X-rays are useful to search for obscured AGNs, extremely heavily buried AGNs with cm-2 are difficult to be detected due to flux attenuation by repeated Comptonization even at energies above 10 keV (e.g., Ikeda et al., 2009; Brightman & Nandra, 2011).
Candidates of galaxies that host such buried AGNs are infrared galaxies, defined as those having large infrared luminosities () with . Among infrared galaxies, those in the range are called luminous infrared galaxies (LIRGs; Sanders & Mirabel, 1996) and more luminous ones in the range are called ultraluminous infrared galaxies (ULIRGs; Sanders et al., 1988). Their bolometric luminosities are dominated by the infrared emission, suggesting that very luminous heating sources are surrounded by dust and then the heated dust re-emits in the infrared band. The hidden energy sources are believed to be either SB, AGN, or both. Disentangling the energy sources of infrared galaxies is crucial to unveil the history of dust obscured star formation and SMBH growth in the universe (Le Floc’h et al., 2005; Goto et al., 2010; Magnelli et al., 2011; Murphy et al., 2011).
Veilleux et al. (1995, 1999); Yuan et al. (2010) studied AGN activity in U/LIRGs on the basis of optical observations. They showed that the fraction of AGNs increases with infrared luminosities in the range of . One caveat of their optical diagnostics is that one cannot identify buried AGNs embedded in dust-tori with very small opening angles where no significant narrow line regions can be formed. Unlike the AGNs which are optically-classified type-2 Seyfert, such buried AGNs are elusive to conventional optical spectroscopy (Maiolino et al., 2003). After the launch of Spitzer, the AGN activity in local U/LIRGs has been also addressed in the infrared band. Nardini et al. (2008, 2009, 2010) observed ULIRGs with Spitzer/IRS 5–8 m spectroscopy, and investigated both the SB and AGN contributions by fitting SB/AGN templates to the spectra. They found the increasing AGN significance with infrared luminosity, confirming the same trend reported from the optical studies. Alonso-Herrero et al. (2012) observed the 5–38 m spectra of LIRGs with Spitzer. They decomposed the spectra into SB and AGN components using a SB galaxy template and clumpy torus models (Nenkova et al., 2008a, b; Asensio Ramos & Ramos Almeida, 2009), which are supported by observations (e.g., Gandhi et al., 2009; Ichikawa et al., 2012). They confirmed that the AGN energetic contribution to the total power increases with infrared luminosity from .
Infrared 2.5–5 m spectroscopy is another powerful tool to study optically-elusive buried AGNs in U/LIRGs. One advantage of this band is that dust extinction is much lower than in the optical band (Nishiyama et al., 2009) and is similar to that in the 5–13 m band (Lutz et al., 1996). Another great advantage is that SB and AGN activity can be distinguished based on the spectral features. First, strong polycyclic aromatic hydrocarbon (PAH) emission, a pure star formation tracer, is located at 3.3 m in SB galaxies, while pure AGNs exhibit PAH-feature free spectra due to the effects that 1) the X-ray emission destroying the PAHs, and 2) the strong continuum emission originating from AGN hot-dust diminishes this feature (Moorwood, 1986; Imanishi & Dudley, 2000). SB galaxies generally show large 3.3 m PAH equivalent widths of nm, which never go down below 40 nm. Thus, objects with nm may be classified as galaxies that harbor buried AGNs. In SB/AGN composite galaxies, strong PAH emission can be observed because the AGN cannot destroy the PAH molecules located in the outer ( pc) region from the central engine due to shielding by dust and gas. However, strong AGN continuum makes EW3.3PAH smaller, well below nm. Using this method, many authors reported the strong sign of buried AGNs in ULIRGs (Imanishi et al., 2006; Sani et al., 2008; Risaliti et al., 2010) and LIRGs (Imanishi et al., 2008, 2010). Another key feature in the 2.5–5 m band is the continuum slope (). SB galaxies have blue continuum slopes () in this band due to the contribution of the stellar photospheric continuum. Conversely, galaxies with AGNs have hot-dust emission heated by AGNs, which produces a red continuum (). This method was first reported by Risaliti et al. (2006) and successfully applied to ULIRGs (Sani et al., 2008; Risaliti et al., 2010) and LIRGs (Imanishi et al., 2008, 2010). Imanishi et al. (2010) combined the two methods ( nm and/or ) to find buried AGNs from a sample of U/LIRGs showing no AGN signatures in the optical spectra. They found that the fraction of buried AGNs increases with infrared luminosity in the range of .
In this paper, we expand the studies of U/LIRGs by Imanishi et al. (2010) into a lower infrared luminosity range, by including normal infrared galaxies (IRGs) with , where comprehensive studies are still missing due to the limited sample. This is because L/IRGs have spatially more extended infrared emission ( kpc, corresponding to several arcseconds at ) compared with ULIRGs (Soifer et al., 2001; Imanishi et al., 2011b), and therefore slit spectroscopy with ground based telescopes could miss their extended emission. Slit-less spectroscopy of Infrared Camera (IRC; Onaka et al., 2007) on board AKARI (Murakami et al., 2007) with 1 aperture opened a new window to probe such extended emission of L/IRGs. Throughout this paper, we adopt km s-1Mpc-1, , and for consistency with the previous publications (Imanishi et al., 2008, 2010).
2. TARGETS
Our motivation is to search for buried AGNs from optically non-Seyfert infrared galaxies and investigate their properties over a wider range of infrared luminosity than in previous studies. An ideal sample can be selected from unbiased catalogs of infrared galaxies with various infrared luminosities at redshifts of , where 3.3 m PAH is detectable in the AKARI/IRC 2.5–5.0 m spectra. To this end, we first gather U/LIRGs with high far-infrared fluxes from IRAS catalogs. Our ULIRGs are mainly selected from the bright ULIRG catalog by Klaas et al. (2001), consisting of 41 sources 25 out of which are optically non-Seyfert galaxies. These ULIRGs have IRAS 60 m fluxes Jy and far-infrared (40–120 m) luminosities 111This luminosity is based on the paper of Klaas et al. (2001), where km s-1Mpc-1. Therefore, in our study with km s-1Mpc-1, some galaxies reach .. In addition to these sources, we also gather 54 fainter, local () optically non-Seyfert ULIRGs from the literature to increase the sample size. The LIRGs are mainly taken from the LIRG catalog of Carico et al. (1988), which is based on the IRAS Bright Galaxy catalog. The catalog consists of 61 sources with the criteria of IRAS 60 m fluxes Jy and far-infrared (40–400 m) luminosities . We select 41 optically non-Seyfert galaxies out of this sample. To further increase the number of L/IRG targets, we also utilize the catalog by Spinoglio et al. (2002). They compiled 76 ISO detected sources in the IRAS 12 m galaxy catalog, which gathered all galaxies at Galactic latitudes of down to the IRAS 12 m flux limit of Jy (Rush et al., 1993). Since AGN tori have peak emission at the MIR band, 12 m galaxy catalog could tend to include more AGNs than in far-infrared selected samples. Indeed, a majority of the Spinoglio et al. (2002) catalog (64 out of 76 sources) are optically Seyfert galaxies. Therefore, we gather the 12 optically non-Seyfert starburst galaxies from it. In summary, we select a sufficiently large number of non-Seyfert infrared galaxies (132 sources) as our “parent” sample to be followed-up with AKARI. The redshifts of all the sources in the above catalogs are distributed within .

3. OBSERVATIONS AND DATA REDUCTION
Observation was conducted with the IRC infrared spectrograph (Onaka et al., 2007) on board AKARI (Murakami et al., 2007). The spectra in the 2.5–5 m band were taken with the NG grism mode. This mode achieves an effective spectral resolution of at 3.6 m, which is sufficient for detecting and tracing the profile of m PAH emission. The IRC has a arcmin2 window with a pixel scale of arcsec2. All the data were taken as a part of the AKARI mission program called “AGNUL” (PI: T. Nakagawa). The observation settings were same as those described in Chapter 3 of Imanishi et al. (2010). One to seven pointings were assigned for each source according to the brightness. The total on-source exposure time was minutes per each pointing. We used IRCZ4 (phase 3; post liquid-He mission) observing mode, where one pointing is composed of eight or nine independent frames (Onaka et al., 2007). This mode successfully removes cosmic-ray contaminations even for sources observed by a single pointing. For sources observed with multiple pointings, we combined all the data to achieve the best signal-to-noise (S/N) ratio after excluding the data sets with particularly bad quality. We often had to discard data observed in later epochs of AKARI’s phase 3 operation due to the increasing background signal.
Spectral analysis was conducted in a standard manner by using the IDL data reduction package for AKARI IRC spectra222The software package is available through the AKARI data reduction webpage http://www.ir.isas.jaxa.jp/AKARI/Observation/. For the details of the data analysis, see Ohyama et al. (2007).. The dark-subtraction, linearity correction, and flat-field correction were performed using this IDL package. Some infrared galaxies with low luminosities () have spatially extended emission. Hence, we varied the aperture size for spectral extraction according to the actual signal profile of each source. The background was estimated from both sides of the spectral dispersion direction of the target and was subtracted from the source. The IDL package for AKARI also performed wavelength and absolute flux calibration. The accuracy of the wavelength calibration is pixel ( m), and that of the flux calibration is % around the central wavelength of the spectra and up to % at the edges close to 2.5 m and 5.0 m.
Out of the 132 sources in our parent sample, we observed 37 objects in total from 2008 June until 2010 February with AKARI. After the epoch, AKARI fell into the stage where the data highly suffered from the significant background emission. As the result, we could not observe the remaining 95 targets. Also, due to AKARI’s Sun-synchronous polar orbit, higher visibilities were achieved for objects at higher ecliptic latitudes. These AKARI’s observational constraints make it difficult for us to construct a uniformly flux-limited sample over the entire sky with AKARI. However, the observable targets are essentially randomly selected from the parent sample with no selection biases regarding the physical nature of the galaxies. Hence, we regard that our sample has no obvious bias.
Next, we also set the criterion that the averaged S/N ratio for each spectral channel must be higher than 5 in order to apply our spectral deconvolution analysis. Among the 37 targets observed with AKARI, five sources were discarded due to their low S/N ratio and the other 10 sources were too faint to be detected. 14 out of 15 non-detected sources are fainter ULIRGs gathered from the literature. These sources have 60 m flux Jy, which is roughly 10 times fainter than that of the detected sources ( Jy). Supposing that their infrared spectral energy distribution does not change drastically from that of the detected sources, we can regard that the most of the non-detected sources are intrinsically too faint to be observed with AKARI/IRC. Figure 1 shows the redshift distribution of the finally selected 22 infrared galaxies.
| Name | ObsID | Components | ||||||
|---|---|---|---|---|---|---|---|---|
| (1) | (2) | (3) | (4) | (5) | (6) | (7) | (8) | (9) |
| ESO 286-IG19 | 1122176-001 | 0.043 | 0.28 | 1.90 | 12.71 | 10.58 | 12.00 | 2comp |
| IC 5135 | 1120236-001 | 0.016 | 0.63 | 2.14 | 16.67 | 26.27 | 11.33 | 2comp |
| IRAS 03068-5346 | 1122105-001 | 0.074 | 0.25 | 0.20 | 3.43 | 3.92 | 11.98 | 2comp |
| IRAS 03538-6432 | 1122106-001 | 0.30 | 0.25 | 0.25 | 0.96 | 1.54 | 13.01 | 2comp |
| IRAS 10494+4424 | 1122096-001 | 0.092 | 0.25 | 0.25 | 3.36 | 5.60 | 12.22 | 2comp |
| IRAS 17028+5817 | 1122101-001 | 0.11 | 0.25 | 0.08 | 2.49 | 4.05 | 12.22 | 2comp |
| IRASF 07353+2903 | 1120200-001 | 0.33 | 0.08 | 0.10 | 0.22 | 0.64 | 12.63 | 2comp |
| MCG +02-04-025 | 1122123-001 | 0.031 | 0.37 | 1.46 | 11.13 | 10.29 | 11.67 | 2comp |
| MCG +08-23-097 | 1122130-001 | 0.029 | 0.25 | 0.53 | 5.08 | 8.10 | 11.34 | 2comp |
| MCG +10-19-057 | 1122132-001 | 0.031 | 0.40 | 1.92 | 11.35 | 10.81 | 11.70 | 2comp |
| Mrk 1490 | 1122134-001 | 0.026 | 0.25 | 0.86 | 6.21 | 8.38 | 11.30 | 3comp |
| Mrk 551 | 1122171-001 | 0.050 | 0.26 | 0.80 | 4.63 | 6.13 | 11.80 | 2comp |
| Mrk 848 | 1122136-001 | 0.040 | 0.32 | 1.52 | 9.38 | 10.26 | 11.86 | 2comp |
| NGC 2339 | 1120230-001 | 0.0074 | 0.53 | 2.11 | 18.96 | 32.24 | 10.69 | 3comp |
| NGC 2388 | 1120231-001 | 0.014 | 0.49 | 1.99 | 16.21 | 23.09 | 11.15 | 3comp |
| NGC 4102 | 1120232-001 | 0.0028 | 1.45 | 6.83 | 47.37 | 68.50 | 10.25 | 2comp |
| NGC 4194 | 1122091-001 | 0.0083 | 0.86 | 4.36 | 22.79 | 25.94 | 10.88 | 3comp |
| NGC 4818 | 1120234-001 | 0.0036 | 0.85 | 3.88 | 20.26 | 26.55 | 10.10 | 3comp |
| NGC 520 | 1120229-001 | 0.0076 | 0.78 | 2.83 | 31.52 | 48.40 | 10.91 | 3comp |
| NGC 6285 | 1122138-001 | 0.019 | 0.30 | 0.44 | 7.43 | 23.58 | 11.21 | 3comp |
| NGC 838 | 1122173-001 | 0.013 | 0.59 | 1.83 | 0.40 | 17.94 | 10.74 | 3comp |
| ZW 453.062 | 1122140-001 | 0.025 | 0.29 | 0.57 | 7.59 | 11.04 | 11.34 | 2comp |
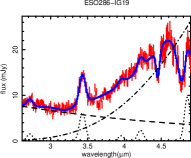
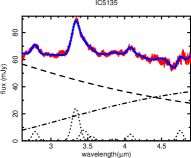
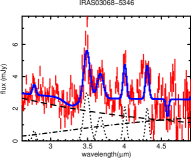
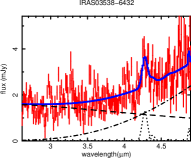
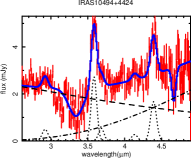
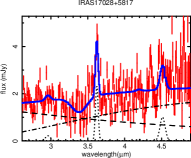
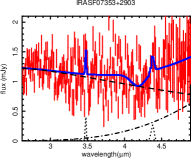
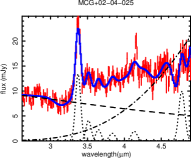
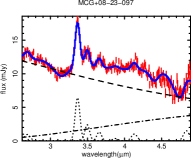
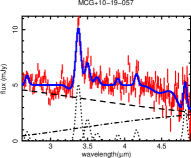
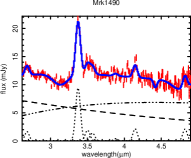
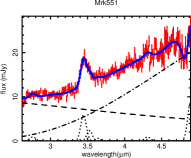
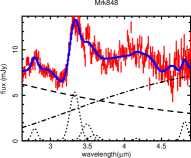
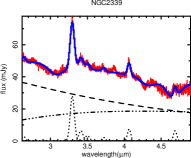
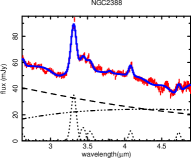
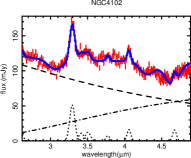
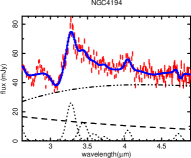
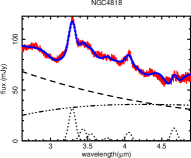
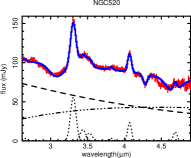
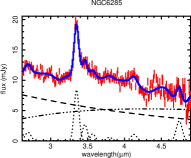
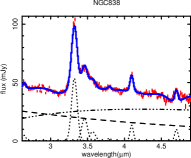
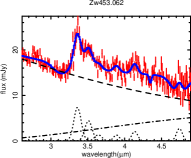
Note. — Table 1 summarize the basic information of our targets. (1) object name: (2) observation ID of AKARI: (3) redshift: (4)–(7) 12, 25, 60, and 100 m IRAS flux density in the unit of Jansky (Jy): (8) total infrared (8–1000 m) luminosity in units of solar luminosity (), calculated from (Sanders & Mirabel, 1996): (9) number of continuum components adopted to fit each spectrum: “2comp” and “3comp” correspond to the model spectra given by equation (6) and (7) in section 4.4, respectively. In a case of “3comp”, the main flux contribution originates from stellar and Hii components with little contribution from dust component. This is why for “3comp” sources the dust component (dashed-dot line) is hardly seen in Figure 2.
4. AGN/SB SPECTRAL DECOMPOSITION and BURIED AGN DIAGNOSTICS
For understanding the properties of buried AGNs in infrared galaxies, it is crucial to analyze the infrared spectra by decomposing SB and AGN components. The 2.5–5.0 m band covered by AKARI IRC has unique advantages for detecting AGN signatures. As introduced in Section 1, one promising method for finding buried AGNs is the strength (equivalent width) of the 3.3 m PAH emission as proposed by Imanishi & Dudley (2000). Pure SB galaxies show generally strong 3.3 m PAH emission with EW nm because plenty of SB-produced UV photons excite PAH molecules (Mouri et al., 1990). By contrast, if an AGN resides in the galaxy, the PAH feature becomes weaker, EW nm (Imanishi & Dudley, 2000). Imanishi et al. (2008, 2010) also used the red continuum slope ( for ) for finding buried AGNs. In this paper, we develop the previous works not only to find buried AGNs but also to quantitatively estimate their energy contribution by performing detailed spectral fitting with a continuum model consisting of a stellar component and dust components from AGN and/or SB. Emission and absorption line features are also included in the model.
4.1. AGN-heated dust component
The AGN emission in the near- to mid-infrared originates from the radiation reprocessed by hot dust in the torus. Recent studies of dusty torus models reproduce the observed nuclear mid-infrared emission well by assuming that the torus media have a clumpy structure (e.g., Nenkova et al., 2008a, b; Ramos Almeida et al., 2009, 2011; Alonso-Herrero et al., 2011). However, some authors mentioned that there are difficulties in fitting their near-infrared spectral energy distribution (SED) (Stalevski et al., 2012; Lira et al., 2013; Videla et al., 2013). This is due to the complicated degeneracies including a possible existence of an extra hot-dust ( K) component originating from the vicinity of the AGN (Kishimoto et al., 2011), and/or contamination from the host galaxies, and/or the extinction of the torus emission by interstellar matter in the host galaxies. In this work, we take the simplest approach to approximate the torus dust emission by a single blackbody component, considering our limited wavelength range. Presumably, the dusty torus has a continuous dust temperature distribution and produces emission peaked around 10 m. Hence, our single blackbody fit should trace its peak temperature at 300 K. Accordingly, we set a conservative upper limit on its temperature as K (Oyabu et al., 2011).
4.2. Stellar and Starburst Component
The stellar photospheric emission in the host galaxy contributes to the total radiation in the 2.5–5.0 m spectral range. This component produces a decreasing continuum flux at m (Sawicki, 2002). We first determine the temperature by fitting the 2MASS and photometric data with a blackbody model, and fix the temperature at its best-fit value when analyzing the AKARI 2.5–5.0 m spectra. For Mrk 551 and Mrk 848, we cannot find any 2MASS fluxes. Therefore, we use the and photometric data from the literature (Spinoglio et al., 1995) instead of the 2MASS data. SB produces a large amount of dust, which generally has lower temperatures than those of the AGN-heated dust, typically K (Sanders & Mirabel, 1996). As already suggested by Sawicki (2002) and many other studies, such cold dust with K does not significantly contribute to the 2.5–5.0 m spectra, and therefore we ignore the contribution from the SB dust emission. However, some SB galaxies show excess emission from very hot dust with a temparature of K, requring at least two blackbody components. This very hot dust component of K would not originate from the dusty torus, from which blackbody radiation of 300 K is generally expected (see Section 4.1.). One possible origin is the emission mainly heated by massive stars in Hii regions (Hunt et al., 2002; Lu et al., 2003; Siebenmorgen, 1993). If such emission is required from the data, we model it with a single blackbody with a temperature of K in a range of K as suggested by Hunt et al. (2002).
| Name | EW3.3PAH | AGN | AGN | ||||
|---|---|---|---|---|---|---|---|
| sign (EW) | sign (red) | ||||||
| (1) | (2) | (3) | (4) | (5) | (6) | (7) | |
| ESO 286-IG19 | N | Y | |||||
| IC 5135 | N | Y | |||||
| IRAS 03068-5346 | N | Y | |||||
| IRAS 03538-6432 | Y | Y | |||||
| IRAS 10494+4424 | N | Y | |||||
| IRAS 17028+5817 | N | Y | |||||
| IRASF 07353+2903 | Y | Y | |||||
| MCG +02-04-025 | N | Y | |||||
| MCG +08-23-097 | N | Y | |||||
| MCG +10-19-057 | N | Y | |||||
| Mrk 1490 | N | N | |||||
| Mrk 551 | N | Y | |||||
| Mrk 848 | N | Y | |||||
| NGC 2339 | N | N | |||||
| NGC 2388 | N | N | |||||
| NGC 4102 | Y | Y | |||||
| NGC 4194 | N | N | |||||
| NGC 4818 | N | N | |||||
| NGC 520 | N | N | |||||
| NGC 6285 | N | N | |||||
| NGC 838 | N | N | |||||
| ZW 453.062 | N | Y |
Note. — Table 2 summarizes the observed properties of the 22 sources obtained from the AKARI spectroscopy. (1) object name: (2) equivalent width of 3.3 m PAH emission: (3), (4), (5) temperature of black body originated from stellar emission, Hii emission, and dust emission. See Section 4 for the detail: (6) AGN sign based on the PAH diagnostic. “Y” represents the source has buried-AGN sign (EW nm), while “N” represents no AGN sign (EW nm): (7) AGN sign based on the hot-dust diagnostic. “Y” represents the source with K, while “N” represents the source with K.
4.3. Emission and Absorption lines
The 2.5–5.0 m spectra of infrared galaxies contain various emission/absorption line features. The previous studies of the AKARI “AGNUL” program (Imanishi et al., 2008, 2010) reported three PAH lines at 3.3, 3.4, and 3.5 m, hydrogen Brakett series at 4.05 m Br and 2.63 m Br, and Pfund series at 4.65 m Pf and 3.74 m Pf as emission lines. They also reported absorption features at 3.1 m by H2O ice, at 4.29 m by CO2, and at 4.67 m by CO. Because PAH emission is believed to originate from solid state molecules, the line profile becomes Lorentzian (Yamada et al., 2013). For simplicity, however, we model all the lines including those of PAH by Gaussian profiles, following Imanishi et al. (2010). The central wavelength and line width are fixed within a spectral resolution at appropriate values reported in the literature.
| Name | ||||||||||
|---|---|---|---|---|---|---|---|---|---|---|
| (1) | (2) | (3) | (4) | (5) | (6) | (7) | (8) | (9) | (10) | (11) |
| ESO 286-IG19 | ||||||||||
| IC 5135 | ||||||||||
| IRAS 03068-5346 | ||||||||||
| IRAS 03538-6432 | ||||||||||
| IRAS 10494+4424 | ||||||||||
| IRAS 17028+5817 | ||||||||||
| IRASF 07353+2903 | ||||||||||
| MCG +02-04-025 | ||||||||||
| MCG +08-23-097 | ||||||||||
| MCG +10-19-057 | ||||||||||
| Mrk 1490 | ||||||||||
| Mrk 551 | ||||||||||
| Mrk 848 | ||||||||||
| NGC 2339 | ||||||||||
| NGC 2388 | ||||||||||
| NGC 4102 | ||||||||||
| NGC 4194 | ||||||||||
| NGC 4818 | ||||||||||
| NGC 520 | ||||||||||
| NGC 6285 | ||||||||||
| NGC 838 | ||||||||||
| ZW 453.062 |
Note. — Table 3 summarizes the observed properties including continuum fluxes and luminosities of the 22 sources obtained from the AKARI spectroscopy. (1) object name: (2), (3), (4) flux of the stellar, Hii, and AGN blackbody component in units of erg cm-2 s-1, respectively: (5) 3.3 m PAH flux in units of erg cm-2 s-1: (6) optical thickness of H2O ice: (7), (8), (9) logarithmic luminosity of the stellar, Hii, and dust-torus blackbody component in units of erg s-1, respectively: (10) logarithmic luminosity of the 3.3 m PAH emission in units of erg s-1: (11) ratio of the AGN blackbody luminosity to the total infrared luminosity.
4.4. Total model spectra
We thus construct a spectral model consisting of the multiple continuum components over which the emission/absorption lines are superposed. For the continuum we consider three blackbody components, (1) a direct stellar component , (2) a dust component from AGN with a temperature below 800 K , and (3) a very hot (800 K–1200 K) dust component from Hii regions . Each blackbody component has two parameters, normalization () and temperature (), which, except for , are left as free parameters in the spectral fit.
Previous studies suggest that emission from warm dust may be partly absorbed by outer cold dust (e.g., Risaliti et al., 2010; Imanishi et al., 2010). To take this into account, we apply an extinction correction by incorporating into the blackbody components. We adopt the dust extinction index of (Draine, 1989; Hunt et al., 2002) as
| (1) |
The normalization value can be estimated from the optical thickness of 3.1 m ice (), which is calculated by using the deconvolved continuum from the dust (). Imanishi & Maloney (2003) estimated the relationship between the dust extinction and with
| (2) |
where is the fraction of dust that is covered with an ice mantle. The maximum value of is derived to be 0.3 in the core of U/LIRGs in Imanishi & Maloney (2003). From the relation between the optical thickness and extinction with and Eq. (2) with ,
| (3) |
is derived. By combining Eq. (1) and (3), at the band (0.55 m),
| (4) | ||||
| (5) |
Accordingly, we model ths observed component as , where .
First, we adopt only two continuum components of direct stellar emission and AGN/SB dust emission to fit the observed spectra, because the contribution of dust emission from Hii regions is not always required from the data. This model (2 component model) is written as:
| (6) |
where represents each line’s profile as described in Section 4.3. In some cases, mainly for sources showing little contribution from , the 2-component model given by equation (6) does not fit the data well. Then, we add the component to the above model:
| (7) |
We adopt this model (3 component model) only when the fitting result is significantly improved from the 2-component model with a % confidence level on the basis of an F-test. The fitting model we adopt for each source is summarized in Table 1. As shown in Figure 2, all sources that require the three components are galaxies showing blue contina in their spectra (e.g., NGC 4818). As many authors (e.g., Risaliti et al., 2010; Imanishi et al., 2010) suggested, these galaxies do not show buried AGN signs but are more likely normal SB galaxies. This is consistent with our assumption that the extra hot ( K) component should originate from Hii regions, not from the AGN torus.
[tbp]
5. RESULTS and DISCUSSIONS
5.1. AKARI spectra and AGN diagnostics
Figure 2 displays the observed AKARI spectra of all the 22 sources (red dots with flux error bars) overplotted with their best-fit models (blue line). Each line/continuum component is also plotted in the figure. As noticed, a majority of sources show 3.3 m PAH emission features. Table 2 and 3 summarize the fitting results.
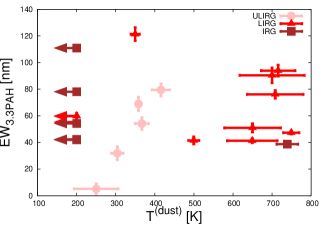
For finding buried AGNs, we apply two AGN diagnostics: (1) PAH emission line and (2) torus-dust continuum. The PAH diagnostic is based on EW3.3PAH as discussed in Section 4; we identify a buried AGN if it shows a small 3.3 m PAH equivalent width with EW nm. The torus-dust diagnostic is based on whether or not there is a contribution from a hot dust component from the torus; we set the criterion of identifying buried AGN as K.
In the left panel of Figure 3, we present the two AGN diagnostic diagram applied for our sample, where ULIRGs/LIRGs/IRGs are plotted as pink circles/red triangles/brown squares, respectively. There is a clear boundary of distribution of the dust temperature around K. This supports our criterion that AGNs should have high dust temperatures ( K) and are well distinguishable from SBs. Interestingly, many infrared galaxies with large PAH equivalent widths (EW nm) show high dust temperatures ( K). One reason could be that because of the large aperture of AKARI/IRC and less luminous nucleus emission in these galaxies, the spectra contain relatively large contribution of 3.3 m PAH emission in the host galaxies where PAH molecules are not destroyed by AGN X-ray photons. This effect works to increase the PAH equivalent width, and hence the PAH diagnostic could miss buried AGNs. By contrast, the hot-dust diagnostic is not subject to the aperture effect because the continuum emission can be properly decomposed by the spectral fit. In fact, the torus-dust AGN diagnostic can recover all the buried AGNs identified by the PAH diagnostic; in other words, there is no source with a low dust temperature ( K) and a small PAH equivalent width (EW nm) in our sample. This supports the superiority of using the hot-dust diagnostic for finding AGNs completely.
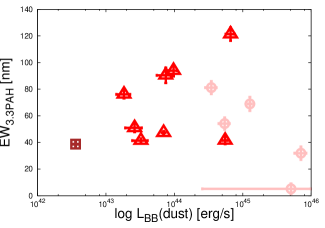
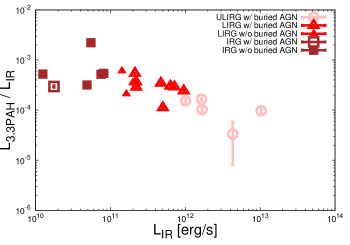
The right panel of Figure 3 shows the plot of EW3.3PAH versus dust luminosity () tabulated in Table 2 and Table 3. In the figure, we plot only the sources with K. This is because the 2.5–5.0 m spectral range is not sensitive to the dust emission with low temperature K. In this case, only an upper limit of the dust luminosity can be derived. This is the reason why the dust luminosity with K is very small, erg s-1. The figure shows that all the sources with K have significant dust emission with erg s-1. Thus, the alternative criterion for detecting AGNs can be erg s-1 instead of K . In summary, we conclude that the hot-dust AGN diagnostic is a better method for finding buried AGNs in the AKARI IRC band.
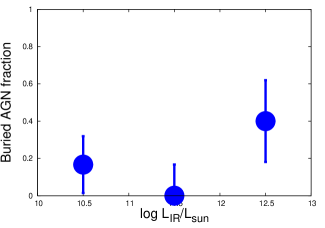
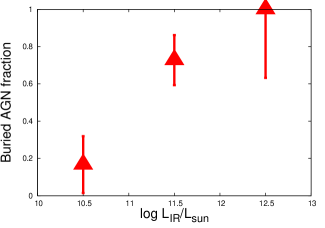
5.2. Buried AGN contribution as a function of infrared luminosity
One motivation of our study is to reveal how frequently buried AGNs exist in infrared galaxies. Figure 4 shows the fraction of buried AGN as a function of infrared luminosity. The left and right panels show the results based on the PAH AGN diagnostic and on the torus-dust AGN diagnostic, respectively. As discussed above, the latter diagnostic is more complete than the former for finding buried AGNs from infrared galaxies. Therefore, we discuss the result of the right panel hereafter.
In total, we detect 14 buried AGNs out of the 22 infrared galaxies without any AGN signs in the optical band. We also find a clear trend that the fraction of buried AGN increases with infrared luminosity. While only 17% (1 out of 6 sources) of the IRGs contain buried AGNs, the U/LIRGs contain them almost ubiquitously (% for LIRGs and % for ULIRGs). Our results for U/LIRGs are consistent with those obtained by Imanishi et al. (2010) within the statistical uncertainties. Although most of the IRGs are selected from the 12 m galaxy catalog, which is sensitive to torus-dust emission, an AGN is detected only from one source out of the five targets.
The high AGN fraction in U/LIRGs may be related with their high merger rates. There is strong observational evidence that most of U/LIRGs have experienced merging or strong galaxy-galaxy interactions (Veilleux et al., 2002). The mergers can induce strong SB within the galaxies, which also make galactic gas fall into the galactic center and trigger AGN activity obscured by dust (Sanders et al., 1988; Mihos & Hernquist, 1996; Di Matteo et al., 2005; Hopkins et al., 2006). Sanders & Ishida (2004) show that infrared galaxies with signs of recent merger drastically increase at toward a higher luminosity range. This result is in accordance with our finding that the buried AGN fraction drastically increases from .
We confirm the dependence of the AGN fraction on luminosity by investigating the ratio between the 3.3 m PAH luminosity () and total infrared luminosity . Pure SB galaxies generally have a constant ratio . If an AGN exists inside the galaxy, the ratio becomes smaller because X-rays from the AGN destroy PAH molecules and the infrared continuum luminosity is increased by the torus-dust emission. Figure 5 plots as a function of infrared luminosity for our sample. As noted, it decreases with infrared luminosity, especially at . We also find that the sources with small ratios match to those with buried AGN signs, supporting the above idea. Note that there is a possibility that this trend may be caused by the destruction of small PAH molecules by major mergers (Yamada et al., 2013) rather than by AGNs. Nevertheless, since all the sources with show buried AGN signs, the conservative criterion could be phenomenologically used as another diagnostic for finding buried AGNs.
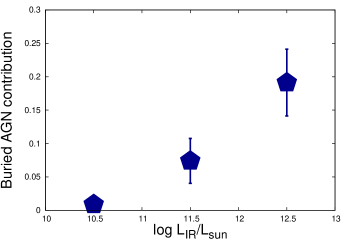
5.3. Luminosity contribution of buried AGN to the total infrared luminosity
Our second motivation is to determine the energetic importance of AGNs in these infrared galaxies. As discussed in Section 5.1, the luminosity contribution from dust blackbody component () predominantly originates from AGN-heated dust, and the luminosity contribution of SB-heated dust to is negligible. Thus, using the best-fit blackbody parameters obtained by the spectral fit, we can estimate the total luminosity from AGN-heated dust and hence its ratio to the total infrared luminosity. Figure 6 shows the averaged fraction of AGN power to the total infrared luminosity for IRGs, LIRGs, and ULIRGs. As noticed, the AGN contribution increases with infrared luminosity, while the values are quite small, % in IRGs, % in LIRGs, and % in ULIRGs. This suggests that the bulk of the infrared emission originates from SB, not from AGNs in these galaxies. One caveat for this result is that we cannot completely exclude the possibility that the estimated luminosity of might be partially originated from the torus-dust if it has an extreme temperature distribution. We thus calculate the averaged ratio to check if it could have a significant contribution. We find %, suggesting that the main results above would not be affected, even if the observed very hot ( K) dust component were totally due to the AGN emission.
Another caveat for interpreting this result is the selection bias for our sample, which consists of optically non-Seyfert galaxies. Previous studies based on samples including optically Seyfert AGNs found larger average AGN contribution to the total infrared luminosity, 10–15% in LIRGs (Petric et al., 2011; Alonso-Herrero et al., 2012) and 15–40% in ULIRGs (Veilleux et al., 2009; Nardini et al., 2010; Risaliti et al., 2010).
Our results are in good agreement with those by Lee et al. (2012) within the errors, who obtained the AGN to total luminosity ratio of 6–8% in LIRGs and 11–19% in ULIRGs, using a similar sample to ours that preferentially includes optically non-Seyfert infrared galaxies. They calculated the AGN contribution by performing SED fit with the Decompir package (Mullaney et al., 2011). This method requires infrared SED data covering the far-infrared band, while our method only uses the AKARI 2.5–5 m spectra. This supports that our simple assumption in the spectral model (ie, single blackbody for dust emission) works well in estimating the AGN luminosity. This simple method will have a great advantage in the era of JWST, because we can apply our method to high- galaxies by observing the rest 2.5–5.0 m band (5.0–10.0 m at and 7.5–15.0 m at ) with JWST/MIRI (5–28 m). Other methods based on the Spitzer bandpass (5–35 m) would have a difficulty in studying high- objects; for instance, the observed spectral range corresponds to 15–105 m at , which only the SPICA mission can cover. Thus, our method is achievable for studying infrared galaxies in the distant universe even before the launch of SPICA (from 2025–).
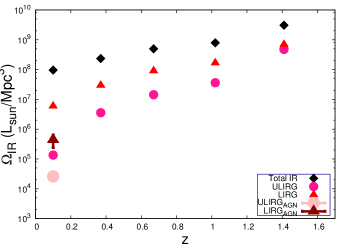
Combining our result with the total infrared luminosity density produced by U/LIRGs in the local universe ( /Mpc3 and /Mpc3) (Goto et al., 2011), we estimate the local AGN luminosity density in the infrared band (). We find /Mpc3 for LIRGs and /Mpc3 for ULIRGs. These values are about an order of magnitude lower than the estimate by Goto et al. (2011). This is because Goto et al. (2011) simply assumed that the infrared luminosity of galaxies classified as AGNs entirely originates from AGNs, while we quantitatively take into account the fraction of AGN contribution to the total infrared luminosity of infrared galaxies. Figure 7 shows the infrared luminosity density as a function of redshift derived by Goto et al. (2010, 2011) together with our results of AGN the infrared luminosity density. In the era of JWST, we can fill in the AGN infrared luminosity density at high redshifts thanks to their improved sensitivity in the mid-infrared band.
5.4. Evolutionary track of IR galaxies
Comparison between the starburst and AGN activity gives crucial information to understand the process of galaxy-SMBH co-evolution. For optically selected Seyfert galaxies and QSOs, many authors found that the luminosity of star formation () and that of AGN () are well correlated with each other (Netzer, 2009; Oi et al., 2010; Imanishi et al., 2011a). We can derive a SF luminosity as . The AGN-heated dust luminosity () summarized in Table 3 can be converted to an AGN bolometric luminosity () by using two relations given in Gandhi et al. (2009) and Marchese et al. (2012), respectively,
| (8) | ||||
| (9) |
Here represents the intrinsic luminosity of the accretion disk integrated in the optical to X-ray band. Assuming , we obtain
| (10) |
Noted that the estimated bolometric AGN luminosity () derived in Equation (10) can be overestimated. The relations from Equation (8) to (10) are derived from the sample of non-hidden Seyfert AGNs, while our sources are infrared galaxies with highly obscured (=hidden) AGNs. Therefore, our sources in this study could have higher covering fraction of dusty-torus than those of Seyfert AGNs. This means the ratio of mid-infrared over bolometric luminosity in our sources could be larger than those of Seyfert AGNs.
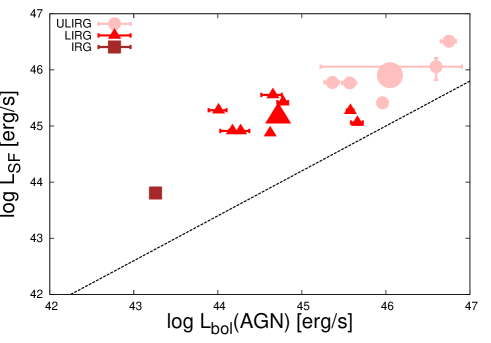
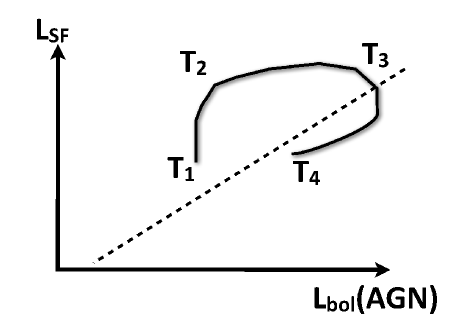
Figure 8 shows the versus relations obtained from our sample. The average luminosities of U/LIRG are also plotted in the same figure. The dotted line corresponds to the linear correlation obtained from optically selected Seyfert galaxies obtained by Netzer (2009). Interestingly, all the sources except two (IRAS F07353+2903 and ESO 286-IG19) are located above the Seyfert line. This result may reflect the difference in the evolutional stage of galaxies, from a pure SB phase (U/LIRGs) to an unburied AGN phase (Seyferts). As discussed in Section 5.2, U/LIRGs have recently experienced or are facing mergers, which result in strong SB activity from the epoch to in Figure 8. The SB also triggers AGN activity, which continues from to . Finally, the SB activity is gradually weakened due to the shortage of gas and feedback from the AGN, and the supply of matter from the host galaxy onto the central engine also decreases, from to . In this framework of galaxy evolution, the evolutional stage of ULIRGs should be a later phase of mergers than that of LIRGs. The picture is in good agreement with observations that the morphology of ULIRGs are more compact than that of LIRGs, suggesting that ULIRGs have just finished the merger process while that of LIRGs is still on-going. This scenario suggests that infrared galaxies containing buried AGNs could be an earlier evolutional stage of AGN, which will be evolved to normal (unburied) Seyferts/QSOs. This scenario becomes much more reasonable if our bolometric AGN luminosity () is overestimated as discussed in the previous paragraph because all the points are shifted to the left in the figure. While our sample size is still small, the new AGN diagnostics developed in this paper can be applied to other sources. Further studies using a well-defined complete sample of infrared galaxies should be urged to complete our view of AGN evolution.
6. CONCLUSIONS
We obtained the AKARI 2.5–5.0 m spectra of 22 infrared galaxies at selected mainly from three infrared catalogs: bright ULIRG catalog (Klaas et al., 2001), IRAS 12 m galaxy catalog (Spinoglio et al., 2002), and IRAS bright galaxy catalog (Soifer et al., 1987; Carico et al., 1988). This band includes unique spectral features for finding “buried” AGNs, the 3.3 m PAH emission line and red continuum spectra originated from AGN torus emission. We perform detailed spectral fitting to these data by properly modeling the continuum and emission/absorption features. This enables us to decompose the continuum spectra into SB and AGN torus-dust components. The results are summarized as follows.
-
1.
Using the AGN diagnostics based on the torus-dust continuum ( K or erg s-1) and 3.3 m PAH emission strength (EW nm), we find that 14 out of the 22 infrared galaxies have buried AGNs. We confirm the trend that the buried AGN fraction increases with infrared luminosity: % for normal IRGs, % for LIRGs, and % for ULIRGs in our sample. This suggests that the presence buried AGNs is ubiquitous in U/LIRGs.
-
2.
The ratio decreases with infrared luminosity. This is opposed to the previous reports that have a constant value (Mouri et al., 1990; Imanishi, 2002). This decrease is possibly due to three effects: (1) destruction of PAH molecules by X-rays emitted from the AGN, (2) PAH destruction by merger processes, and (3) increase of AGN contribution to the total infrared luminosity.
-
3.
The energy contribution from the AGN torus-dust emission to the total infrared luminosity also increases with infrared luminosity, but it only reaches 7% in LIRGs and 20% even in ULIRGs. This suggests that majority of the total infrared luminosity in U/LIRGs originates from SB, not from AGN.
- 4.
-
5.
versus luminosity plot for our sample shows that infrared galaxies with buried AGNs are located above the luminosity correlation line derived from optically-selected Seyfert galaxies. We interpret that infrared galaxies could be an early phase of the evolutional track of AGNs.
References
- Alonso-Herrero et al. (2011) Alonso-Herrero, A., Ramos Almeida, C., Mason, R., et al. 2011, ApJ, 736, 82
- Alonso-Herrero et al. (2012) Alonso-Herrero, A., Pereira-Santaella, M., Rieke, G. H., & Rigopoulou, D. 2012, ApJ, 744, 2
- Antonucci (1993) Antonucci, R. 1993, ARA&A, 31, 473
- Asensio Ramos & Ramos Almeida (2009) Asensio Ramos, A., & Ramos Almeida, C. 2009, ApJ, 696, 2075
- Bauschlicher et al. (2009) Bauschlicher, C. W., Jr., Peeters, E., & Allamandola, L. J. 2009, ApJ, 697, 311
- Brightman & Nandra (2011) Brightman, M., & Nandra, K. 2011, MNRAS, 413, 1206
- Brightman & Ueda (2012) Brightman, M., & Ueda, Y. 2012, MNRAS, 423, 702
- Carico et al. (1988) Carico, D. P., Sanders, D. B., Soifer, B. T., et al. 1988, AJ, 95, 356
- Di Matteo et al. (2005) Di Matteo, T., Springel, V., & Hernquist, L. 2005, Nature, 433, 604
- Draine (1989) Draine, B. T. 1989, Infrared Spectroscopy in Astronomy, 290, 93
- Eguchi et al. (2009) Eguchi, S., Ueda, Y., Terashima, Y., Mushotzky, R., & Tueller, J. 2009, ApJ, 696, 1657
- Eguchi et al. (2011) Eguchi, S., Ueda, Y., Awaki, H., et al. 2011, ApJ, 729, 31
- Gandhi et al. (2009) Gandhi, P., Horst, H., Smette, A., et al. 2009, A&A, 502, 457
- Goto et al. (2010) Goto, T., Takagi, T., Matsuhara, H., et al. 2010, A&A, 514, A6
- Goto et al. (2011) Goto, T., Arnouts, S., Inami, H., et al. 2011, MNRAS, 410, 573
- Goulding et al. (2012) Goulding, A. D., Alexander, D. M., Bauer, F. E., et al. 2012, ApJ, 755, 5
- Hopkins et al. (2006) Hopkins, P. F., Hernquist, L., Cox, T. J., et al. 2006, ApJS, 163, 1
- Hopkins & Beacom (2006) Hopkins, A. M., & Beacom, J. F. 2006, ApJ, 651, 142
- Hunt et al. (2002) Hunt, L. K., Giovanardi, C., & Helou, G. 2002, A&A, 394, 873
- Ichikawa et al. (2012) Ichikawa, K., Ueda, Y., Terashima, Y., et al. 2012, ApJ, 754, 45
- Ichikawa et al. (2012b) Ichikawa, K., Ueda, Y., Terashima, Y., et al. 2012, Torus Workshop, 2012, 109
- Ikeda et al. (2009) Ikeda, S., Awaki, H., & Terashima, Y. 2009, ApJ, 692, 608
- Imanishi & Dudley (2000) Imanishi, M., & Dudley, C. C. 2000, ApJ, 545, 701
- Imanishi (2002) Imanishi, M. 2002, ApJ, 569, 44
- Imanishi & Maloney (2003) Imanishi, M., & Maloney, P. R. 2003, ApJ, 588, 165
- Imanishi et al. (2006) Imanishi, M., Dudley, C. C., & Maloney, P. R. 2006, ApJ, 637, 114
- Imanishi et al. (2008) Imanishi, M., Nakagawa, T., Ohyama, Y., et al. 2008, PASJ, 60, 489
- Imanishi et al. (2010) Imanishi, M., Nakagawa, T., Shirahata, M., Ohyama, Y., & Onaka, T. 2010, ApJ, 721, 1233
- Imanishi et al. (2011a) Imanishi, M., Ichikawa, K., Takeuchi, T., et al. 2011, PASJ, 63, 447
- Imanishi et al. (2011b) Imanishi, M., Imase, K., Oi, N., & Ichikawa, K. 2011, AJ, 141, 156
- Kishimoto et al. (2011) Kishimoto, M., Hönig, S. F., Antonucci, R., et al. 2011, A&A, 536, A78
- Klaas et al. (2001) Klaas, U., Haas, M., Müller, S. A. H., et al. 2001, A&A, 379, 823
- Krolik & Begelman (1986) Krolik, J. H., & Begelman, M. C. 1986, ApJ, 308, L55
- Lee et al. (2012) Lee, J. C., Hwang, H. S., Lee, M. G., Kim, M., & Lee, J. H. 2012, ApJ, 756, 95
- Le Floc’h et al. (2005) Le Floc’h, E., Papovich, C., Dole, H., et al. 2005, ApJ, 632, 169
- Lira et al. (2013) Lira, P., Videla, L., Wu, Y., et al. 2013, ApJ, 764, 159
- Lu et al. (2003) Lu, N., Helou, G., Werner, M. W., et al. 2003, ApJ, 588, 199
- Lutz et al. (1996) Lutz, D., Feuchtgruber, H., Genzel, R., et al. 1996, A&A, 315, L269
- Magnelli et al. (2011) Magnelli, B., Elbaz, D., Chary, R. R., et al. 2011, A&A, 528, A35
- Maiolino et al. (2003) Maiolino, R., Comastri, A., Gilli, R., et al. 2003, MNRAS, 344, L59
- Marchese et al. (2012) Marchese, E., Della Ceca, R., Caccianiga, A., et al. 2012, A&A, 539, A48
- Mihos & Hernquist (1996) Mihos, J. C., & Hernquist, L. 1996, ApJ, 464, 641
- Moorwood (1986) Moorwood, A. F. M. 1986, A&A, 166, 4
- Mouri et al. (1990) Mouri, H., Kawara, K., Taniguchi, Y., & Nishida, M. 1990, ApJ, 356, L39
- Mullaney et al. (2011) Mullaney, J. R., Alexander, D. M., Goulding, A. D., & Hickox, R. C. 2011, MNRAS, 414, 1082
- Murakami et al. (2007) Murakami, H., Baba, H., Barthel, P., et al. 2007, PASJ, 59, 369
- Murphy et al. (2011) Murphy, E. J., Chary, R.-R., Dickinson, M., et al. 2011, ApJ, 732, 126
- Nardini et al. (2008) Nardini, E., Risaliti, G., Salvati, M., et al. 2008, MNRAS, 385, L130
- Nardini et al. (2009) Nardini, E., Risaliti, G., Salvati, M., et al. 2009, MNRAS, 399, 1373
- Nardini et al. (2010) Nardini, E., Risaliti, G., Watabe, Y., Salvati, M., & Sani, E. 2010, MNRAS, 405, 2505
- Nenkova et al. (2002) Nenkova, M., Ivezić, Ž., & Elitzur, M. 2002, ApJ, 570, L9
- Nenkova et al. (2008a) Nenkova, M., Sirocky, M. M., Ivezić, Ž., & Elitzur, M. 2008, ApJ, 685, 147
- Nenkova et al. (2008b) Nenkova, M., Sirocky, M. M., Nikutta, R., Ivezić, Ž., & Elitzur, M. 2008, ApJ, 685, 160
- Netzer (2009) Netzer, H. 2009, MNRAS, 399, 1907
- Nishiyama et al. (2009) Nishiyama, S., Tamura, M., Hatano, H., et al. 2009, ApJ, 696, 1407
- Ohyama et al. (2007) Ohyama, Y., Onaka, T., Matsuhara, H., et al. 2007, PASJ, 59, 411
- Oi et al. (2010) Oi, N., Imanishi, M., & Imase, K. 2010, PASJ, 62, 1509
- Onaka et al. (2007) Onaka, T., Matsuhara, H., Wada, T., et al. 2007, PASJ, 59, 401
- Oyabu et al. (2011) Oyabu, S., Ishihara, D., Malkan, M., et al. 2011, A&A, 529, A122
- Petric et al. (2011) Petric, A. O., Armus, L., Howell, J., et al. 2011, ApJ, 730, 28
- Ramos Almeida et al. (2009) Ramos Almeida, C., Levenson, N. A., Rodríguez Espinosa, J. M., et al. 2009, ApJ, 702, 1127
- Ramos Almeida et al. (2011) Ramos Almeida, C., Levenson, N. A., Alonso-Herrero, A., et al. 2011, ApJ, 731, 92
- Risaliti et al. (2006) Risaliti, G., Maiolino, R., Marconi, A., et al. 2006, MNRAS, 365, 303
- Risaliti et al. (2010) Risaliti, G., Imanishi, M., & Sani, E. 2010, MNRAS, 401, 197
- Rush et al. (1993) Rush, B., Malkan, M. A., & Spinoglio, L. 1993, ApJS, 89, 1
- Sanders et al. (1988) Sanders, D. B., Soifer, B. T., Elias, J. H., et al. 1988, ApJ, 325, 74
- Sanders & Mirabel (1996) Sanders, D. B., & Mirabel, I. F. 1996, ARA&A, 34, 749
- Sanders & Ishida (2004) Sanders, D., & Ishida, C. 2004, The Neutral ISM in Starburst Galaxies, 320, 230
- Sani et al. (2008) Sani, E., Risaliti, G., Salvati, M., et al. 2008, ApJ, 675, 96
- Sawicki (2002) Sawicki, M. 2002, AJ, 124, 3050
- Siebenmorgen (1993) Siebenmorgen, R. 1993, ApJ, 408, 218
- Soifer et al. (1987) Soifer, B. T., Sanders, D. B., Madore, B. F., et al. 1987, ApJ, 320, 238
- Soifer et al. (2001) Soifer, B. T., Neugebauer, G., Matthews, K., et al. 2001, AJ, 122, 1213
- Spinoglio et al. (1995) Spinoglio, L., Malkan, M. A., Rush, B., Carrasco, L., & Recillas-Cruz, E. 1995, ApJ, 453, 616
- Spinoglio et al. (2002) Spinoglio, L., Andreani, P., & Malkan, M. A. 2002, ApJ, 572, 105
- Stalevski et al. (2012) Stalevski, M., Fritz, J., Baes, M., Nakos, T., & Popović, L. Č. 2012, MNRAS, 420, 2756
- Ueda et al. (2007) Ueda, Y., Eguchi, S., Terashima, Y., et al. 2007, ApJ, 664, L79
- Veilleux et al. (1995) Veilleux, S., Kim, D.-C., Sanders, D. B., Mazzarella, J. M., & Soifer, B. T. 1995, ApJS, 98, 171
- Veilleux et al. (1999) Veilleux, S., Kim, D.-C., & Sanders, D. B. 1999, ApJ, 522, 113
- Veilleux et al. (2002) Veilleux, S., Kim, D.-C., & Sanders, D. B. 2002, ApJS, 143, 315
- Veilleux et al. (2009) Veilleux, S., Rupke, D. S. N., Kim, D.-C., et al. 2009, ApJS, 182, 628
- Véron-Cetty & Véron (2006) Véron-Cetty, M.-P., & Véron, P. 2006, A&A, 455, 773
- Videla et al. (2013) Videla, L., Lira, P., Andrews, H., et al. 2013, ApJS, 204, 23
- Winter et al. (2009) Winter, L. M., Mushotzky, R. F., Reynolds, C. S., & Tueller, J. 2009, ApJ, 690, 1322
- Yamada et al. (2013) Yamada, R., Oyabu, S., Kaneda, H., et al. 2013, PASJ accepted, arXiv:1307.6356
- Yuan et al. (2010) Yuan, T.-T., Kewley, L. J., & Sanders, D. B. 2010, ApJ, 709, 884