Spectral Calibration in the Mid-Infrared: Challenges and Solutions
Abstract
We present spectra obtained with the Infrared Spectrograph (IRS) on the Spitzer Space Telescope of 33 K giants and 20 A dwarfs to assess their suitability as spectrophotometric standard stars. The K giants confirm previous findings that the strength of the SiO absorption band at 8 m increases for both later optical spectral classes and redder ()0 colors, but with considerable scatter. For K giants, the synthetic spectra underpredict the strengths of the molecular bands from SiO and OH. For these reasons, the assumed true spectra for K giants should be based on neither the assumption that molecular band strengths in the infrared can be predicted accurately from optical spectral class or color nor synthetric spectra. The OH bands in K giants grow stronger with cooler stellar temperatures, and they are stronger than predicted by synthetic spectra. As a group, A dwarfs are better behaved and more predictable than the K giants, but they are more likely to show red excesses from debris disks. No suitable A dwarfs were located in parts of the sky continuously observable from Spitzer, and with previous means of estimating the true spectra of K giants ruled out, it was necessary to use models of A dwarfs to calibrate spectra of K giants from observed spectral ratios of the two groups and then use the calibrated K giants as standards for the full database of infrared spectra from Spitzer. We also describe a lingering artifact that affects the spectra of faint blue sources at 24 m.
Subject headings:
infrared: stars1. Introduction
The Infrared Spectrograph (IRS, hou04) on the Spitzer Space Telescope (wer04) has produced a rich legacy of scientific results, due in large part to its unprecedented sensitivity. One of the few drawbacks of such a powerful telescope is that bright objects saturate the detectors, eliminating most well understood infrared standard stars from consideration as calibrators.
Spectral calibration generally proceeds with the following equation:
| (1) |
where all of the quantities are functions of wavelength. and are the observed and true spectra of the science target, respectively, and and are defined similarly for the calibrator (or standard star). The quantity is the assumed spectrum of the calibrator, referred to hereafter as its truth spectrum. For ground-based spectrometers, the calibration varies with atmospheric conditions, requiring spectra of the standard and science target to either be corrected for differences in atmospheric transmission or be obtained at similar airmasses and at roughly the same time.
For space-based missions there is no atmosphere, and the calibration is more stable. The problem then becomes one of determining a general spectral correction applicable as long as the responsivity of the instrument does not change. Previous satellite missions have defined a relative spectral response function which can be used to calibrate the spectra of science targets: .
Any errors in the assumed truth spectra of the standards will propagate as artifacts into the entire database of calibrated spectra. For calibration of an instrument on a space-based mission, the challenge is to choose proper standards and define good truth spectra. The improved sensitivity of each new mission has revealed that we have more to learn about the stars chosen as standards.
The calibration of the Infrared Astronomical Satellite (IRAS) is a good example of the challenges. The IRAS team quickly discovered that Lyr (A0 V), the primary photometric standard at all wavelengths, had an infrared excess beyond 20 m due to a circumstellar debris disk (aum84). Another surprise followed. coh92b showed that the original calibration of the Low-Resolution Spectrometer (LRS) on IRAS produced an emission artifact in all of the spectra, due to the standard assumption at the time that K giants had featureless continua in the infrared.
The problem of assuming correct truth spectra for standard stars remains fundamental to infrared spectroscopy, despite the two decades that have passed between the IRAS and Spitzer missions. For the IRS, this issue was particularly acute. To avoid the danger of saturation, a standard star for the low-resolution IRS modules needed to be fainter than 2 Jy at 12 m, which ruled out all of the previously calibrated standard stars. Thus, we had to start over with new standards.
The spectra calibrated by the Spitzer Science Center (SSC) met all pre-launch calibration requirements. This paper describes the effort by IRS team members at Cornell and the SSC to improve on that effort. It concentrates on the observational findings made as part of that effort, both to justify some of the decisions made and to guide the calibration of future infrared space telescopes. The sections below describe how we chose the standards for the IRS, determined their truth spectra, and analyzed the larger sample of candidate standards. The approach was iterative, with multiple definitions of truth spectra, tests, and improvements, making a linear presentation challenging.
In Section 2, we review methods used to estimate truth spectra of infrared standards before Spitzer launched. In Section 3, we describe how we chose candidate standards and how the calibration plan evolved during the Spitzer mission. Section 4 describes the observations, the Cornell data pipeline, and the construction of truth spectra and spectral corrections to calibrate all low-resolution IRS spectra. Section 5 examines actual coadded spectra for the standard stars observed most frequently and compares them to various truth spectra. A key finding is that our method does not propagate any identifiable artifacts into the IRS database. We also point out some of the shortcomings with traditional methods of estimating truth spectra. Section 6 focuses on the K giants, especially the SiO and OH absorption bands which must be properly accounted for if they are to be used as standards. Section 7 concentrates on the photometric properties of the standards, both K giants and A dwarfs. Section 8 focuses spectra of the A dwarfs, while Section 9 investigates the properties of the debris disks uncovered in our sample. Finally, Section 10 discusses our findings and draws some conclusions.
2. Truth spectra
2.1. Composite spectra
Prior to the work by coh92b, K giants were commonly used as standards, with the assumption that their spectra could be modeled with a 104 K Planck function. The high temperature of the assumed Planck function mimics the effect of the H- ion, which has an opacity that increases smoothly with wavelength, pushing the photosphere to cooler layers of the star at longer wavelengths. eng92 showed that a better fit to the continuum could be obtained with the Engelke function, which makes the brightness temperature of the star a smooth function of wavelength.
coh92b uncovered the presence of molecular absorption bands in the infrared spectra of late-type giants and documented their impact on the calibration of the IRAS spectra. To recalibrate the LRS database, coh92a started with A dwarfs, which can be modeled in a relatively straightforward manner. They based their calibration on Lyr (A0 V) and CMa (A1 V), relying on CMa beyond 20 m due to the red dust excess in the spectrum of Lyr. Kurucz models (kur79)111kur79 describes the technique, but the individual models have been distributed outside the refereed literature. These models assume plane-parallel geometry and local thermodynamic equilibrium, as explained in more detail in his Sec. IV (b). of these two stars served as the truth spectra for the calibration of other bright infrared standards.
coh92b produced a continuous and fully calibrated spectrum of Tau (K5 III), primarily using CMa as the calibrator and its Kurucz model as the truth spectrum. They built a composite spectrum of Tau from spectral segments observed with a variety of ground- and space-based telescopes. They ensured photometric accuracy and continuity in the composite by pinning each spectral segment to infrared photometry. The resulting spectrum of Tau showed multiple molecular absorption bands from the overtone and fundamental modes in CO and SiO. coh92b also published corrections for the LRS database by comparing their new spectrum of Tau to the original LRS calibration.
coh95 followed up with additional composite spectra of Boo (K1.5 III) and four other giants, calibrated from Kurucz models of Lyr and CMa and the existing composite spectrum of Tau. These composite spectra then served as the calibrators for further composite spectra (coh96a; coh96b; coh03). Table 1 lists the 16 composite spectra produced using this method. These spectra have the advantage that the spectral features are as actually observed, based on spectral ratios with a fidelity that can be traced back to the original Kurucz models of Lyr and CMa.
| Standard | Spectral | Fν at 12 | Cohen et | Used for | SWS |
|---|---|---|---|---|---|
| Star | Type | m (Jy)aaPhotometry from the IRAS Point-Source Catalog (PSC; psc) and color corrected by dividing by 1.45 | al. Ref. | Template | UpdatebbShort-Wavelength Spectrometer; eng06. |
| Lyr | A0 V | 28.7 | 1992a | Y | |
| CMa | A1 V | 98.7 | 1992a | Y | |
| Cen | G2 V | 153.2 | 1996a | Y | |
| Gem | K0 III | 85.9 | 1995 | Y | Ycc Gem was not observed by the SWS; this spectrum was built from SWS observations of similar stars. |
| Boo | K1.5 III | 547.0 | 1995, 1996b | Y | Y |
| TrA | K2 III | 99.3 | 1996a | ||
| Hya | K3 II-III | 108.7 | 1995 | Y | |
| Car | K3 III | 169.7 | 1996a | ||
| UMi | K4 III | 110.6 | 2003 | Y | |
| Tau | K5 III | 482.6 | 1992b | Y | Y |
| Dra | K5 III | 107.0 | 1996b | Y | |
| And | M0 III | 197.7 | 1995 | Y | |
| UMa | M0 III | 69.6 | 1996b | Y | |
| Cet | M1.5 III | 161.9 | 1996b | Y | |
| Peg | M2.5 II-III | 267.1 | 1995 | Y | |
| Cru | M3.5 III | 596.8 | 1996b | Y |
2.2. Spectral templates
All of the sources in Table 1 are too bright for the mid-infrared calibration of the instruments on Spitzer. However, they can still serve as the basis for calibrating Spitzer through the process of spectral templating. Using the composite spectra of sources in Table 1 as prototypes, (coh99) created 422 spectral templates of fainter sources. Each templated spectrum is based on the composite spectrum of the bright standard with the same optical spectral class, after adjusting for differences in photometry and interstellar reddening. Sources with discrepant colors were excluded. The accuracy of the spectral template depends on the assumption that the infrared spectrum of a source can be accurately predicted from its optical spectral class. In preparation for the Spitzer mission, coh03 expanded the wavelength coverage of their templates using optical spectroscopy for shorter wavelengths and Engelke functions for longer wavelengths. The resulting products, called supertemplates, were planned as the basis of the calibration of the Infrared Array Camera (IRAC) on Spitzer. They are generated using the same methods and assumptions as the earlier templates.
The spectral templates suffer from two limitations. First, because they are based on the actual observations which make up the composite spectra, they contain some noise. This noise is a minor issue for photometric calibration, but can be more significant for spectroscopic calibration. Second, some stars of a given spectral type may not have identical spectra to their prototype. her02 found considerable variation in the strengths of the CO and SiO bands in the sample of late-type stars observed by the Short Wavelength Spectrometer (SWS) on the Infrared Space Observatory (ISO). Again, these variations affect spectroscopic calibration more than photometric calibration. The SWS sample contained a range of luminosity classes at most of the spectral classes examined, leaving open the possibility that variations in luminosity were responsible for the range of band strengths within each spectral class, but the size of the sample was too small to search for systematic trends.
2.3. Synthetic spectra
The calibration of the SWS relied on many of the standard stars in Table 1 (shi03; sch96), but with synthetic spectra used for the truth spectra at shorter wavelengths. The synthetic spectra are free from noise, which is strong enough in the composite spectra to propagate through the calibration and into the SWS database.
However, pri02 revealed that the synthetic spectra underestimated the strength of the SiO molecular band at 8 m, and that the difference between observed and truth spectrum could propagate as an emission artifact into the entire SWS database. The difficulty with synthetic spectra of K giants lies in the atmospheric models on which they are based. The molecular absorption bands arise in rarified and extended layers of the atmosphere that have resisted accurate modeling (D. Carbon, private communication, 2002). The errors in the modeled temperatures and densities as a function of radius lead to inaccurate profiles for the absorption bands (we return to this point in Section LABEL:s.oh).
Synthetic spectra of earlier-type stars, such as A dwarfs, are more reliable. The observational problem is that A dwarfs are relatively rare compared to K giants among bright infrared targets, making it less likely they are located in readily accessible parts of the sky. For Spitzer, no A dwarfs suitable as standards could be found in the continuous viewing zones.
3. The calibration plan
3.1. Choice of stellar classes for standards
When planning the spectral calibration of the IRS on Spitzer, we had to balance multiple challenges. K giants have two strong molecular absorption bands in the IRS wavelength range, the SiO fundamental at 8 m and the CO fundamental at 5 m. Using A dwarfs as calibrators would avoid these bands, but the hydrogen recombination lines in their spectra present their own problems. Any difference in the strength, position, or profile of these lines between the synthetic and observed spectra introduces narrow artifacts in the calibration. To match the line profiles in A dwarfs, one must convolve the synthetic spectrum with the correct unresolved line profile, which is both a function of wavelength and position in the slit. In addition, an offset of the position of the star in the dispersion direction (perpendicular to the long axis of the spectroscopic slit) will displace the lines in wavelength space.
Prior to the start of the Spitzer mission, we decided to use both the A dwarfs and K giants, using one group to mitigate for specific weaknesses in the other, since the K giants do not show atomic absorption lines in the infrared, and the A dwarfs do not show molecular absorption bands. We excluded M giants because of their deeper and more complex absorption bands and increased likelihood of variability. We did not consider solar analogues as potential standards because they are relatively uncommon and they are likely to show both molecular and atomic absorption features.
3.2. The sample of standard stars
| Adopted | HR | HD | HIP | RA | Dec. | Spectral Type | Fν at 12 | Observations | |||
|---|---|---|---|---|---|---|---|---|---|---|---|
| Name | (J2000) | Literature | ReferenceaaThe listed references are not meant to be complete. C02 = Cohen, M., private comm. (2002), E62 = egg62, H55 = hal55, MC1, 2, 4 are the Michigan catalogue, vol. 1, 2, and 4 (mss75; mss78; mss88), M50 = mp50, S60 = ste60, and Y61 = yos61. | ModifiedbbChanges are in bold; see Sec. LABEL:s.ksp. | m (Jy)ccPhotometry from the IRAS Faint-Source Catalog (FSC; fsc) and color corrected by dividing by 1.45, unless noted otherwise. | Total | Used | ||||
| HD 41371 | 41371 | 28420 | 06 00 07.71 | 64 18 36.0 | K0 III | MC1 | K0 | 0.372 | 1 | 1 | |
| HR 7042 | 7042 | 173398 | 91606 | 18 40 56.41 | 62 44 58.1 | K0 III | H55, E62 | K0 | 0.800 | 2 | 2 |
| HD 51211 | 51211 | 32813 | 06 50 25.27 | 69 59 10.6 | K0 III | MC1 | K0 | 0.476 | 2 | 2 | |
| HR 6606 | 6606 | 161178 | 86219 | 17 37 08.88 | 72 27 20.9 | G9 III | H55 | K0 | 1.143 | 64 | 36 |
| HR 6348 | 6348 | 154391 | 83289 | 17 01 16.93 | 60 38 55.5 | K1 III | H55 | K0 | 0.755 | 84 | 57 |
| HR 2712 | 2712 | 55151 | 34270 | 07 06 14.31 | 68 50 15.3 | K0 III | MC1 | K0 | 0.670 | 4 | 4 |
| HR 1815 | 1815 | 35798 | 24256 | 05 12 25.76 | 81 32 30.2 | K1 III | MC1 | K1 | 0.743 | 3 | 3 |
| HD 59239 | 59239 | 35809 | 07 23 06.83 | 70 38 11.8 | K1 III | MC1 | K1 | 0.574 | 5 | 5 | |
| HD 156061 | 156061 | 84494 | 17 16 27.69 | 25 18 19.6 | K1 III | MC4 | K1 | 0.534ddFrom the IRAS PSC and color corrected as the FSC data. | 2 | 2 | |
| HR 6790 | 6790 | 166207 | 88732 | 18 06 53.48 | 50 49 22.2 | K0 III | H55, E62 | K1 | 0.797 | 4 | 3 |
| HD 39567 | 39567 | 27436 | 05 48 35.14 | 65 10 06.6 | K2 III | MC1 | K1 | 0.315 | 2 | 1 | |
| HR 7341 | 7341 | 181597 | 94890 | 19 18 37.87 | 49 34 10.0 | K1 III | H55 | K1 | 0.996 | 74 | 29 |
| HD 52418 | 52418 | 33306 | 06 55 40.95 | 68 30 20.6 | K2 III | MC1 | K2 | 0.589 | 1 | 1 | |
| HD 130499 | 130499 | 72238 | 14 46 23.43 | 56 36 59.0 | K2 III | Y61 | K2 | 0.672 | 2 | 2 | |
| HD 39577 | 39577 | 27564 | 05 50 16.54 | 55 03 12.0 | K2 III | MC1 | K2 | 0.383 | 2 | 2 | |
| HD 115136 | 115136 | 64522 | 13 13 28.03 | 67 17 16.7 | K2 III | S60 | K2 | 0.815 | 3 | 3 | |
| HD 50160 | 50160 | 32396 | 06 45 49.77 | 70 31 21.6 | K2 III | MC1 | K2 | 0.361 | 4 | 4 | |
| HD 56241 | 56241 | 34381 | 07 07 42.68 | 76 02 57.2 | K3 III | MC1 | K3 | 0.551 | 5 | 5 | |
| HD 42701 | 42701 | 28970 | 06 06 50.55 | 67 17 00.0 | K3 III | MC1 | K3 | 1.121 | 2 | 2 | |
| HD 44104 | 44104 | 29820 | 06 16 48.05 | 54 37 01.2 | K3 III | MC1 | K3 | 0.493 | 2 | 1 | |
| HD 23593 | 23593 | 17329 | 03 42 34.46 | 64 11 43.1 | K3 III | MC1 | K3 | 0.738 | 2 | 2 | |
| HD 214873 | 214873 | 112021 | 22 41 25.65 | 12 13 47.8 | K2 III | MC4 | K3 | 1.132 | 1 | 1 | |
| HD 19241 | 19241 | 14188 | 03 02 55.91 | 60 47 51.9 | K5 III | MC1 | K4 | 0.859 | 3 | 3 | |
| HD 99754 | 99754 | 55981 | 11 28 23.34 | 23 49 36.1 | K4 III | MC4 | K4 | 0.753 | 2 | 2 | |
| HD 166780 | 166780 | 88877 | 18 08 38.85 | 57 58 46.9 | K5 III | M50 | K4 | 0.777 | 41 | 26 | |
| HD 214046 | 214046 | 111551 | 22 35 53.95 | 20 56 05.2 | K4 III | MC4 | K4 | 0.689 | 2 | 2 | |
| HD 38214 | 38214 | 26751 | 05 41 01.53 | 54 44 22.1 | K5 III | MC1 | K4 | 0.484 | 3 | 3 | |
| BD+62 1644 | 91691 | 18 41 52.39 | 62 57 41.2 | K3 III | C02 | K4 | 0.272 | 3 | 3 | ||
| HD 53561 | 53561 | 34258 | 07 06 05.03 | 13 59 08.8 | K5 III | M50 | K5 | 0.855ddFrom the IRAS PSC and color corrected as the FSC data. | 2 | 2 | |
| HD 15508 | 15508 | 11364 | 02 26 23.35 | 68 38 07.2 | K4 III | MC1 | K5 | 0.576 | 2 | 2 | |
| HD 173511 | 173511 | 91673 | 18 41 40.59 | 61 32 47.1 | K5 III | M50 | K5 | 0.814 | 132 | 84 | |
| HD 34517 | 34517 | 24559 | 05 16 10.06 | 41 14 57.2 | K5 III | MC2 | K5 | 1.247 | 3 | 3 | |
| HD 39608 | 39608 | 27516 | 05 49 36.46 | 60 40 34.7 | K5 III | MC1 | K5 | 1.001 | 1 | 1 | |
| Adopted | HR | HD | HIP | RA | Dec. | Spectral Type | Fν at 12 | Observations | ||
|---|---|---|---|---|---|---|---|---|---|---|
| Name | (J2000) | Literature | ReferenceaaThe listed references are not meant to be complete. B58 = bm58, B60 = bm60, C69 = cow69, E50 = egg50, E57 = egg57, E60 = egg60, E62 = egg62, E64 = eva64, G06 = gra06, J53 = jm53, L72 = lev72, M53 = mor53, MC1 and MC2 are the Michigan catalogue, vol. 1 and 2, (mss75; mss78), S54 = sle54, and V57 = dev57. For the two entries labelled “SIMBAD”, no further reference information about the spectral type could be found. | m (Jy)bbPhotometry from the IRAS FSC and color corrected by dividing by 1.45, unless noted otherwise. | Total | Used | ||||
| HR 1014 | 1014 | 20888 | 15353 | 03 17 59.07 | 66 55 36.7 | A3 V | E64, MC1 | 0.148 | 5 | 4 |
| Tau | 1251 | 25490 | 18907 | 04 03 09.38 | 05 59 21.5 | A1 V | S54, C69 | 0.783 | 2 | 2 |
| Dor | 2194 | 42525 | 28909 | 06 06 09.38 | 66 02 22.6 | A0 V | MC1 | 0.119 | 66 | 44 |
| HD 46190 | 46190 | 30760 | 06 27 48.62 | 62 08 59.7 | A0 V | MC1 | 0.077 | 1 | 1 | |
| 21 Lyn | 2818 | 58142 | 36145 | 07 26 42.85 | 49 12 41.5 | A1 IV | S54 | 0.386 | 3 | 3 |
| 26 UMa | 3799 | 82621 | 47006 | 09 34 49.43 | 52 03 05.3 | A2 V | M53, S54, E62 | 0.536 | 2 | 2 |
| HR 4138 | 4138 | 91375 | 51438 | 10 30 20.13 | 71 59 34.1 | A1 V | MC1 | 0.418 | 9 | 7 |
| Cen | 4802 | 109787 | 61622 | 12 37 42.16 | 48 32 28.7 | A2 V | L72, MC2 | 0.937 | 7 | 5 |
| Cen | 4933 | 113314 | 63724 | 13 03 33.31 | 49 31 38.2 | A0 V | B60, MC2 | 0.335 | 3 | 3 |
| HR 5467 | 5467 | 128998 | 71573 | 14 38 15.22 | 54 01 24.0 | A1 V | C69 | 0.115 | 49 | 38 |
| HR 5949 | 5949 | 143187 | 78017 | 15 55 49.62 | 58 54 42.4 | A0 V | C69 | 0.080 | 4 | 4 |
| UMi | 6789 | 166205 | 85822 | 17 32 13.00 | 86 35 11.3 | A1 V | S54, E60 | 0.539 | 43 | 33 |
| HD 163466 | 163466 | 87478 | 17 52 25.37 | 60 23 47.0 | A2 | SIMBAD | 0.090 | 48 | 34 | |
| HR 7018 | 7018 | 172728 | 91315 | 18 37 33.50 | 62 31 35.7 | A0 V | C69 | 0.134 | 27 | 18 |
| Tel | 7134 | 93148 | 175510 | 18 58 27.77 | 52 56 19.1 | B9 III | V57, B58 | 0.294 | 3 | 3 |
| HD 165459 | 165459 | 88349 | 18 02 30.74 | 58 37 38.2 | A2 | SIMBAD | 0.076 | 2 | 2 | |
| 29 Vul | 7891 | 196724 | 101865 | 20 38 31.34 | 21 12 04.3 | A0 V | S54, E62, C69 | 0.311 | 17 | 9 |
| Aqr | 7950 | 198001 | 102618 | 20 47 40.55 | 09 29 44.8 | A1 V | E50, J53, M53 | 0.906 | 3 | 3 |
| PsA | 8431 | 210049 | 109285 | 22 08 23.01 | 32 59 18.5 | A1.5 IVn | G06 | 0.460 | 3 | 3 |
| Lac | 8585 | 213558 | 111169 | 22 31 17.50 | 50 16 57.0 | A2 V | S54, E57 | 0.959ccFrom the IRAS PSC; and color-corrected like the FSC data. | 28 | 19 |
The sample of IRS standards was developed with multiple purposes in mind. Our primary goal was to observe a sufficient number to guarantee that after rejecting sources found to be inadequate for any reason, we still had enough sources to test the calibration for self-consistency. Second, we wanted to observe a statistically significant sample of stars of each spectral class, including A0 and A1 dwarfs and each subclass of K giant, in order to study how their spectral properties varied within each subclass and from one subclass to the next.
We selected several K giants in the continuous viewing zones (CVZs), so that they could be observed in repeated IRS campaigns and help diagnose any variations in instrumental responsivity. With no suitable A dwarfs in the CVZs, we chose A dwarfs positioned around the ecliptic so that one or more would always be available. To provide sufficient temporal coverage and to sample spectral subclasses, we selected 20 A dwarfs. Because of uncertainties in the spectral classes, our A dwarfs included sources from B9 to A3. We did not observe later subclasses because they were not included in the original set of composite spectra. To properly sample the K giants, we observed 5–6 of each subclass from K0 to K5, for a total of 33 K giants and 53 standards.222This count does not include some fainter sources added later in the mission to test linearity or brighter sources used for the high-resolution modules.
Candidate standards had to meet a number of criteria. First, they had to have a reliable spectral type, with both a spectral class and a luminosity class and with little or no disagreement among published sources. For K giants, we required a luminosity class of “III”, with no subtypes indicated, to see if we could reduce the scatter in band strengths observed by her02. Photometry at B, V, and in the 12 m IRAS filter had to agree with the colors expected for the star’s spectral class. The [12][25] IRAS color had to be consistent with a naked star and not indicate a possible debris disk. For most of the standards observed during the scientific verification phase of the mission,333In 2003 November and December, between in-orbit checkout and the beginning of normal operations. M. Cohen prepared spectral templates, using the methods described above. He fitted the templates to the available photometry, and some candidates were rejected at this stage.
3.3. Evolution of the plan
When Spitzer was launched, two plans were in place for a parallel calibration of the spectra, one using synthetic spectra and one using spectral templates. As described above, each has strengths and weaknesses. Cornell focused on the spectral templates, while the SSC focused on the synthetic spectra. The Cornell team settled on three stars which behaved as expected, were relatively bright, and yet still faint enough to observe with the IRS Red Peak-up (PU) sub-array, which gave us photometry simultaneously with our spectra: HR 6348, HD 166780, and HD 173511. All were in or close enough to the northern continuous viewing zone to be observable from Spitzer most of the time.
HR 6348 became our primary standard because it had the weakest fundamental SiO band of the three. The SiO bandhead lies at 7.5 m, right at the boundary of the two spectral orders in the Short-Low (SL) module, and choosing a standard with a weak band reduced any problems which might arise from inaccuracies in the band profile in our truth spectrum. 444The 1- pointing uncertainty of 04 could produce a shift in the dispersion direction as large as 0.013 m in SL1, which for HR 6348 would result in an apparent 0.1% artifact, due to an apparent shift between the actual bandhead and where it appeared in an observed spectrum. For HD 173511, which has a stronger SiO band, the effect would be 0.5% of the continuum, which is enough to be noticeable.
It soon became apparent that the spectral template for HR 6348 (and the other standards) was insufficient as a truth spectrum. The apparent structure between 6 and 8 m in the template for HR 6348 has a peak-to-peak amplitude of 3%, and this structure propagated from the template, which served as our initial truth spectrum to calibrate SL, to everything we calibrated with it. It was readily apparent in all IRS spectra with high signal/noise ratios (SNRs). This structure originated in noise in the spectra used to construct the composite spectrum of Gem, the prototype for the K0 spectral template.
We did not have synthetic spectra for HR 6348, HD 166780, or HD 173511, but the IRS spectra of standards which had been modeled, HR 6606 and HR 7341, confirmed our previous concerns about the ability of the synthetic spectra to accurately model the strength of the molecular absorption bands (see Section LABEL:s.stdk2). Thus neither the templates nor the synthetic spectra would serve as truth spectra.
Fortunately, the large sample of potential IRS standards included two reasonably well-behaved and repeatedly observed A dwarfs, Lac and UMi, putting us in a position to repeat the methodology of coh92b. Where they calibrated Tau from Lyr and CMa, we calibrated HR 6348 (K0 III) from Lac and UMi. We then used the spectrum of HR 6348 to calibrate HD 173511, and with these two, all of the low-resolution spectra from the IRS on Spitzer. The following sections show that this approach produces self-consistent results for all of the standard stars observed.
We started with Kurucz models of a generic A2 dwarf, scaled to the photometry for Lac and UMi. We estimate errors in the overall slope of the spectrum from differences between the assumed model and the actual stars by inferring blackbody temperatures from their colors and the temperature calibration of kh95. Across SL (i.e., 5–14 m), these errors would be less than 0.5%, and across the full spectral range (5–37 m), they would be 0.4% or less. As explained in Section 4.1, other systematic issues will dominate this error.
In order to calibrate HR 6348 with A dwarfs, we must mitigate for differences in the assumed and actual strengths and profiles of the hydrogen recombination lines in the A dwarfs, which will propagate to the spectrum of HR 6348. In our first attempt, we used polynomials to smooth the spectrum of HR 6348 in SL. In LL, we found that the shape of the spectrum was consistent with an Engelke function, but with structure due in part to noise and fringing. To remove these apparent artifacts, we replaced the LL spectrum with an Engelke function (eng92). Unfortunately, this step also removed real structure in the spectrum of HR 6348, primarily from OH bands in the 12–20 m range (see Section LABEL:s.oh). As a consequence, we finally decided to use the actual observed spectral ratios of HR 6348 to the A dwarfs at all wavelengths, mitigating for artifacts in the vicinity of recombination lines or from fringing only where these were clearly identifiable, as described in Section LABEL:s.truth.
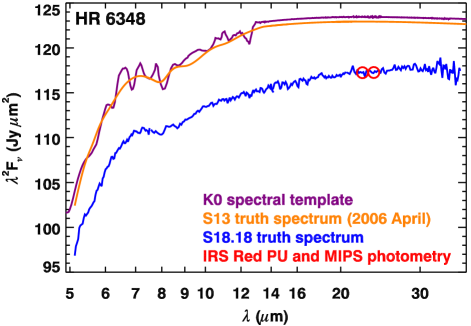
Concurrently with improvements in the quality of the truth spectra, we have also improved the photometric calibration of the spectra. Throughout, we have forced the spectra to be consistent with their Red PU photometry, but the PU calibration has changed. As described by sl11b, the Red PU calibration is now tied to the calibration of the 24 m photometry from the Multi-band Imaging Photometer for Spitzer (MIPS) for HR 6348, HD 166780, and HD 173511 (eng07), accounting for the difference in central wavelength (22.35 versus 23.675 m). We originally forced the three spectra to the mean of the delivered spectral templates, shifting each to account for the relative PU photometry, then later to the mean IRAS FSC photometry (fsc) for these three sources. However, this mean was 5% too high compared to the 24 m photometry, as shown in Figure 1. The 5% shift ties the current IRS calibration directly to the 24 m MIPS calibration (rie08).
4. Data
4.1. Observations
| Module | Usable Wavelength |
|---|---|
| & Order | Range (m) |
| SL2 | 5.10–7.53 |
| SL-bonus | 7.73–8.39 |
| SL1 | 7.53–14.20 |
| LL2 | 13.95–20.54 |
| LL-bonus | 19.28–21.23 |
| LL1 |