On the H i-Hole and AGB Stellar Population of the Sagittarius Dwarf Irregular Galaxy
Using two HST/ACS data-sets that are separated by years has allowed us to derive the relative proper-motion for the Sagittarius dwarf irregular (SagDIG) and reduce the heavy foreground Galactic contamination. The proper-motion decontaminated SagDIG catalog provides a much clearer view of the young red-supergiant and intermediate-age asymptotic giant branch populations. Previously identified carbon and oxygen-rich star samples, based on narrow-band filter photometry, were complemented with membership criteria. We report the identification of Milky Way carbon-rich dwarf stars, probably belonging to the thin disk, and pointing to the high incidence of this class at low Galactic latitudes. A sub-group of oxygen-rich candidate stars depicts a faint, red extension of the well-defined SagDIG carbon-rich sequence. The origin of these oxygen-rich candidate stars remains unclear, reflecting the uncertainty in the ratio of carbon/oxygen rich stars. Lastly, SagDIG is a gas-rich galaxy characterized by a single large cavity in the gas disk (H i-hole), which is offset by pc from the optical centre of the galaxy. We nonetheless investigate the stellar feedback hypothesis by comparing the proper-motion cleaned stellar populations within the H i-hole with appropriately selected comparison regions, having higher H i densities external to the hole. The comparison shows no significant differences. In particular, the centre of the H i-hole (and the comparison regions) lack stellar populations younger than Myr, which are otherwise abundant in the inner body of the galaxy. We conclude that there is no convincing evidence that the SagDIG H i-hole is the result of stellar feedback, and that gravitational and thermal instabilities in the gas are the most likely mechanism for its formation.
Key Words.:
galaxies: dwarf – galaxies: individual (SagDIG) – galaxies: ISM – ISM: structure — astrometry — stars: carbon — stars: AGB and post-AGB1 Introduction
Dwarf irregular galaxies (dIrr) have a crucial role in the ongoing effort to understand galaxy formation and evolution. Their relatively simple structure and isolated location facilitate the study of stellar evolutionary phases; in particular those related to star formation processes (Mateo 1998). Moreover, the interplay between star formation and the surrounding inter-stellar medium (ISM) is most evident in gas-rich dIrr. The dIrr of the Local Group ( Mpc) have a particular place in these studies, as they offer the unique possibility of investigating the interplay between the resolved stellar populations (whose average metallicity and age can be determined), the surrounding ISM, and star forming regions. The Sagittarius dwarf irregular galaxy (also known as SagDIG or UKS 1927-177) is an excellent prototype of a star-forming, gas-rich, low-metallicity galaxy, where such studies can be conducted.
Cook (1987; hereafter C87) provided the first CCD study of the resolved stellar populations of SagDIG, where the use of two intermediate passbands allowed him to disentangle between carbon and M-type stars. Later studies by Karachentsev et al. (1999) and Lee & Kim (2000) refined the distance modulus estimate and, at (), SagDIG was finally confirmed as a Local Group member. Interestingly, both studies agreed on SagDIG being the most metal-poor ([Fe/H]) star forming galaxy in the Local Group. Momany et al. (2002) advised that a differential reddening scenario (where young centrally-concentrated main-sequence stars suffer higher reddening with respect to the older and off-centre red giants) would revise the SagDIG photometric metallicity to [Fe/H], thus placing it within the general trend of the metallicity-luminosity relation for dIrr. This value was confirmed by Saviane et al. (2002) who derived an oxygen abundance of (O/H)=7.26 for the brightest H ii region in SagDIG.
A glimpse of the star formation history of SagDIG was revealed by the deep Hubble Space Telescope (HST) study by Momany et al. (2005). Color-magnitude diagrams reaching showed the presence of a conspicuous young ( Gyr) population of main-sequence and He-burning blue-loop stars. The identification of the red clump indicated the presence of intermediate ( Gyr) stellar populations, while that of a small but genuinely-old ( Gyr) red horizontal branch stars proved that SagDIG, just like any other dwarf galaxy, first started forming stars a Hubble time ago. Gullieuszik et al. (2008) conducted the first near-infrared study of SagDIG, and characterized the evolved asymptotic giants and red supergiant populations.
On the other hand, the spatial distribution of H i in gas-rich dwarf galaxies is usually clumpy, and single H i clouds ( pc) are found near (but do not typically coincide) with regions of active star formation and H ii complexes (Hodge et al. 1994;Young & Lo 1997; Hunter et al. 2012). On a larger scale, the H i observations of gas-rich dwarf galaxies reveal a wealth of structure in the ISM; some, but not all, have expanding shells (e.g., Holmberg ii; Rhode et al. 1999). Cavities in the ISM of gas-rich dwarfs are believed to originate from the combined effects of photo-ionization, stellar winds and supernovae explosions from the sequential formation of massive stars. There are factors that contribute to making cavities a long-lived feature in the ISM, namely (1) the slow solid-body rotation of the gas; (2) the low gas densities; (3) the reduced shear; and (4) the absence of spiral density waves (Stewart et al. 2000).
Young & Lo (1997) presented high resolution VLA observations showing that the SagDIG H i content extended significantly farther out than the stellar component. Without convincing signs of rotation, the H i gas seemed to be dominated by random motions. The SagDIG H i content was divided into broad ( km/s) and narrow ( km/s) components. The later is found in the form of small ( M⊙) clumps that are mainly in the galaxy centre, whereas the broad component showed a regular distribution all over the galaxy face. This two-component structure was interpreted as the analogue of the cold/warm phase structure of the Galactic H i. Young & Lo (1997) estimated the total H i mass of SagDIG to be M⊙, going up to M⊙ when including He. Thus, SagDIG seems to have maintained a large reservoir in the form of neutral gas. The H i is distributed in an almost symmetric ring surrounding a cavity (horse-shoe structure) that is, again, attributed to the combined effects of stellar winds and supernovae.
All together, the general properties of the resolved stellar populations, H i and H ii components of SagDIG are known. Nevertheless, SagDIG is projected relatively close to the Galactic centre () implying a strong foreground Galactic contamination, attributed to the Galactic thin and thick disk, the halo, and possibly the outskirts of the Galactic bulge. This is especially true for the red stellar populations of SagDIG [young red supergiants (RSG), intermediate-age carbon stars, and old asymptotic giant branch (AGB)] which are heavily confused by the Galactic foreground contamination, preventing (i) the reconstruction of the SagDIG star formation and chemical enrichment history; and (ii) the interplay between the H i distribution and the SagDIG stellar populations (in particular the red ones). For the above reasons HST second-epoch data were obtained, enabling a differential proper motion analysis of the SagDIG and foreground field populations. In this paper we present the results of the proper-motion decontamination process of our 2005 HST SagDIG catalog, which is made available in its entirety via the link to the machine-readable version.
2 Observations & Data Reduction
The first-epoch data set (GO P.I. Momany) consisted of HST orbits; dedicating one orbit to each of the , and filters. Five dithered exposures of seconds were obtained for each filter. The observations were concluded , August . The programmed second-epoch data set (GO P.I. Momany) consists of a single HST orbit dedicated to observations in the filter, in order to avoid possible filter-dependent systematic errors. The second-epoch data were also divided into exposures of seconds. These observations were concluded , June . The resultant epoch separation is years.
Following the general recipes given in Anderson & King (2000), and for deriving precise astrometric measurements and a more accurate assessment of the errors, we took particular care in designing the dithering pattern of our second-epoch images in terms of both integral and fractional-pixel offsets. We then measured the positions and fluxes for all detected stars in every exposure. For this task we used library effective Point-Spread-Functions and the software programs, all documented in Anderson & King (2006). We then generated a master list of all the stars, and collated all the observations for a given star. As in Bedin et al. (2003), we used the best distortion corrections available (Anderson 2002 and Anderson et al. 2006) to correct the raw positions measured from the exposures.
At first, we identified a group of SagDIG members in the color-magnitude diagram and these were adopted as reference stars. The coordinate transformations from a given image into the reference frame were derived using only these reference stars (see Bedin et al. 2003 for details). We thus ensured that the proper motion of all measured stars is relative to the bulk motion of the SagDIG members. This means that the relative motion of the SagDIG stars should, to within the measurement errors, be centred around zero. We then iteratively removed from the member list some stars that had field-star-type motions, even though their colors placed them near the fiducial SagDIG sequences.
Lastly, in order to minimize the influence of uncorrected distortion residuals on the transformations into the reference frame, local transformations based on the nearest well-measured SagDIG stars were used for all detected stars. Taking all these precautions into account, the position of stars with DN in their brightest pixel (in a given single image) proved to posses an error of of a pixel. We note that the relatively high background level in our single images ( DN), and the relative youth of the ACS/WFC detectors (at 2005), resulted in a negligible astrometric effect caused by charge-transfer efficiency problems.
3 Decontaminated Catalog
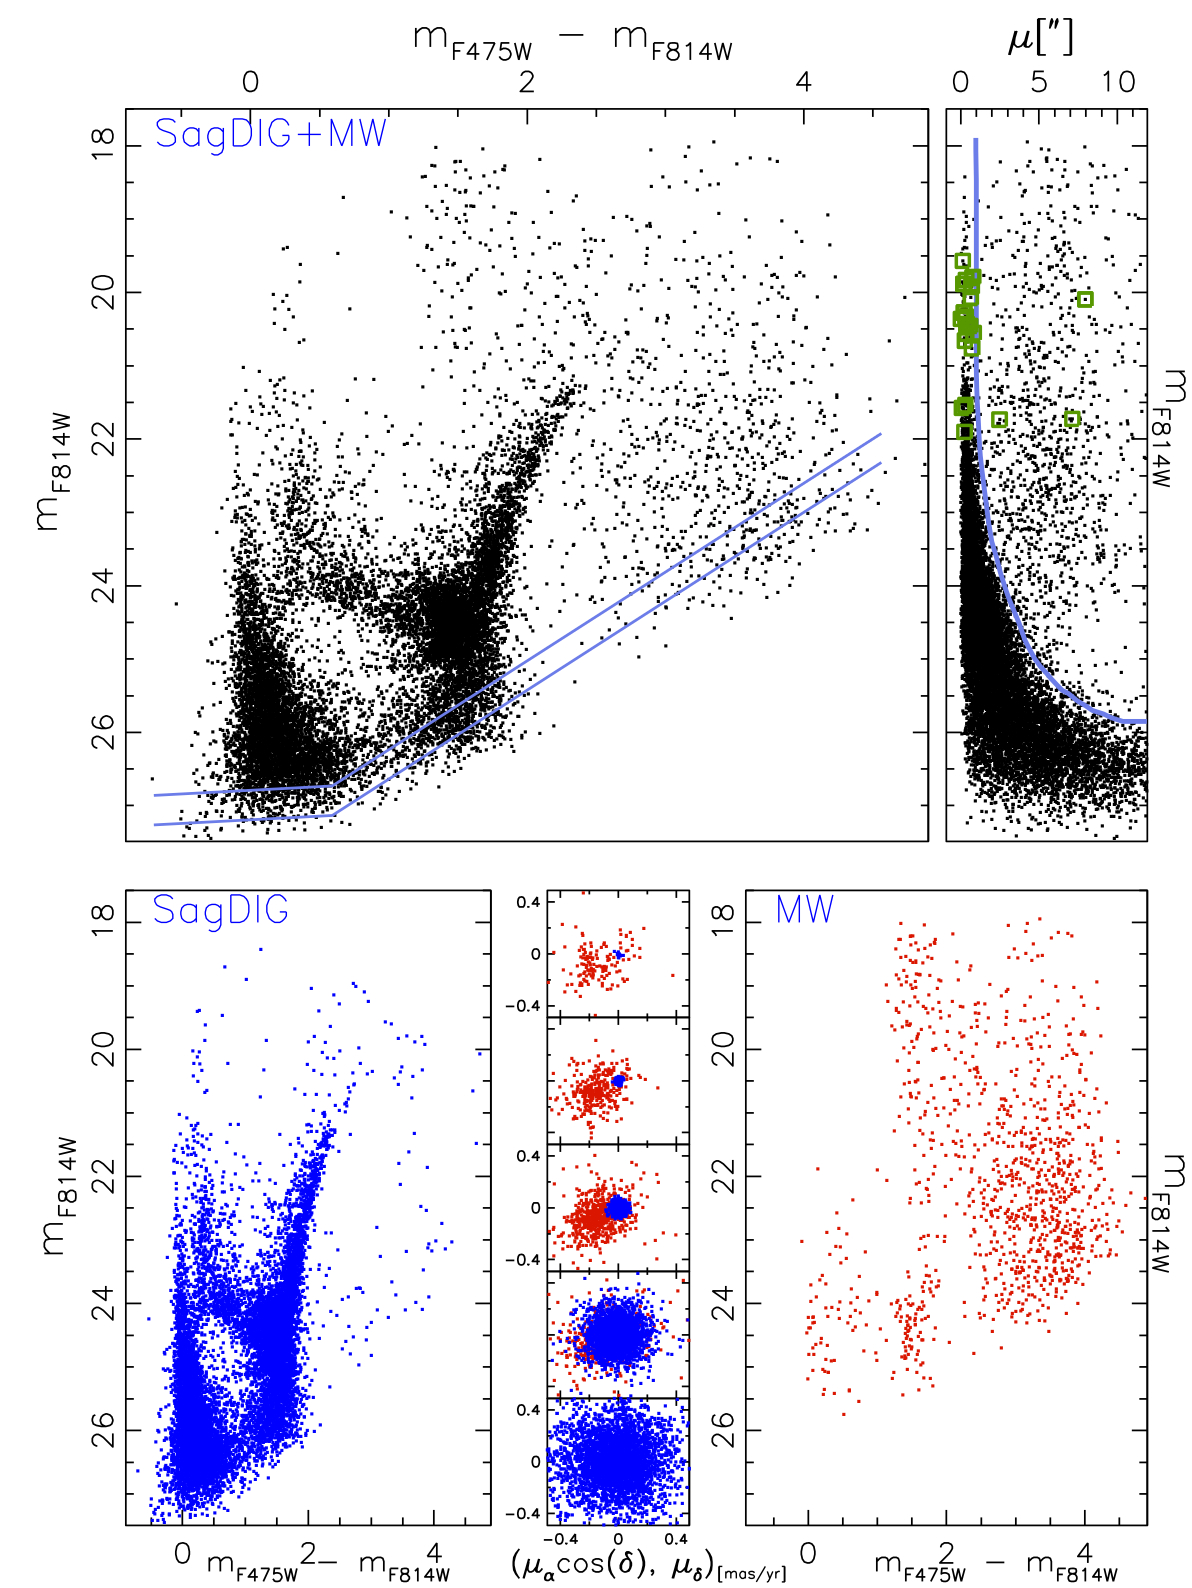
The results of this differential proper motion analysis are summarized in Fig. 1. The upper left panel displays the original Momany et al. (2005) composite () color-magnitude diagram towards SagDIG. The Galactic foreground contamination is visible as two broad vertical sequences at () and , in between which the SagDIG red giant branch, red clump and red supergiant population are recognizable thanks to their relatively higher stellar density. The young stellar population of SagDIG (composed of main sequence and blue supergiant stars) is mostly blue thus suffering negligible Galactic contamination. The upper right panel plots as a function of magnitude, which is the filter in common between the data sets of the 2 epochs. is expressed in milliarcseconds and is calculated as (where and are the derived offsets in pixels between the 2 epochs) normalized to the ACS pixel-scale and epoch separation . The distribution, especially for magnitudes brighter than shows a clear separation between the SagDIG stellar populations (having ) and those belonging to the Milky Way, showing a broader . In particular, and highlighted as open squares, the sample of Carbon stars (see next Section) shows a clear separation between SagDIG members and a group of 3 Galactic carbon stars.
For increasing astrometric uncertainties do not allow a clear-cut separation between the SagDIG and Milky Way populations. Following various experiments, we conservatively draw a separating line that maximizes the number of SagDIG members. A closer look at the upper panels shows that for and the star counts of these Galactic foreground dwarfs (mostly due to the thick disk population with little contribution by the thin disk and the Galactic halo populations) drop rapidly. This is solely due to the photometric incompleteness of our first-epoch data. The thick lines in the upper left diagram display the and completeness levels as derived from the artificial star experiments, presented in Momany et al. (2005).
The upper panels display the raw diagrams as a function of which was used for the differential proper motion analysis. The lower panels display the resultant cleaned diagrams, also as a function of . The lower middle panel displays an enlarged view on the vector-point diagrams, where each panel shows the distribution for bins of magnitudes starting The vector-point diagrams thus include the SagDIG (blue points) and Galactic (red points) populations. The lower left and right panels display the proper-motion decontaminated diagrams of the SagDIG and Milky Way population, respectively.
4 The SagDIG AGB Stellar Populations
Prior to our proper-motion decontamination, the disentangling of the SagDIG red stellar populations (being RSG, oxygen and carbon-rich AGB) was hindered by the foreground Galactic contamination. To a lesser extent, and thanks to their higher number density, RGB stars allowed earlier determination of the luminosity of the tip of the giant branch. In this section we address the properties of these unveiled populations, confident that the decontamination process allows a reliable membership down to at least (i.e. the red clump level).
Being brighter than the tip of the red giant branch, AGB stars are the first population to be detected in distant galaxies, and they have long been used (e.g. Letarte et al. 2002) to investigate the distribution of intermediate-age stellar populations. The Thermally Pulsating AGB evolutionary phase is characterized by mixing mechanisms that draw inner processed material to the outer stellar atmospheres. This alters the primary oxygen-rich composition and gives rise to carbon-rich stars (where the ratio of atoms is ). Iben & Renzini (1983) were the first to show that the conversion from rich to rich is facilitated at lower metallicities. Indeed, in metal-poor stars, with low abundance, less thermal pulses are required to produce . Overall, the number ratio of rich to rich stars allows one to infer the metallicity of a stellar population of a given age (Battinelli & Demers 2005a). However, the ratio is extremely sensitive to the star formation history, since the specific production of and rich stars is strongly dependent on the initial stellar mass. This is particularly true for intermediate-mass stars for which the production of TP-AGB have a well-pronounced maximum (see Girardi et al. 2013). Intermediate-mass stars are predominately rich and therefore, at a given metallicity, the ratio is expected to be higher in stellar systems with intermediate-age ( Gyr) stellar populations. Consequently, this “degeneracy” has to be accounted for when the ratio is used to probe the metallicity of stellar populations (Sibbons et al. 2012).
One of the most efficient methods to disentangle and classify and rich stars is based on the narrow-band photometry technique pioneered by Cook et al. (1986). The method relies on the use of a and filters that are respectively centred on molecular bands present in the spectra of rich and rich stars. However, although the color index is a powerful and rich separator, this technique cannot disentangle dwarf from giant stars. Consequently, when applied to select the AGB populations in nearby galaxies, control fields are used to estimate the Milky Way foreground contamination.
4.1 Carbon-rich Stars
Cook (1987) identified a sample of stars in SagDIG. Demers & Battinelli (2002) presented another sample of stars, of which were in common with the Cook sample. Of both samples stars were identified within our, relatively smaller, ACS@HST, field of view. Table1 presents the photometric properties of these stars along with coordinates and proper-motion displacement. Of particular interest is the identification of 3 stars whose displacement is consistent with a Galactic origin (c.f. upper right panel of Fig. 1).
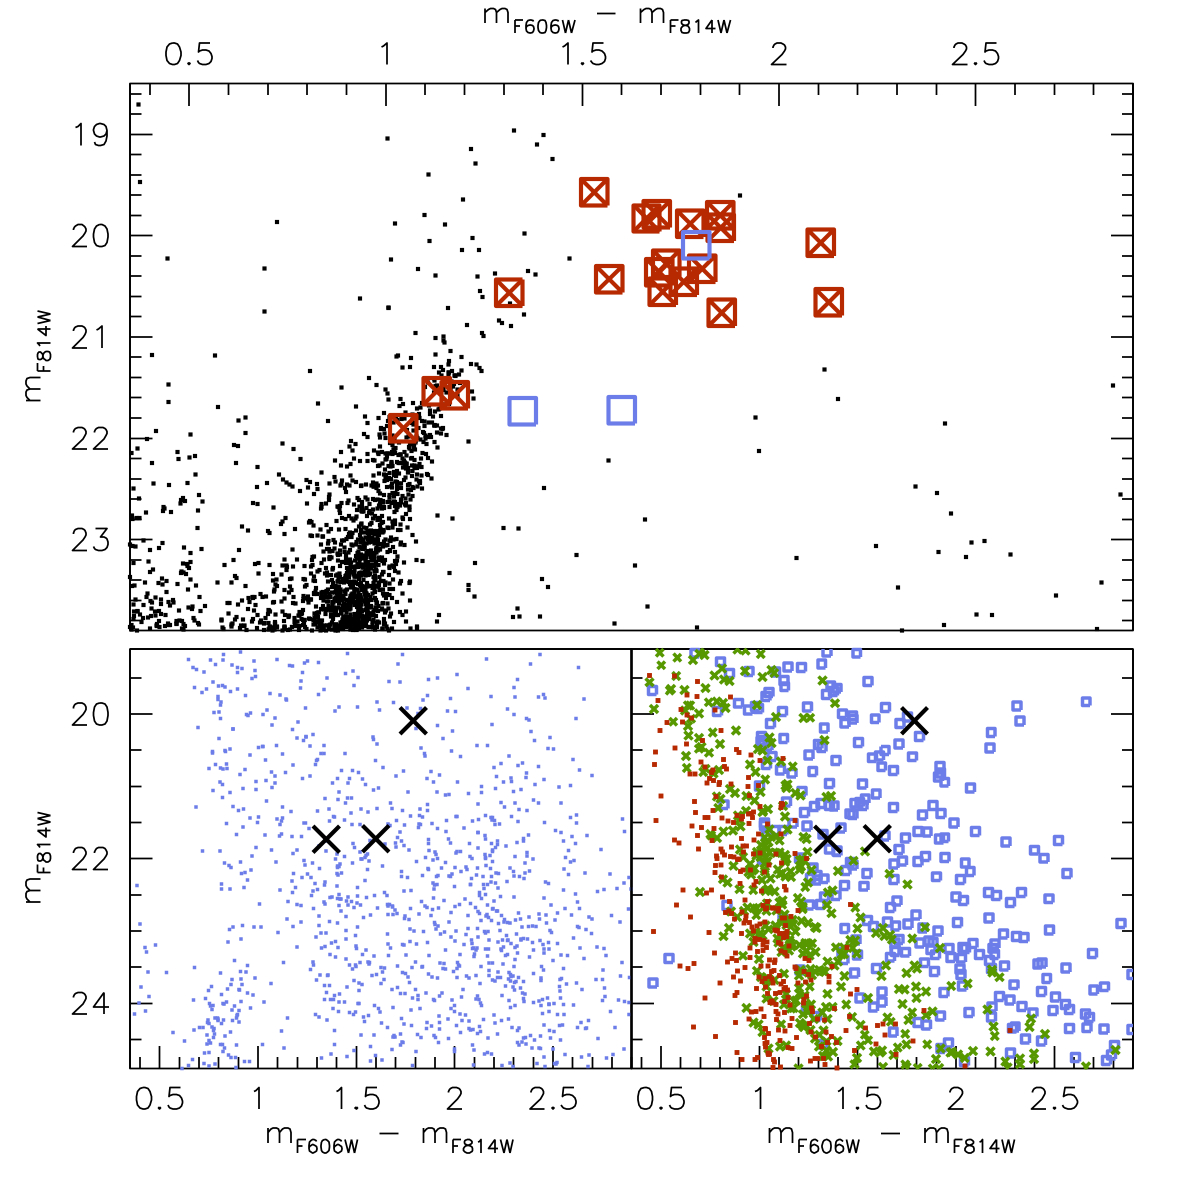
The upper panel of Fig. 2 shows the distribution of the stars in the decontaminated color-magnitude diagram. The majority of the SagDIG stars are around magnitude brighter than the tip of the red giant branch, and display redder colors. This is consistent with the star identification in near-infrared diagrams (Nikolaev & Weinberg, 2000) having , and confirmed in the near-infrared, SagDIG study of Gullieuszik et al. (2008). Battinelli & Demers (2005b) addressed the standard candle aspect of carbon stars and concluded that their average luminosity is viable as long as the parent galaxy contains some hundred stars or more. Indeed, their Fig. 3 shows that for large galaxies within the average carbon stars luminosity is basically constant at around . Instead, smaller galaxies (i.e. ) show a larger dispersion. In the case of SagDIG (for which we derive a ) the average of the carbon stars, that are redder than the RGB tip, is , in excellent agreement with the Battinelli & Demers (2005b) results. Our value is the result of transforming the magnitudes to Johnson Cousins systems and applying the reddening of and (as derived in Momany et al. 2005).
The upper panel of Fig. 2 also shows a group of confirmed stars clustering on the SagDIG red giant branch, just below the tip level. The identification of such faint, blue stars can be evidence of binary evolution, where the red giant has accumulated carbon-processed material from the primary component of the system, now an invisible and cooling white dwarf. In this regard, the faint and blue star giants simply reflect polluted atmospheres that were produced externally, as opposed to the AGB stars whose carbon enhancement is intrinsic to the star itself. Stellar evolutionary models can actually produce TP-AGB stars below the red giant branch tip level (Marigo et al. 2013). The very identification of such faint, blue stars would therefore indicate that the metallicity of the intermediate-age stellar populations of SagDIG is very low. This is not surprising, indeed Saviane et al. (2002) derive a metallicity of for the one and only H ii region in SagDIG.
The lower 2 panels of Fig. 2 address the possible origin of the Galactic stars. The left panel displays the Milky Way color-magnitude diagram as derived from the proper-motion decontamination process. We compare this observed diagram to a simulated diagram according to the Trilegal Milky Way model (Girardi et al. 2012) that includes thin and thick disk and halo components, all simulated in the HST/ACS photometric system. Relying solely on their position in the diagrams, the stars are consistent with being Milky Way thin disk dwarf stars. This is particularly interesting given the results from the Sloan Digital Sky Survey (Downes et al. 2004) and the Digitized First Byurakan Survey (Gigoyan et al. 2012) addressing the detection of high-latitude carbon stars. As reported in these studies, faint carbon stars were initially thought to be distant red giant branch stars. However, at least of the faint carbon stars detected by the Sloan survey displayed parallaxes and/or high proper-motions that are more appropriate for nearby, main-sequence stars. The relatively high proper-motion of our stars added to their position in the color-magnitude diagram all point to the first reliable detection of low-latitude Galactic carbon dwarfs, most probably belonging to the thin disk population.
4.2 Carbon/Oxygen Ratio
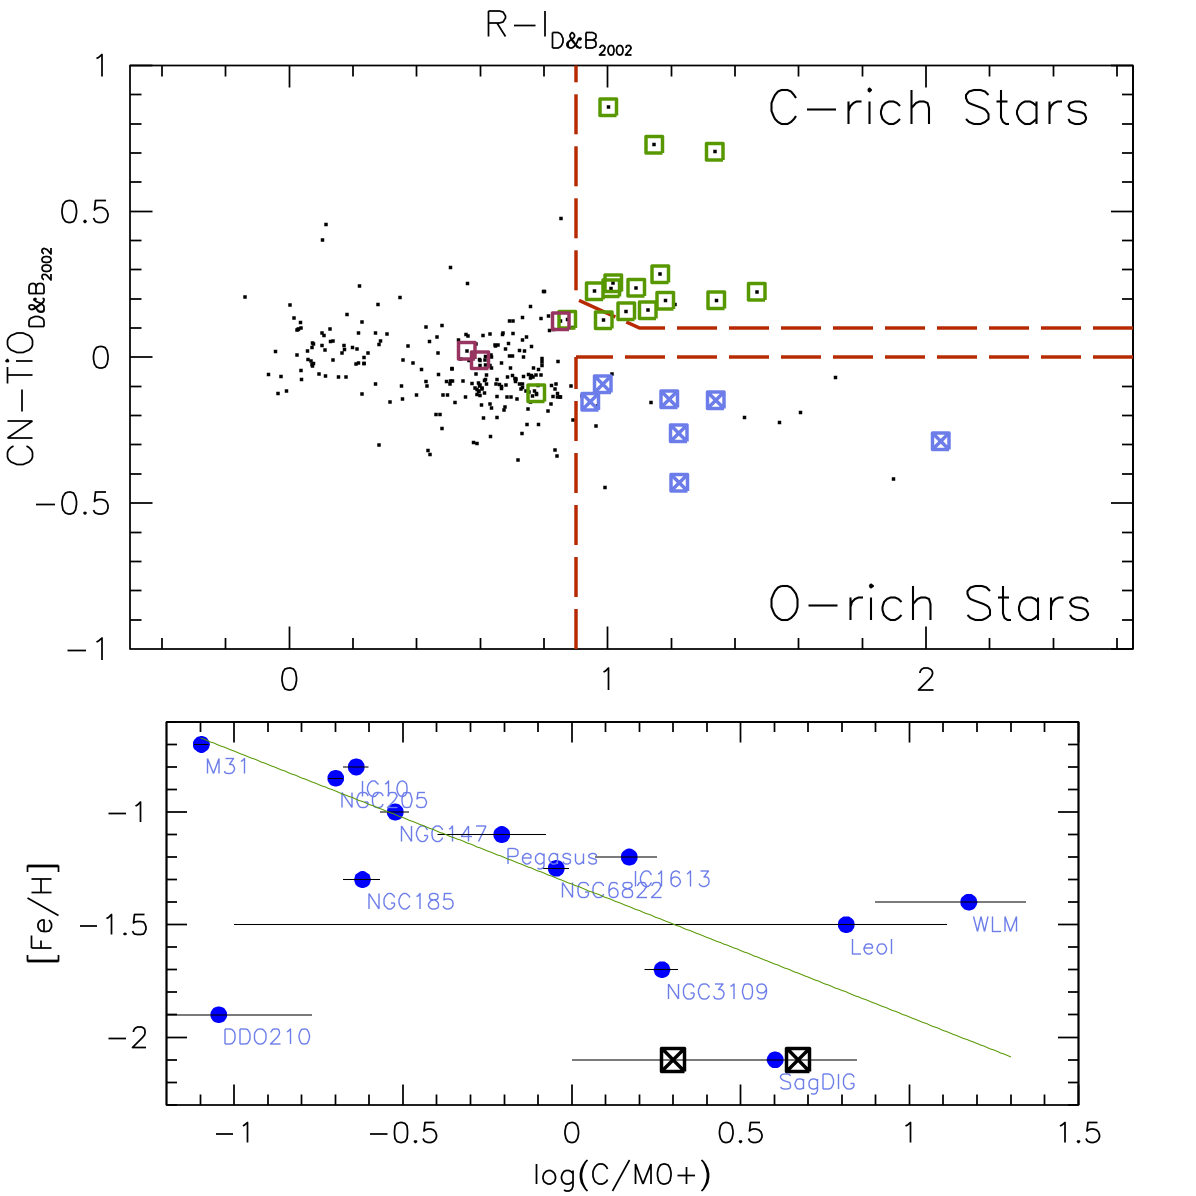
In this paper we adopt the star selection criterion following Battinelli & Demers (2005b), which refers to the selection of stars of spectral type and later, denoted as The two-color diagram (see upper panel of Fig. 3) guarantees, in principle, the identification of stars that are certain galaxy members. Indeed, the major difficulty with the derivation of the ratio resides in the selection of the oxygen-rich star sample that is foreground-contamination free. To this end, the foreground-contamination is usually estimated using control fields around the galaxy of interest. In this regard, our proper-motion decontamination process provides the first independent evaluation of the derivation process. Demers & Battinelli (2002) kindly provided us with their SagDIG filter catalog and this was matched to our SagDIG member catalog, the results of which are presented in the upper panel of Fig. 3. The identification of the stars is straightforward and shows the presence of a few stars111We note that the stars all belong to the Cook (1987) sample. falling outside the carbon-star selection box, and includes the carbon-stars falling on the red giant branch (dark-red open squares). To ensure the selection of AGB oxygen-stars, Battinelli & Demers (2005b) introduce another selection limit, that is, the adoption of for the AGB star bolometric magnitudes. We allow selection down to magnitude below the red giant branch tip, and overall count oxygen-rich stars, vs carbon-rich stars.
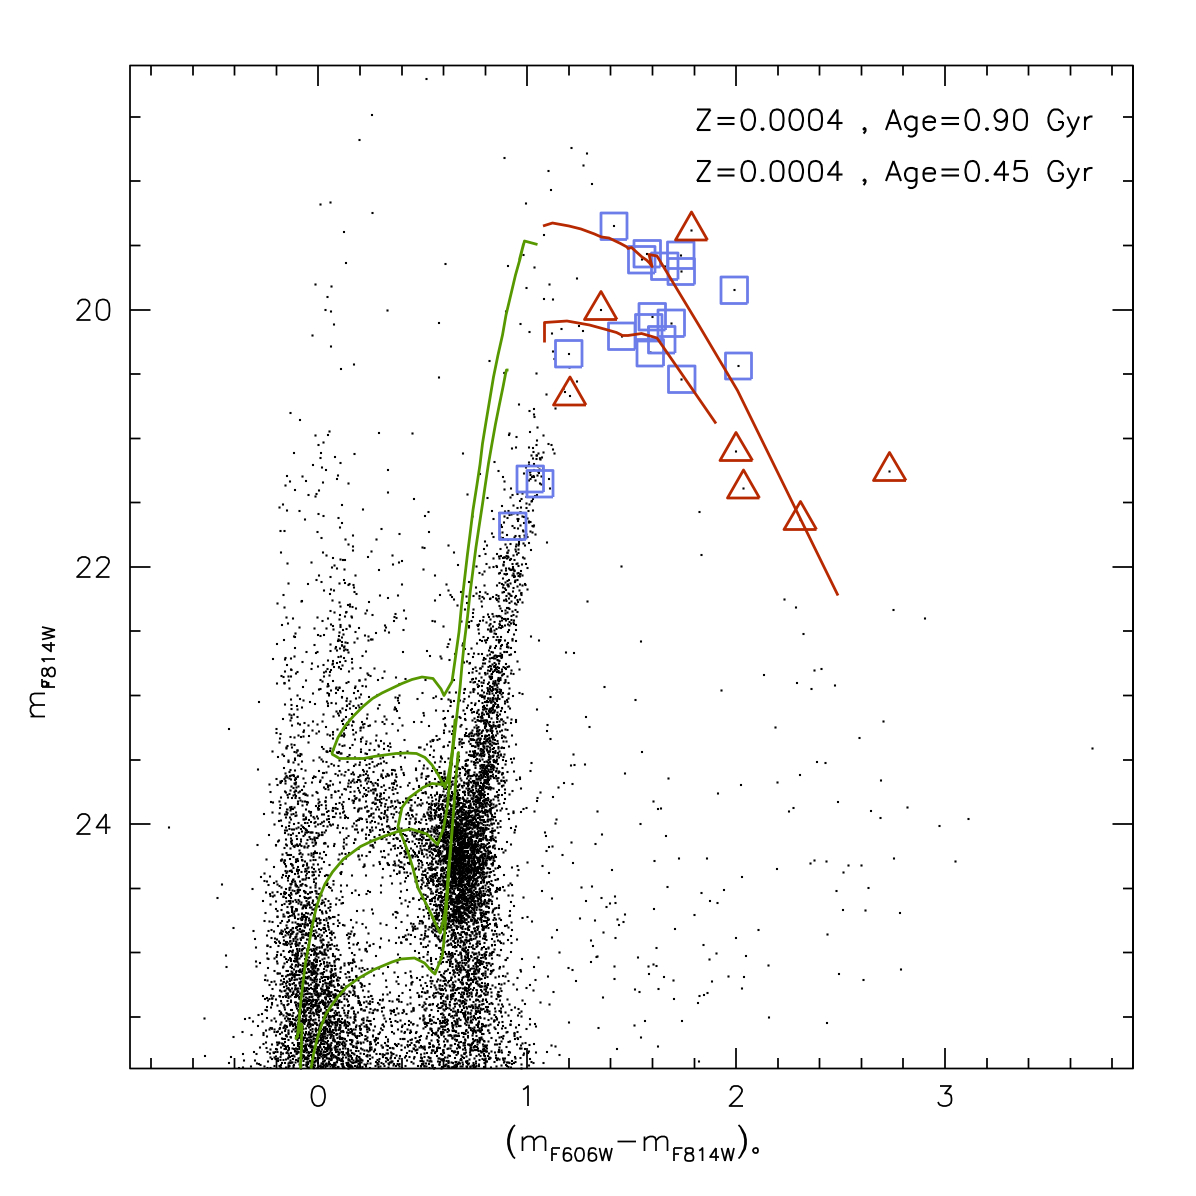
The identification of the oxygen-rich stars (open triangles in Fig. 4) warrants some attention. Indeed, of these are very red () and faint (with luminosities below the red giant branch tip level; ). Interestingly, the red/faint rich stars appear to lie on the redder/fainter elongation of the carbon star isochrones. This hints at the possibility that these are -rich, dust-enshrouded stars with high bolometric luminosity, and therefore one would expect them to be relatively bright at infrared wavelengths. To explore this possibility, we re-examined the SagDIG near-IR photometry from Gullieuszik et al. (2007). The red/faint rich stars have magnitudes that are fainter than the SagDIG RGB tip (at ), and colors that are typical of normal RGB stars. Furthermore, no AllWISE (Cutri et al. 2014) counterparts were found within of the centre of the rich stars. With the lack of strong emission at near (m) and mid-infrared ( and m) wavelengths, one is led to doubt that the red/faint rich candidate stars are genuine oxygen-rich stars.
On the other hand, they may have a genuine oxygen-rich origin if we postulate that these 4 stars need not to be massive. This possibility can be easily accommodated granted the fact that these rich candidate stars reside in a significantly metal-poor environment, a constraint that is easily met by the very low metallicity of SagDIG ([Fe/H] or ). Indeed, the analysis presented in Nanni et al. (2013) (describing the rich evolution during the thermal pulsating AGB) provides a framework within which the red/faint stars are conceived as genuine rich stars. In particular, their case-d scenario (for a relatively massive M⊙ and model star) shows how the transition from rich to rich takes place following the ignition of the Hot-Bottom-Burning process, where the efficiency of the CN cycle (depleting carbon) determines the transition to the rich spectral type.
Extrapolating the Nanni et al. (2013) case-d ( M⊙, and Gyr) scenario for the very low metallicity of SagDIG, would allow for the appearance of M⊙, and Gyr faint rich stars, along the extension of the rich stars (as seen in Fig. 4). Similarly, as also described in their case-e, the alternating effects of the third dredge-up (enhancing the production of carbon-rich stars) and Hot-Bottom-Burning (enhancing the oxygen-rich stars) would reflect in multiple transitions across , and rich stars can materialize along the extension of the red/faint rich tail. One last alternative scenario (permitting the presence of the red/faint rich stars) concerns the possibility that these are less-massive ( M⊙), older ( Gyr) AGB stars possessing intrinsically reddened colors. In conclusion, the origin of these red/faint oxygen-rich candidate stars remains uncertain, making them ideal targets for a spectroscopic follow-up.
The lower panel of Fig. 3 is a re-production of the Battinelli & Demers (2005b) []– anti-correlation for a sample of Local Group dwarf galaxies, where the straight line displays their least-square linear fit to the data. The squared-crosses delimit the newly derived SagDIG ratio including, or not, the rich red/faint stars. Overall, both values fall within the expected error of Battinelli & Demers (2005b), emphasizing the important role played by SagDIG (being the most-metal poor galaxy among the Local Group galaxies) in establishing the zero-point of the []– anti-correlation.
4.3 Isochrone Fitting of the Carbon Stars
The thermally pulsating AGB phase is certainly the most poorly understood evolutionary phase. Indeed, this phase includes complex processes such as the third-dredge up, Hot Bottom Burning, mass-loss through super winds and molecular opacity calculation that has defied reliable inclusion of this phase in many of the available isochrone libraries. The recent study by Marigo et al. (2008) has not only provided a detailed and improved treatment of the former mentioned processes, but also calibrated their final isochrone set to known observable properties of TP–AGB stars. In particular, their isochrones are offered in several photometric systems. We therefore employ their HST/ACS set of isochrones directly on our data, and cautiously attempt the derivation of the C-stars’ age and metallicity.
Figure 4 displays a set of isochrones from the Marigo et al. (2008) library upon the color-magnitude diagram, with stars highlighted as open squares. The bolometric corrections of Aringer et al. (2009), and a dust composition of Silicate for oxygen-rich stars, and and are applied. Following the recipes by Sirianni et al. (2005) and assuming a distance modulus of and , we adopt , , and . Figure 4 summarizes our effort to derive the stars’ age and metallicity. For relatively metal-poor isochrones (reasonable for the SagDIG metallicity) we find that and Gyr old isochrones best reproduce the colors and luminosities of the stars. This particular point will be further investigated (Held et al. in prep.) when reconstructing the star formation history of SagDIG.
5 The H i Hole
In Momany et al. (2005) we considered various possibilities for the formation of the large H i-hole in the South-West of SagDIG. In particular, we estimated whether the integrated luminosity of the stars within the hole was sufficient to represent the remnant population of a “cluster” whose massive stars created the hole via supernovae explosions and winds (i.e. stellar feedback). The conclusion was that although the integrated light over the entire area of the hole was sufficient to represent such a population, the spatial distribution of stars within the hole shows no concentration towards the centre of the H i-hole, and rather just displays a gradual increase of light intensity towards the optical centre of SagDIG. Therefore, no evidence was found of “any age-specific stellar population that is preferentially distributed within the H i-hole”. Unless supernovae are approximately two orders of magnitude more effective at imparting mechanical energy to the ISM than currently thought (so that the putative remnant stellar population in the hole could go undetected), the only hope left for the supernovae driven wind hypothesis is that the hole is actually a very “ancient structure” formed by the supernovae of a “cluster” of stars that has since faded so much that they were undetected by the HST data used in Momany et al. (2005). The HST data, now cleaned for Galactic foreground contamination, allow us to re-investigate this (“ancient structure”) possibility more rigorously, and thereby test our previous Momany et al. (2005) conclusions (which were based solely on the integrated light within the hole).
At first glance (c.f. Fig. 1) one might assume that the proper-motion decontamination process adds little to our previous examination, since the data set remains the same. In particular, the massive and young stellar populations of SagDIG are relatively bluer than the Galactic turnoff color of low-mass and old main-sequence stars, which (projected along the line of sight) form a loose and vertical sequence around . This is however true only for the SagDIG (Hydrogen-burning) main-sequence and (Helium-burning) blue-supergiant stellar populations which are relatively robust to Galactic foreground contamination. On the other hand, the red-supergiant and AGB populations (which run parallel to the main SagDIG red giant branch) are subject to foreground contamination by old Galactic main-sequence stars (having reached or approaching their turnoff level/colour). Figure 4 further illustrates this point: examining the Gyr () isochrone in between , one can appreciate how the red-supergiant population of SagDIG is outnumbered by the blue-supergiants. In particular, the red-supergiant and young AGB population have such low-frequency that their numbers can be easily veiled even by a low foreground contamination. Most importantly, the Gyr isochrone in Fig. 4 is a reminder of how the identification of a handful of red-supergiant and young AGB stars (proper-motion confirmed members) would allow us to trace older stellar clusters, within the hole. Indeed, the detection of a few red supergiant/AGB stars at would trace the presence of a “stellar cluster” with a turnoff level at (at the detection limit of our data). Thus, the proper-motion decontamination process provides a unique and un-biased Gyr look-back time for the H i-hole star formation history; tracing the remnant population of possible, past and defunct, clusters that might have provided a number of supernovae.
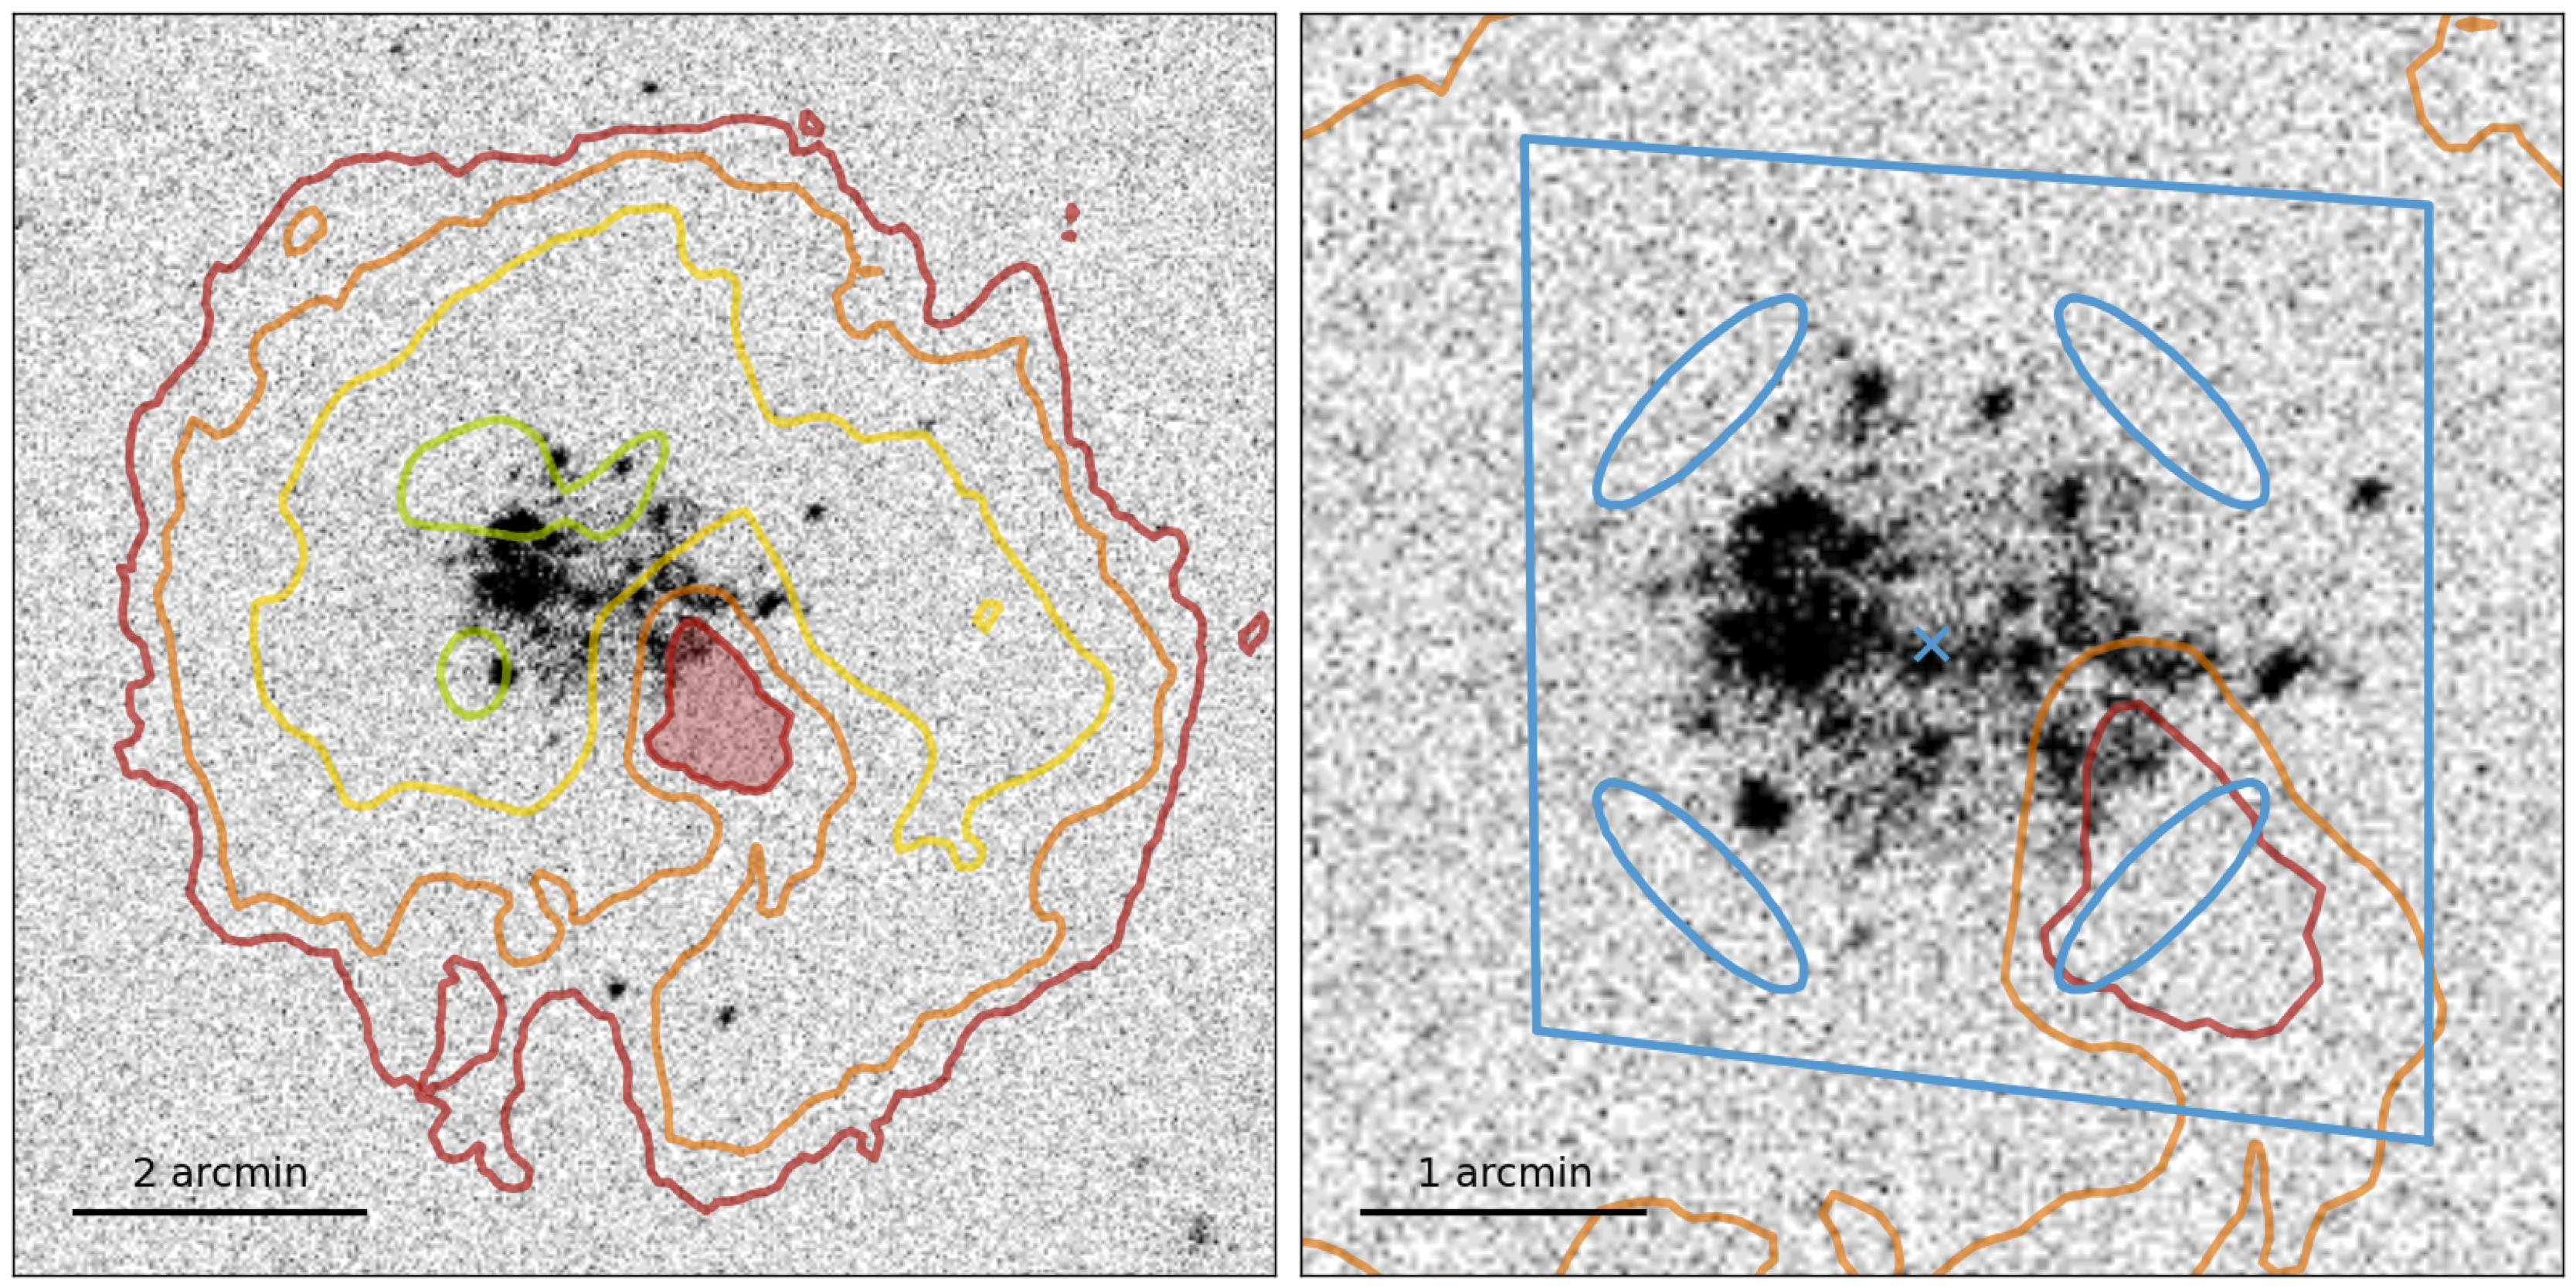
To guide us in our new analysis, addressing the star formation history within the H i-hole, we refer to Fig. 5 which displays the GALEX far-ultraviolet image of SagDIG upon which the Young & Lo (1997) H i contours are superimposed. Besides highlighting the highest density H i clumps and void (H i-hole), we also show the ACS footprint which emphasizes the full coverage of the H i-hole region. The SagDIG centre [(R.A.,Dec.) was derived as the median position of MS, BSG and RSG stars (of all ages) and is shown with a cross. To allow a direct comparison between the stellar populations present within the H i-hole and appropriate comparison fields, we select elliptical regions that are equidistant from the SagDIG centre. The South-Western (SW) elliptical region (i.e. H i-hole centre) will be compared with areas with (i) “moderate” H i content (i.e. North-Western region) and, most interestingly, (ii) high H i column density regions (North-Eastern and South-Eastern ellipses) 222The only known H ii region (Strobel et al. 1991) is at the rim of the South-Eastern H i clump..
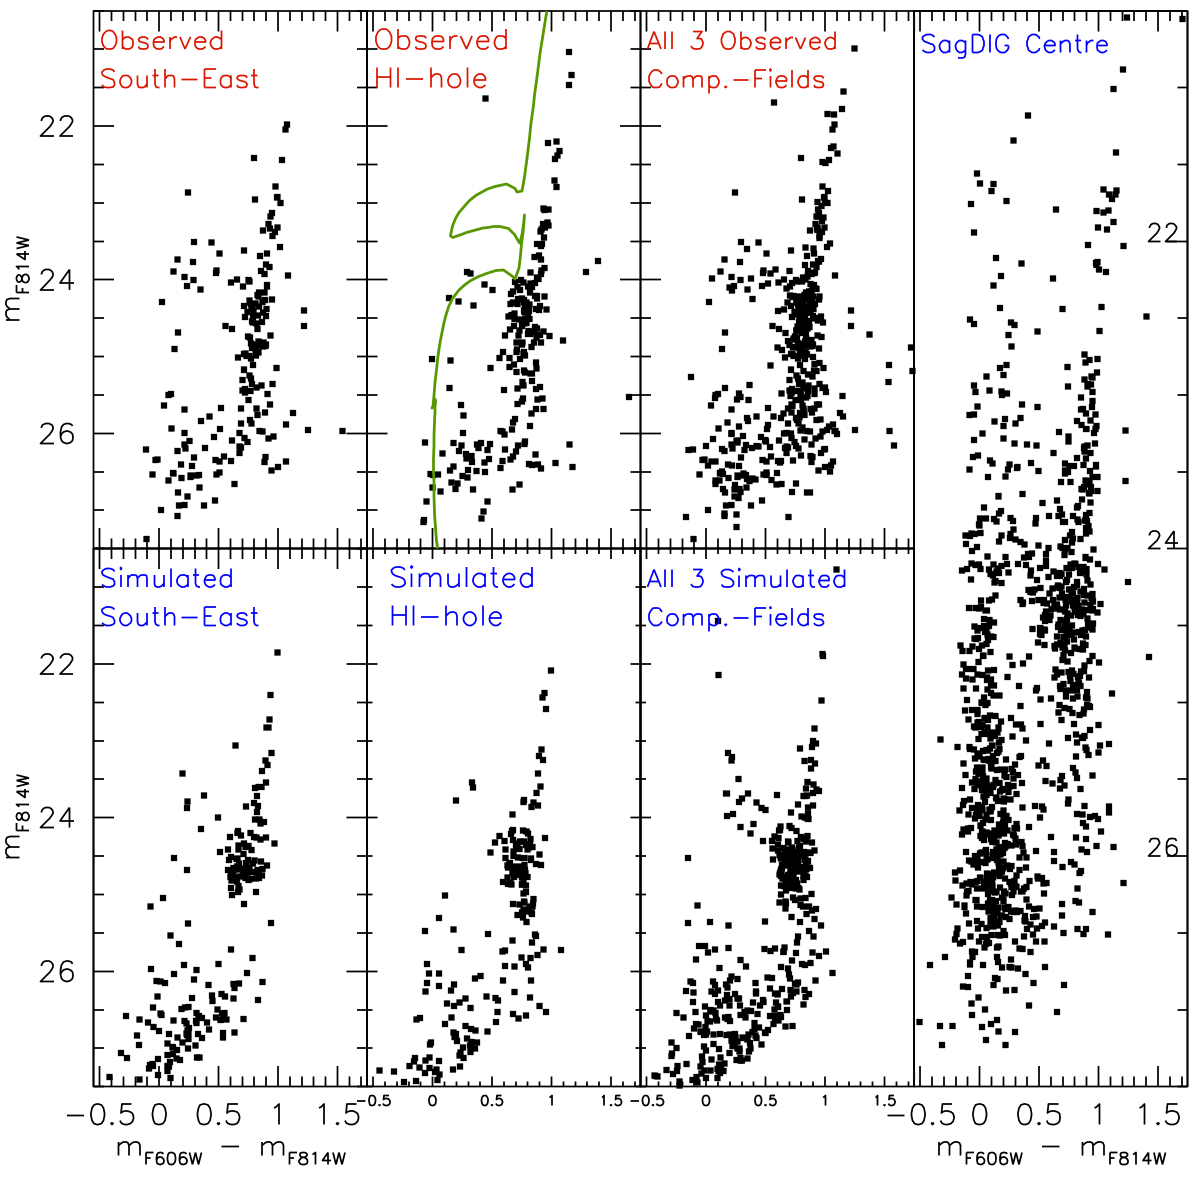
The upper panels of Fig. 6 display the observed and proper-motion decontaminated color magnitude diagram of the stellar populations present in the selected SE and SW (H i-hole centre) equivalent regions. To minimize the poor statistics of the color-magnitude diagrams in the SagDIG comparison fields, regions SE, NE, and NW have been merged together in order to infer a “global” star formation history of the comparison fields. We derived the star formation history (SFH) of the H i-hole and comparison fields by constructing synthetic color-magnitude diagrams (the lower panels) using the ZVAR simulator (G. Bertelli, priv. comm., which in turn is based on the uniform database of solar-scaled evolutionary tracks of Girardi et al. 2000) and comparing these to the observed color-magnitude diagrams using a maximum likelihood method. For these simulations we have adopted a simple metal-enrichment law with metallicity linearly (and monotonically) increasing from [Fe/H] (as suggested for the old stellar populations by our previous study Momany et al. 2005) to [Fe/H] (assuming for the youngest stars a metallicity similar to that of the H ii region in SagDIG [1/50 solar] by Saviane et al. 2002). The present simulations do not account for internal differential reddening (which probably affects the color of the young blue plume Momany et al. 2002), assume a standard power-law Initial Mass Function with in the interval between M⊙, a binary fraction of , and employ the photometric errors and incompleteness levels as derived from the artificial star simulations (see Momany et al. 2005).
Although the proper-motion decontaminated SagDIG catalog is photometrically complete down to , the selected stellar samples in the H i-hole and comparison fields are basically void of young stars brighter than . We emphasize that this “null-statistics regime” for stars brighter than the red clump level simply does not allow the reconstruction of the star-formation history in this time interval. In particular, stellar populations younger than Myr can be ruled out for both the H i-hole and the comparison fields (as evident from the over-plotted isochrones in Fig. 6). The shortage of young ( Myr) Hydrogen and Helium-burning stellar populations in the selected elliptical regions is however fully explained by their distance from the centre of SagDIG and star formation sites, which hosts abundant MS and BSG stellar populations. This is clearly illustrated in the right-most panel of Fig. 6 . A reconstruction of the recent ( Myr) star formation history of the centre of SagDIG and an assessment of the MS, BSG and RSG populations will be thoroughly analyzed in a dedicated paper (Held et al. to be submitted).
The good agreement between the observed and simulated diagrams for stars fainter than allows us to infer that the H i-hole and the comparison fields are similarly characterized by the onset of significant star formation between Myr ago, for stars basically populating the red clump. In conclusion, the comparison between observed and simulated diagrams provides a quantitative confirmation for the absence of (Hydrogen and Helium-burning) stellar populations younger than Myr which is greater than the estimated age of the SagDIG H i-hole ( Myr, Momany et al. 2005) and that in other dwarf galaxies (see Table 3 in Warren et al. 2011).
Young, Myr, OB associations have been traditionally (Weaver et al. 1977 and Brinks & Bajaja 1986) associated with H i-hole (shells/bubble) formation. The total absence of OB associations in the centre of the kpc diameter SagDIG H i-hole marks a distinctive difference with galaxies (e.g. Kim et al. 1999 and Hatzidimitriou et al. 2005 for the Magellanic Clouds and Weisz et al. 2009 for Holmberg ii) displaying multiple, small H i-holes; where OB associations were detected within H i-holes. However, the “classical” feedback theory (and the search for a single-age cluster) hardly provided a clear-cut, undisputed, one-to-one correspondence between the OB associations and the formation of H i-holes. Indeed, cases where H i-holes ( pc diameter and Myr) had no associated stellar component (at all) are not rare; reaching a frequency of in the case of the Small Magellanic Cloud (Hatzidimitriou et al. 2005). Moreover, the same study also established a factor of over-abundance of H i-holes that are not spatially correlated with an OB association compared to H i-holes that are, and surprisingly infer similar properties for both H i-hole groups.
Despite all the reported difficulties, the classical stellar feedback hypothesis remains appealing for the creation of H i-holes and shaping of the interstellar medium. Recently, a “fine-tuning” of this hypothesis has been investigated (e.g. Weisz et al. 2009, McQuinn et al. 2010, Warren et al. 2011, Cannon et al. 2011 and Cannon et al. 2012) because the search for a “single-age” stellar cluster within H i-holes (by means of estimated integrated light) has been proved rather an ambiguous concept given the diversity of stellar populations, of different ages, that are often detected within such H i-holes. In particular, allowing stellar feedback to include mixed-age stellar populations, there exists the possibility that the re-occurrence of multiple supernovae (spread over hundreds of Myr) may delay the cooling of the H i gas, extending the lifetime of the H i-hole to Gyr (Recchi & Hensler 2006). Evidence for this is found in the study of McQuinn et al. (2010), who reconstruct the star formation histories of dwarf galaxies and estimate that the duration of the starburst is indeed around Gyr for of the their sample. Of particular interest is the study of Warren et al. (2011) who present a detailed analysis of nearby dwarf irregulars whose H i morphology is dominated by a centrally-dominant hole. Following the re-construction of the star formation histories in the H i-holes for each of their galaxies, they then model and quantify the stellar feedback energy (chemical, spectrophotometric, and stellar energy evolution) and compare it with the estimated energy needed to create the H i-holes. Their results clearly show that the integrated stellar energy well exceeds that for the creation of the holes. Could stellar feedback from multiple age populations, extending to Gyr, save the supernovae hypothesis in SagDIG?
At the beginning of this section we emphasized how the proper-motion decontamination process would allow us to further explore the possibility that the H i-hole is an ancient structure, older than the traditionally assumed age ( Myr). Indeed, given the lack of a stellar population younger than Myr, we have focused our attention on the possible detection of a handful of bright () AGB/red supergiant stars (redder and distinguishable from the old red giant branch) that would trace the presence of a Gyr (now faded) cluster whose main-sequence turnoff level is magnitudes fainter. The H i-hole color-magnitude diagram shows no evidence of such stars. Moreover, the same trend is seen in the selected comparison fields, and one is led to conclude that the similarities between the stellar populations and star formation histories of the H i-hole and control fields all point to no direct correlation between the creation of the hole and the underlying recent ( Myr) stellar population. Cases in which stellar feedback (also extended to include multi-age stellar populations) would have provided the necessary energy to produce and maintain the H i-holes also (and always) infer (whenever control fields were available) that these are indistinguishable from those in the H i-holes. Regardless of energetic arguments, it will always be difficult to attribute a hole in the atomic gas disk to the energetic input from stars if the stellar population within the hole is indistinguishable from that outside it.
We therefore abandon the hypothesis that the large H i-hole in SagDIG is related to the stellar population. How then, can a large hole form in the H i disk, offset from the centre of the galaxy, in a region that has been largely quiescent for the last Myr ? The other possibilities considered in Momany et al. (2005) for its formation (top heavy IMF, much more efficient supernovae, presence of molecular gas, accreted ISM) were all found to be unlikely; but there is a further possibility not considered in that article. Wada et al. (2000) showed not only that kpc scale cavities can form in the ISM of dwarf galaxies such as the LMC (with almost solid body rotation) as a natural result of thermal and gravitational instabilities, but that the dispersive effect of supernovae explosions can actually inhibit the formation of large structures. Moreover, they found that although the small scale structure of the ISM was strongly influenced by star formation (supernovae), that a large-scale filamentary structure evolved even in models with no star formation at all. Such a process would allow the formation of a large H i-hole in SagDIG without the need to invoke stellar feedback via supernovae.
The star formation rate in SagDIG of M⊙ (Momany et al. 2005) implies a supernovae rate of approximately M⊙. This is times lower than that assumed for the LMC by Wada et al. (2000). Given that the -band luminosity of SagDIG is also approximately times lower than the LMC ( compared to ), the rate of energetic input per unit stellar mass, from supernovae into the ISM of the Sagittarius dwarf is similar to that in the LMC. The atomic gas mass of SagDIG, however, is only times less than that of the LMC, so the energetic input per unit atomic gas mass is actually an order of magnitude (factor of ) less than in the LMC. If the effect of supernovae is actually to disrupt the formation of large scale features in the gas, then SagDIG should represent a somewhat more favorable environment for the formation of large scale features in the ISM, such as filaments and voids.
Given the lack of evidence or any age stellar population which is preferentially distributed within the H i-hole, and the fact that SagDIG is very isolated (so that there is no obvious source from which gas may have been acquired externally) we conclude that the passive formation of a large cavity via gravitational and thermal instabilities seems to be the most likely scenario for the formation of the offset H i-hole in SagDIG.
If gas disks with little differential rotation, associated with very quiescent stellar systems, are the ideal environments for the formation and growth of filamentary structure via the intrinsic instability of the ISM, then it may help explain otherwise poorly understood atomic gas morphology in such systems. One such system may be the Phoenix dwarf galaxy. In this system the atomic gas is entirely concentrated in a curved cloud offset by pc to the west of the stellar population. In fact, if we were to remove the lowest 2 contours from the H i map of SagDIG it would look very similar to that of Phoenix. Young et al. (2007) suggest this offset H i is caused by supernovae winds (ram-pressure being excluded for lack of an extra-galactic medium) from an episode of star formation that took place Myr ago, but supernovae-driven winds tend to result in a symmetrical gas distribution, above and below the disk, in contrast to what is observed. A gas disk that tends to spontaneously form filamentary structure on large scales where the environment is sufficiently tranquil (appearing as ‘holes’ in maps with limited spatial resolution) may explain the enigma of these large holes.
The frequent lack of a stellar population that could be responsible for a given H i-hole has prompted Warren et al. (2011) to suggest that stars alone may not be the only driving force in the creation and maintenance of H i-holes, and that, “suitable local ISM conditions”, must also prevail. In particular, they note that star formation in the rims of the large H i-holes may regulate their formation. In this regard we emphasize that the SagDIG H i-hole, unlike most of those studied by Warren et al. (2011), is offset by pc from the optical centre of the galaxy, and any recent star formation episodes (c.f. Fig. 5). In the context of an intrinsic instability in the gas, it is likely that any correlation between the border of H i-holes and H ii regions (if present) is simply a result of star formation being promoted in regions of greater gas density; i.e. that gas morphology drives the star formation distribution and not the other way round.
6 Summary & Conclusions
A stellar proper-motion study (based on -epoch ACS@HST data-sets) has allowed us to disentangle the SagDIG stellar populations from the heavy Milky Way foreground contamination. The availability of cleaned SagDIG red stellar populations (being the young supergiants and intermediate-age asymptotic giant branch stars) permits an improved examination of the H i-hole, whose origin in gas-rich dwarf galaxies is usually assumed to be the result of supernovae explosions (e.g. van Dyk et al. 1998 and Stewart et al. 2000). Our analysis shows that the stellar populations within the H i-hole are very similar to those outside the hole, associated with dense H i-clumps. This clearly argues against the H i-hole being the result of supernovae explosions.
As shown previously (Momany et al. 2005), the stellar population now present within the hole is consistent with the number of past supernovae required to provide the kinetic energy to the ISM to form the hole. However, this falls very far short of being a sufficient condition for the supernovae hypothesis. Regardless of any energetic consideration, the lack of any distinguishing stellar population within the hole, when compared to regions outside the hole, argues very strongly against the hole being caused by energetic input from the stellar population (stellar winds and supernovae). We find the possibility that gas disks with solid-body rotation and low levels of star formation can form large-scale filamentary structure as a result of thermal and gravitational instability (Wada et al., 2000) to be an appealing alternative to the supernovae-driven wind hypothesis in SagDIG (and likely other similar objects).
As concerning the SagDIG carbon and oxygen-rich samples, previously identified via the narrow-band filter technique, these have been scrutinized by the proper-motion membership criterion. Of the original identified carbon stars, our analysis proves that of these are consistent with being Milky Way thin disk dwarf stars. A population of faint carbon dwarf stars was identified in high-latitude Sloan Digital Sky Survey fields by Downes et al. (2004), who estimated them to occur with a frequency of a single carbon dwarf per square degrees. Therefore, the identification of Milky Way carbon dwarfs in the SagDIG ACS@HST field of view (of only ), for latitudes of , is suggestive that the number density of Galactic carbon dwarfs is quite significant.
The proper-motion membership criterion also permits the identification of rich stars, of which display curiously red colors and faint luminosities. Although appealing, there is no evidence for the presence of oxygen-rich dust enshrouded stars, and indeed these SagDIG red/faint oxygen-rich stars do not show mid-infrared emission. Their presence however is a reminder of our poor understanding of the thermal pulsating AGB phase and the carbon to oxygen-rich transition. Overall, the SagDIG proper-motion based carbon/oxygen ratio is consistently within the Battinelli & Demers (2013) reported error. Being the most metal-poor galaxy in the Battinelli & Demers (2013) sample, SagDIG plays an important role in establishing the zero-point of the []– anti-correlation.
Acknowledgements.
We warmly thank the referee for his/her comments that greatly improved the presentation of this paper.References
- Anderson (2002) Anderson, J. 2002, in Astronomical Society of the Pacific Conference Series, Vol. 265, Omega Centauri, A Unique Window into Astrophysics, ed. F. van Leeuwen, J. D. Hughes, & G. Piotto, 87
- Anderson et al. (2006) Anderson, J., Bedin, L. R., Piotto, G., Yadav, R. S., & Bellini, A. 2006, A&A, 454, 1029
- Anderson & King (2000) Anderson, J. & King, I. R. 2000, PASP, 112, 1360
- Anderson & King (2006) —. 2006, PSFs, Photometry, and Astronomy for the ACS/WFC, Tech. rep.
- Aringer et al. (2009) Aringer, B., Girardi, L., Nowotny, W., Marigo, P., & Lederer, M. T. 2009, A&A, 503, 913
- Battinelli & Demers (2005a) Battinelli, P. & Demers, S. 2005a, A&A, 434, 657
- Battinelli & Demers (2005b) —. 2005b, A&A, 442, 159
- Battinelli & Demers (2013) —. 2013, A&A, 553, A93
- Bedin et al. (2003) Bedin, L. R., Piotto, G., King, I. R., & Anderson, J. 2003, AJ, 126, 247
- Brinks & Bajaja (1986) Brinks, E. & Bajaja, E. 1986, A&A, 169, 14
- Cannon et al. (2011) Cannon, J. M., Giovanelli, R., Haynes, M. P., Janowiecki, S., Parker, A., Salzer, J. J., Adams, E. A. K., Engstrom, E., Huang, S., McQuinn, K. B. W., Ott, J., Saintonge, A., Skillman, E. D., Allan, J., Erny, G., Fliss, P., & Smith, A. 2011, ApJ, 739, L22
- Cannon et al. (2012) Cannon, J. M., O’Leary, E. M., Weisz, D. R., Skillman, E. D., Dolphin, A. E., Bigiel, F., Cole, A. A., de Blok, W. J. G., & Walter, F. 2012, ApJ, 747, 122
- Cook (1987) Cook, K. H. 1987, PhD thesis, Arizona Univ., Tucson.
- Cook et al. (1986) Cook, K. H., Aaronson, M., & Norris, J. 1986, ApJ, 305, 634
- Cutri & et al. (2014) Cutri, R. M. & et al. 2014, VizieR Online Data Catalog, 2328, 0
- Demers & Battinelli (2002) Demers, S. & Battinelli, P. 2002, AJ, 123, 238
- Downes et al. (2004) Downes, R. A., Margon, B., Anderson, S. F., Harris, H. C., Knapp, G. R., Schroeder, J., Schneider, D. P., York, D. G., Pier, J. R., & Brinkmann, J. 2004, AJ, 127, 2838
- Gigoyan et al. (2012) Gigoyan, K. S., Russeil, D., Mickaelian, A. M., Sarkissian, A., & Avtandilyan, M. G. 2012, A&A, 544, A95
- Girardi et al. (2012) Girardi, L., Barbieri, M., Groenewegen, M. A. T., Marigo, P., Bressan, A., Rocha-Pinto, H. J., Santiago, B. X., Camargo, J. I. B., & da Costa, L. N. 2012, TRILEGAL, a TRIdimensional modeL of thE GALaxy: Status and Future, ed. A. Miglio, J. Montalbán, & A. Noels, 165
- Girardi et al. (2000) Girardi, L., Bressan, A., Bertelli, G., & Chiosi, C. 2000, A&AS, 141, 371
- Girardi et al. (2013) Girardi, L., Marigo, P., Bressan, A., & Rosenfield, P. 2013, ApJ, 777, 142
- Gullieuszik et al. (2008) Gullieuszik, M., Greggio, L., Held, E. V., Moretti, A., Arcidiacono, C., Bagnara, P., Baruffolo, A., Diolaiti, E., Falomo, R., Farinato, J., Lombini, M., Ragazzoni, R., Brast, R., Donaldson, R., Kolb, J., Marchetti, E., & Tordo, S. 2008, A&A, 483, L5
- Gullieuszik et al. (2007) Gullieuszik, M., Rejkuba, M., Cioni, M. R., Habing, H. J., & Held, E. V. 2007, A&A, 475, 467
- Hatzidimitriou et al. (2005) Hatzidimitriou, D., Stanimirovic, S., Maragoudaki, F., Staveley-Smith, L., Dapergolas, A., & Bratsolis, E. 2005, MNRAS, 360, 1171
- Held et al. (2010) Held, E. V., Gullieuszik, M., Rizzi, L., Girardi, L., Marigo, P., & Saviane, I. 2010, MNRAS, 404, 1475
- Hodge et al. (1994) Hodge, P., Strobel, N. V., & Kennicutt, R. C. 1994, PASP, 106, 309
- Hunter et al. (2012) Hunter, D. A., Ficut-Vicas, D., Ashley, T., et al. 2012, AJ, 144, 134
- Iben & Renzini (1983) Iben, Jr., I. & Renzini, A. 1983, ARA&A, 21, 271
- Karachentsev et al. (1999) Karachentsev, I., Aparicio, A., & Makarova, L. 1999, A&A, 352, 363
- Kim et al. (1999) Kim, S., Dopita, M. A., Staveley-Smith, L., & Bessell, M. S. 1999, AJ, 118, 2797
- Lee & Kim (2000) Lee, M. G. & Kim, S. C. 2000, AJ, 119, 777
- Letarte et al. (2002) Letarte, B., Demers, S., Battinelli, P., & Kunkel, W. E. 2002, AJ, 123, 832
- Marigo et al. (2013) Marigo, P., Bressan, A., Nanni, A., Girardi, L., & Pumo, M. L. 2013, MNRAS, 434, 488
- Marigo et al. (2008) Marigo, P., Girardi, L., Bressan, A., Groenewegen, M. A. T., Silva, L., & Granato, G. L. 2008, A&A, 482, 883
- Mateo (1998) Mateo, M. L. 1998, ARA&A, 36, 435
- McQuinn et al. (2010) McQuinn, K. B. W., Skillman, E. D., Cannon, J. M., Dalcanton, J., Dolphin, A., Hidalgo-Rodríguez, S., Holtzman, J., Stark, D., Weisz, D., & Williams, B. 2010, ApJ, 724, 49
- Momany et al. (2005) Momany, Y., Held, E. V., Saviane, I., Bedin, L. R., Gullieuszik, M., Clemens, M., Rizzi, L., Rich, M. R., & Kuijken, K. 2005, A&A, 439, 111
- Momany et al. (2002) Momany, Y., Held, E. V., Saviane, I., & Rizzi, L. 2002, A&A, 384, 393
- Nanni et al. (2013) Nanni, A., Bressan, A., Marigo, P., & Girardi, L. 2013, MNRAS, 434, 2390
- Nikolaev & Weinberg (2000) Nikolaev, S. & Weinberg, M. D. 2000, ApJ, 542, 804
- Recchi & Hensler (2006) Recchi, S. & Hensler, G. 2006, A&A, 445, L39
- Rhode et al. (1999) Rhode, K. L., Salzer, J. J., Westpfahl, D. J., & Radice, L. A. 1999, AJ, 118, 323
- Saviane et al. (2002) Saviane, I., Rizzi, L., Held, E. V., Bresolin, F., & Momany, Y. 2002, A&A, 390, 59
- Sibbons et al. (2012) Sibbons, L. F., Ryan, S. G., Cioni, M.-R. L., Irwin, M., & Napiwotzki, R. 2012, A&A, 540, A135
- Sirianni et al. (2005) Sirianni, M., Jee, M. J., Benítez, N., Blakeslee, J. P., Martel, A. R., Meurer, G., Clampin, M., De Marchi, G., Ford, H. C., Gilliland, R., Hartig, G. F., Illingworth, G. D., Mack, J., & McCann, W. J. 2005, PASP, 117, 1049
- Stewart et al. (2000) Stewart, S. G., Fanelli, M. N., Byrd, G. G., Hill, J. K., Westpfahl, D. J., Cheng, K.-P., O’Connell, R. W., Roberts, M. S., Neff, S. G., Smith, A. M., & Stecher, T. P. 2000, ApJ, 529, 201
- Strobel et al. (1991) Strobel, N. V., Hodge, P., & Kennicutt, Jr., R. C. 1991, ApJ, 383, 148
- van Dyk et al. (1998) van Dyk, S. D., Puche, D., & Wong, T. 1998, AJ, 116, 2341
- Wada et al. (2000) Wada, K., Spaans, M., & Kim, S. 2000, ApJ, 540, 797
- Warren et al. (2011) Warren, S. R., Weisz, D. R., Skillman, E. D., Cannon, J. M., Dalcanton, J. J., Dolphin, A. E., Kennicutt, Jr., R. C., Koribalski, B., Ott, J., Stilp, A. M., Van Dyk, S. D., Walter, F., & West, A. A. 2011, ApJ, 738, 10
- Weaver et al. (1977) Weaver, R., McCray, R., Castor, J., Shapiro, P., & Moore, R. 1977, ApJ, 218, 377
- Weisz et al. (2009) Weisz, D. R., Skillman, E. D., Cannon, J. M., Dolphin, A. E., Kennicutt, Jr., R. C., Lee, J., & Walter, F. 2009, ApJ, 704, 1538
- Young & Lo (1997) Young, L. M. & Lo, K. Y. 1997, ApJ, 490, 710
- Young et al. (2007) Young, L. M., Skillman, E. D., Weisz, D. R., & Dolphin, A. E. 2007, ApJ, 659, 331
| ID | R.A.J2000 | Dec.J2000 | Type | ||||||||||
|---|---|---|---|---|---|---|---|---|---|---|---|---|---|
| 1779 | 292.470424223 | –17.694280556 | 24.409 | 0.008 | 22.616 | 0.005 | 20.762 | 0.009 | 0. | 010 | –0. | 025 | carbon [B&D] |
| 8477 | 292.484743893 | –17.679781146 | 23.825 | 0.006 | 22.212 | 0.006 | 20.454 | 0.012 | 0. | 008 | –0. | 021 | carbon [B&D] |
| 11906 | 292.489788088 | –17.678259855 | 23.819 | 0.006 | 22.055 | 0.005 | 20.359 | 0.012 | –0. | 001 | 0. | 001 | carbon [B&D] |
| 22018 | 292.500279743 | –17.693105356 | 24.088 | 0.010 | 21.996 | 0.007 | 20.428 | 0.010 | 0. | 013 | –0. | 005 | carbon [B&D] |
| 28484 | 292.508378693 | –17.701596633 | 23.606 | 0.006 | 21.647 | 0.004 | 19.797 | 0.011 | 0. | 025 | –0. | 012 | carbon [B&D] |
| 28552 | 292.506976257 | –17.685159138 | 25.278 | 0.014 | 22.784 | 0.008 | 20.658 | 0.012 | 0. | 005 | –0. | 009 | carbon [B&D] |
| 36807 | 292.521527421 | –17.695199055 | 24.143 | 0.007 | 22.132 | 0.005 | 20.327 | 0.009 | 0. | 004 | –0. | 011 | carbon [B&D] |
| 35768 | 292.517402245 | –17.675026482 | 23.763 | 0.005 | 21.989 | 0.004 | 20.276 | 0.009 | –0. | 006 | –0. | 006 | carbon [Cook+B&D] |
| 26439 | 292.504205982 | –17.681264796 | 23.578 | 0.008 | 21.657 | 0.008 | 19.883 | 0.014 | 0. | 006 | –0. | 004 | carbon [Cook+B&D] |
| 23543 | 292.501195979 | –17.684096543 | 24.799 | 0.013 | 22.175 | 0.009 | 20.069 | 0.018 | 0. | 010 | –0. | 022 | carbon [Cook+B&D] |
| 2246 | 292.470442998 | –17.675733036 | 23.773 | 0.004 | 21.775 | 0.005 | 19.923 | 0.011 | 0. | 001 | -0. | 026 | carbon [Cook+B&D] |
| 36305 | 292.517750836 | –17.665476415 | 23.867 | 0.004 | 22.749 | 0.004 | 21.573 | 0.006 | –0. | 003 | 0. | 002 | carbon [Cook] |
| 29836 | 292.50700088 | –17.667797142 | 22.797 | 0.005 | 21.100 | 0.006 | 19.570 | 0.014 | 0. | 005 | –0. | 002 | carbon [Cook] |
| 26867 | 292.504035325 | –17.674187250 | 23.291 | 0.005 | 21.878 | 0.005 | 20.564 | 0.012 | 0. | 008 | –0. | 011 | carbon [Cook] |
| 23532 | 292.500977236 | –17.681787246 | 23.989 | 0.010 | 22.259 | 0.008 | 20.555 | 0.011 | 0. | 013 | -0. | 028 | carbon [Cook] |
| 22225 | 292.499001740 | –17.676113300 | 23.264 | 0.007 | 21.493 | 0.006 | 19.830 | 0.013 | 0. | 002 | –0. | 013 | carbon [Cook] |
| 15566 | 292.494754608 | –17.685898547 | 24.029 | 0.010 | 22.948 | 0.007 | 21.903 | 0.007 | 0. | 006 | 0. | 007 | carbon [Cook] |
| 6945 | 292.480575696 | –17.666244664 | 23.725 | 0.006 | 22.667 | 0.004 | 21.537 | 0.006 | 0. | 002 | –0. | 011 | carbon [Cook] |
| 6090 | 292.479789823 | –17.677937700 | 23.355 | 0.005 | 21.475 | 0.007 | 19.786 | 0.015 | 0. | 003 | -0. | 030 | carbon [Cook] |
| 2706 | 292.470758949 | –17.662969603 | 24.733 | 0.010 | 23.325 | 0.007 | 21.725 | 0.007 | –0. | 181 | –0. | 192 | Galactic carbon dwarf |
| 22924 | 292.499538712 | –17.673751215 | 24.461 | 0.008 | 23.082 | 0.006 | 21.734 | 0.007 | –0. | 086 | –0. | 033 | Galactic carbon dwarf |
| 6491 | 292.480173480 | –17.672926541 | 23.835 | 0.006 | 21.884 | 0.005 | 20.095 | 0.012 | 0. | 021 | –0. | 294 | Galactic carbon dwarf |
| 35304 | 292.517603956 | –17.688463174 | 23.502 | 0.006 | 22.209 | 0.005 | 20.890 | 0.006 | 0. | 003 | –0. | 006 | oxygen [B&D] |
| 36315 | 292.517452061 | –17.661983977 | 22.921 | 0.004 | 21.505 | 0.003 | 19.604 | 0.014 | 0. | 035 | –0. | 013 | oxygen [B&D] |
| 32223 | 292.512707052 | –17.698337255 | 25.005 | 0.009 | 23.437 | 0.006 | 21.322 | 0.006 | 0. | 016 | 0. | 011 | oxygen [B&D] |
| 24461 | 292.504056970 | –17.704380499 | 26.152 | 0.019 | 24.327 | 0.007 | 21.478 | 0.007 | 0. | 021 | –0. | 029 | oxygen [B&D] |
| 8170 | 292.482237066 | –17.658999926 | 23.050 | 0.006 | 21.691 | 0.007 | 20.224 | 0.010 | –0. | 011 | 0. | 008 | oxygen [B&D] |
| 3971 | 292.473941125 | –17.663168733 | 25.209 | 0.014 | 23.762 | 0.008 | 21.612 | 0.010 | –0. | 018 | –0. | 027 | oxygen [B&D] |
| 2577 | 292.470892782 | –17.668448303 | 25.747 | 0.011 | 24.278 | 0.009 | 21.856 | 0.006 | 0. | 007 | –0. | 025 | oxygen [B&D] |