11email: fabrizio@oa-teramo.inaf.it 22institutetext: INAF-Osservatorio Astronomico di Roma, Via Frascati 33, I-00040 Monte Porzio Catone (RM), Italy 33institutetext: Space Telescope Science Institute, 3700 San Martin Drive, Baltimore, MD 21218, USA 44institutetext: Dipartimento di Fisica e Astronomia, Università di Padova, Vicolo dell’Osservatorio 3, I-35122, Padova, Italy 55institutetext: INAF-Osservatorio Astronomico di Padova, Vicolo dell’Osservatorio 5, Padova, I-35122, Italy 66institutetext: INAF-Osservatorio Astronomico di Capodimonte, Salita Moiariello 16, I-80131, Napoli, Italy 77institutetext: INAF-Osservatorio Astronomico di Bologna, Via Ranzani 1, I-40127 Bologna, Italy 88institutetext: Dipartimento di Fisica, Università di Roma ”Tor Vergata”, Via della Ricerca Scientifica 1, I-00133 Roma, Italy 99institutetext: INAF-Osservatorio Astrofisico di Arcetri, Largo E. Fermi 5, I-50125 Firenze, Italy
A bag of tricks: Using proper motions of Galactic stars to identify the Hercules ultra-faint dwarf galaxy members ††thanks: Based on data acquired using the Large Binocular Telescope (LBT) at Mt. Graham, Arizona. The LBT is an international collaboration among institutions in the United States, Italy, and Germany. The LBT Corporation partners are: The University of Arizona on behalf of the Arizona university system; Istituto Nazionale di Astrofisica, Italy; LBT Beteiligungsgesellschaft, Germany, representing the Max-Planck Society, the Astrophysical Institute Potsdam, and Heidelberg University; The Ohio State University, and The Research Corporation, on behalf of The University of Notre Dame, University of Minnesota, and University of Virginia
Abstract
Context. Discovered in the last decade as overdensities of resolved stars, the ultra-faint dwarfs (UFDs) are among the least luminous, most dark-matter dominated, and most metal-poor galaxies known today. They appear as sparse, loose objects with high mass-to-light ratios. Hercules is the prototype of the UFD galaxies. To date, there are still no firm constraints on its total luminosity due to the difficulty of disentangling Hercules bona-fide stars from the severe Galactic field contamination.
Aims. To better constrain Hercules properties, we aim at removing foreground and background contaminants in the galaxy field using the proper motions of the Milky Way stars and the colour-colour diagram.
Methods. We have obtained images of Hercules in the , and bands with the Large Binocular Telescope (LBT) and LBC-BIN mode capabilities. The new dataset combined with data from the LBT archive span a time baseline of about 5 yr, allowing us to measure proper motions of stars in the Hercules direction for the first time. The data along with existing LBT photometry allowed us to use colour-colour diagram to further remove the field contamination.
Results. Thanks to a highly-accurate procedure to derive the -filter geometric distortion solution for the LBC-red, we were able to measure stellar relative proper motions to a precision of better than 5 mas yr-1 down to 22 mag and disentangle a significant fraction (90%) of Milky Way contaminants. We ended up with a sample of 528 sources distributed over a large portion of the galaxy body (0.12 deg2). Of these sources, 171 turned out to be background galaxies and additional foreground stars from the analysis of the vs. colour-colour diagram. This leaves us with a sample of 357 likely members of the Hercules UFD. We compared the cleaned colour-magnitude diagram (CMD) with evolutionary models and synthetic CMDs, confirming the presence in Hercules of an old population (122 Gyr) with wide spread metallicity ([Fe/H]).
Conclusions. Our procedure to estimate star proper motions proved to be a very effective way to identify likely members for stellar systems as far as 130 kpc. The present selection, based on both proper motions and colour-colour diagram, provides a robust identification of Hercules members and a new target list for more spectroscopic investigations.
Key Words.:
Methods: Observational – Proper motions – Galaxies: dwarf, Local Group – Galaxies: individual: Hercules UFD1 Introduction
In the last decade, the ultra-faint dwarf (UFD) galaxies discovered around the Milky Way (MW) and Andromeda spirals have provided new insight in our knowledge to the principles that govern galaxy formation processes. The UFDs show a number of remarkable differences with respect to the ”classical” dwarf spheroidal galaxies (dSphs). They are generally fainter than the previously known spheroidals with surface brightnesses typically less than 27 mag arcsec-2; thus, they are given the name ”ultra-faint dwarfs”. Although UFDs have dimensions comparable to those of the classical dSphs (the typical half-light radius is 100 pc), their absolute magnitude () is similar to that of the bulk of Galactic globular clusters (GGCs, mag), and some of them are even less luminous with absolute magnitudes as low as mag (see e.g. Clementini et al. 2012). All MW UFDs host an ancient population as old as about 10 Gyr and, with only very few exceptions (e.g. Clementini et al. 2012; Okamoto et al. 2012), their CMDs resemble those of metal-poor Galactic clusters (Belokurov et al. 2007; Brown et al. 2012) with no evidence for intermediate-age stellar generations, which are often observed among the classical dSphs instead (e.g. Monelli et al. 2003; Bellazzini et al. 2006). Measurements of the UFDs internal velocity dispersion reveal surprisingly high values ( km s-1) in comparison to the luminosity (e.g. Simon & Geha 2007; Walker et al. 2009). Therefore, in contrast to GGCs and even more so in classical dSphs, UFDs appear to be dark-matter dominated with mass-to-light ratios that can reach as large as M☉/L☉.

Dwarf spheroidal galaxies have long been thought to be candidate building-blocks in the hierarchical scenario of galaxy formation (e.g. Grebel 2005), where galaxies form via cooling and condensation of gas in dark-matter halos (White 1978). However, the role played by the classical dSphs in shaping the halos of their massive parent galaxies still remains quite controversial, a major issue being the small number of classical dSphs observed in the Local Group (LG). On the other hand, the number of UFDs has increased constantly in the last decade and completeness estimates suggest that many more of these faint satellites are still to be discovered in the LG (Tollerud et al. 2008). They may eventually fill the gap between observed number of satellites and number of relics predicted by the CDM models, the so-called ”missing satellite problem” (Moore et al. 1999; Klypin et al. 1999).
The Hercules UFD was discovered by Belokurov et al. (2007) from the analysis of Sloan Digital Sky Survey (SDSS) data. Literature estimates for its distance range from 132 kpc (e.g. Coleman et al. 2007) to 147 kpc (e.g. Adén et al. 2009a) with a value of 1326 kpc measured from the galaxy RR Lyrae stars (Musella et al. 2012). It has an absolute magnitude of 0.3 mag, which places the galaxy among the brightest MW UFDs, and a surface brightness of =27.20.6 mag arcsec-2 (Martin et al. 2008). Since the earliest ground-based observations, it was recognized that the galaxy CMD resembles that of an old and metal-poor GGC (102 Gyr and Z10-4, see e.g. Sand et al. 2009; Musella et al. 2012), as recently confirmed by Brown et al. (2012) with Hubble Space Telescope (HST) data. Martin et al. (2008) measured the galaxy half-light radius (=8.6′), and Sand et al. (2009) estimated the tidal radius (=35.25′). Hercules appears highly elongated with an ellipticity 0.65 (Coleman et al. 2007; Martin et al. 2008) and shows indications of a possible tidal disruption (e.g. Martin & Jin 2010). Deason et al. (2012) suggested that some hot horizontal branch (HB) stars once belonged to Hercules may have been tidally stripped and are now unbound. Thus, Hercules may not be a simple bound system in equilibrium (Adén et al. 2009a; Martin & Jin 2010; Deason et al. 2012). If so, its total mass cannot be gauged via measurement of the overall velocity dispersion and size (see e.g. Klimentowski et al. 2007; Łokas 2009), as the streaming of unbound stars could, in principle, inflate the observed mass-to-light ratio.
Unfortunately, the line of sight towards Hercules is heavily contaminated by external sources, making it hard to establish membership from the CMD alone (e.g. Musella et al. 2012). Hercules, as all UFDs, is a very loose stellar system (=1.710-2 M☉ pc-3, Walker et al. 2009); hence, background galaxies constitute a severe source of contamination. In addition, this UFD also suffers from a large contamination by MW foreground stars. Even when radial velocities (RV) are considered, the selection of bona-fide members is made rather uncertain by the mean velocity of the galaxy (45 km s-1, Adén et al. 2009a) being embedded into the velocity distribution of foreground MW dwarf stars, coinciding with the velocity of the thick disk. For this reason, an estimate of Hercules mass based only on kinematic methods is highly uncertain, as shown by Adén et al. (2009b). Adding a selection based on the Strömgren index, Adén et al. reduced the radial-velocity dispersion of Hercules stars and decreased the galaxy mass within the half-light radius by a factor of 1/4. The rescaled mass is much lower than the common mass scale for MW satellites (Strigari et al. 2008), suggesting that Hercules does not share the halo properties seen in the classical dSphs and other UFDs. The Galactic contamination in the direction of Hercules is a severe problem that needs to be settled before attempting to derive metallicity and radial velocity distributions of Hercules’s stars and, in turn, constrain the galaxy mass and luminosity.
Due to the importance of weeding out any external contaminants, an accurate method to determine the star membership is mandatory to study the stellar population content and the structure of such a poorly-populated and heavily-contaminated system. In this paper, we study the star membership through the analysis of the proper motion (PM) of stars in the Hercules field. Our aim is to remove the foreground contamination by separating Galactic from Hercules stars, according to their PMs. Up to now, such measurements have been conducted in a handful of dSphs using HST data (e.g. Piatek et al. 2003, 2007; Massari et al. 2013), while the Fornax galaxy is the only target studied with ground-based data (Méndez et al. 2010). However, previous works dealt with limited areas of those galaxies, due to the small field-of-view (FoV) of the detectors. Here, we use the Large Binocular Telescope (LBT), whose FoV covers well beyond the half-light radius of Hercules (=8.6′, Martin et al. 2008). We combine new observations specifically obtained for this purpose with archival images and found our membership criteria on PMs and on the colour-colour diagram that involve , , and data.
The paper is organized as follow: § 2 describes our procedures for the data analysis and to measure PMs and photometry. The results are discussed and compared to previous membership analysis in § 3, while implications for the galaxy stellar population content and for the metallicity and radial-velocity distributions are presented in § 4. A summary and conclusions section close the paper (§ 5).
2 Observation and data reduction
2.1 Observations
The Hercules UFD galaxy (=16h31m02s.0, =12∘47′25″.6, J2000.0) was observed with the Large Binocular Camera (LBC, Giallongo et al. 2008) at the LBT located on Mount Graham in Arizona. The LBC is a wide field imager (4 CCDs, 2K4.5K pixels each) with a FoV of 23′23′ and a resolution of 0.225″ pix-1. We employed both archival and proprietary data to have the longest available time baseline. A log of the observations used in this work is reported in Table 1.
The 2007 dataset covers only the central part of the galaxy and was collected during the LBT science demonstration time (March 2007, Coleman et al. 2007) with the LBC-blue, the only active ”eye” at that time. Images were taken through - and -filters with almost no dither. An accurate geometric-distortion (GD) solution is available for the filter, but not for the filter. It was not possible to self-calibrate the GD of the filter due to the lack of an adequate dither strategy. For this reason, we selected and used only images in the filter from this dataset.
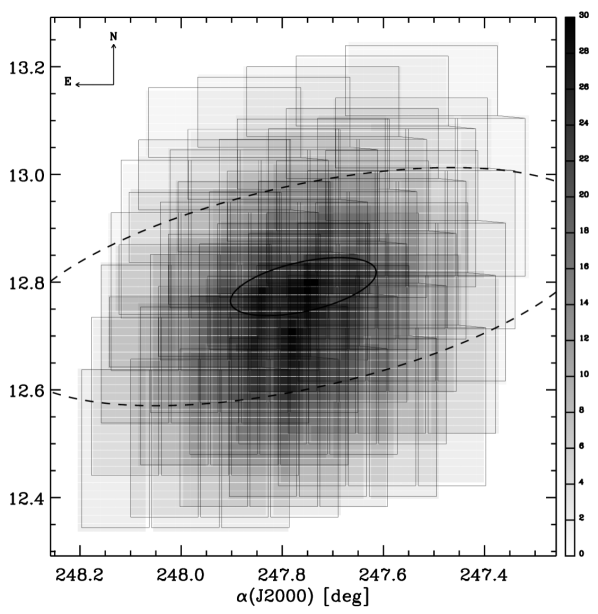
The archival exposures are part of the dataset collected between May 29th and June 1st 2008 with the LBC-red and published in Sand et al. (2009), from which we selected the central and lateral fields (see Fig. 1).
The archival images were combined with 25 new images acquired on April 4th 2013111INAF-DT n.38, P.I.: E. Brocato. We adopted a large dither pattern (70″, 30% of the FoV) specifically designed to calibrate the GD in the -filter of the LBC-red. The right panel of Fig. 1 shows the dither pattern and the depth-of-coverage map of the proprietary -exposures. The total area covered is 0.69 deg2. Images were collected using both the LBC-blue and LBC-red arms in (39 exposures), (31), and (8).
The new observations completely cover the central field and partially overlap the lateral fields of Sand et al. (2009), as shown in the left panel of Fig. 1.
| UT Date | LBC | Filter | Exp.time | Seeing | Dither | Field |
|---|---|---|---|---|---|---|
| (s) | (arcsec) | |||||
| 2007 Mar 17 | Blue | 6300 | 0.9 | Small | Cent | |
| 2008 May 29 | Red | 6300 | 0.9 | Small | East | |
| 2008 May 30 | Red | 6300 | 0.9 | Small | West | |
| 2008 May 31 | Red | 6300 | 1.2 | Small | Cent | |
| 2008 Jun 01 | Red | 5300 | 0.9 | Small | Cent | |
| 2013 Apr 04 | Red | 3960 | 0.9 | Large | Cent | |
| 2013 Apr 04 | Blue | 3160 | 1.1 | Large | Cent | |
| 2013 Apr 04 | Blue | 860 | 1.2 | Large | Cent |
2.2 Data reduction
Data were reduced using the procedures described in Bellini et al. (2010). A main asset of our reduction process was the derivation of an ad-hoc GD correction for the LBC-red in the -filter, starting from the recipes described in Bellini & Bedin (2010) and improving the polynomial solution that follows prescriptions provided in Libralato et al. (2014). Here, we briefly outline the key points of the reduction process while referring to the aforementioned papers for more details.
2.2.1 Astrometric and photometric reduction
The pre-reduction procedure included standard operations such as de-biasing, flat-fielding, pixel-area correction, and cosmic rays-removal (Bellini et al. 2010). The reduction software is able to find bright, isolated star-like sources in each CCD of each exposure and obtain spatially varying empirical point-spread functions (PSFs in an array of 34 elements for each chip). These PSFs were then used to measure positions and fluxes of sources in each chip of each exposure that were then collected into individual catalogues.
2.2.2 The master frame
All stellar positions in the -filter catalogues were corrected using the -filter geometric-distortion correction available from Bellini & Bedin (2010). We cross-identified stars in common between catalogues and derived average position and magnitude for each source onto a distortion-free reference system (hereafter, the master frame). To build the master frame, we proceeded as follows. We started from the GD-corrected positions of the first catalogue and identified all catalogues that have stars in common. We then transformed the stellar positions of these overlapping catalogues to the first-catalogue reference system by means of conformal transformations (two rigid shifts in the two coordinates, one rotation and one change of scale), using only bright, unsaturated stars in common to compute transformation coefficients. The average transformed positions and fluxes of common stars defined a new, larger, and improved master frame. We iteratively increased and improved the master frame by adding additional overlapping catalogues.
Once stars from all catalogues have been added to the master frame list, we improved single-catalogue transformations by means of more general, 6-parameter linear transformations (to minimize the residuals in the linear terms). The final master frame contains average positions and fluxes of all stars measured in at least three exposures.
2.2.3 -filter geometric distortion solution for the LBC-red
The blue and red LBC arms have the same optical design, and their cameras are made by the same detectors arranged in the same way. This means that both the blue and the red cameras have a similar geometric distortion to the 0-th order, and, therefore, the distortion solution found for the blue-arm should represent a good first-guess solution also for the red-arm.
Hence, to derive the geometric-distortion solution of the exposures for the LBC-red, we started by correcting the stellar positions of the 2013 dataset with the -filter GD correction of Bellini & Bedin (2010).
We cross-identified stars in different catalogues to put them in the same reference frame of the -filter master frame by means of conformal transformations. Even if the -filter correction for the LBC-blue is not perfectly adequate to correct the -filter LBC-red images, systematic errors on their positions have a random amplitude from one exposure to the other due to the adopted observing strategy (dither pattern). Hence, the average star positions in the master frame provide a good first-guess approximation of their true positions in a distortion-free frame.
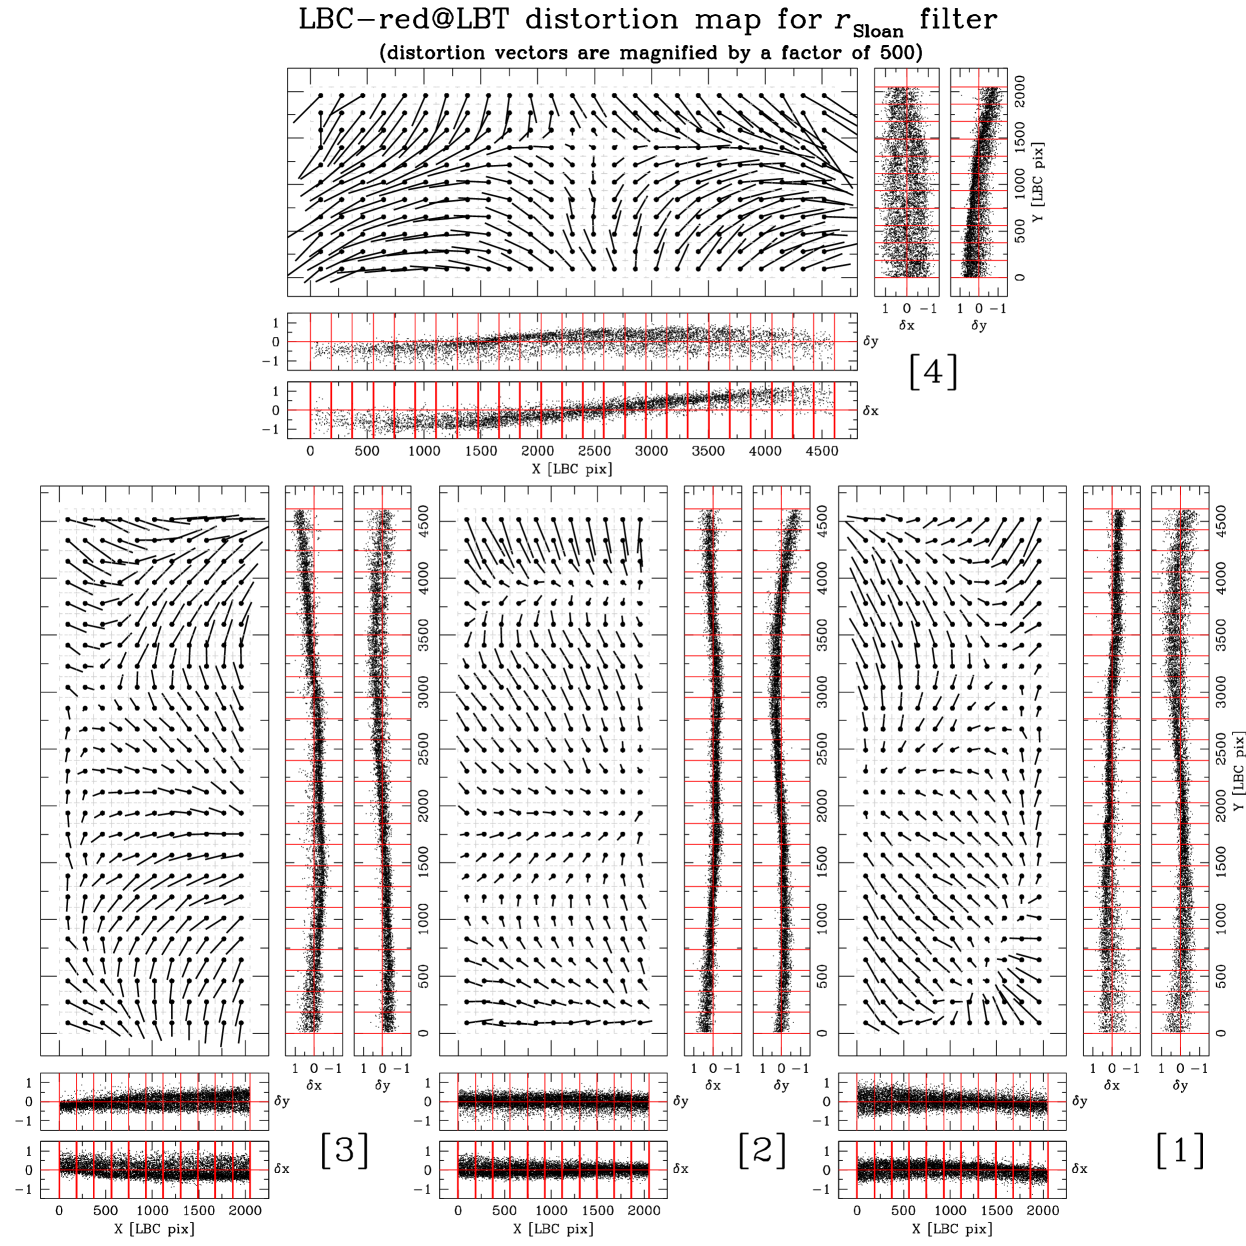
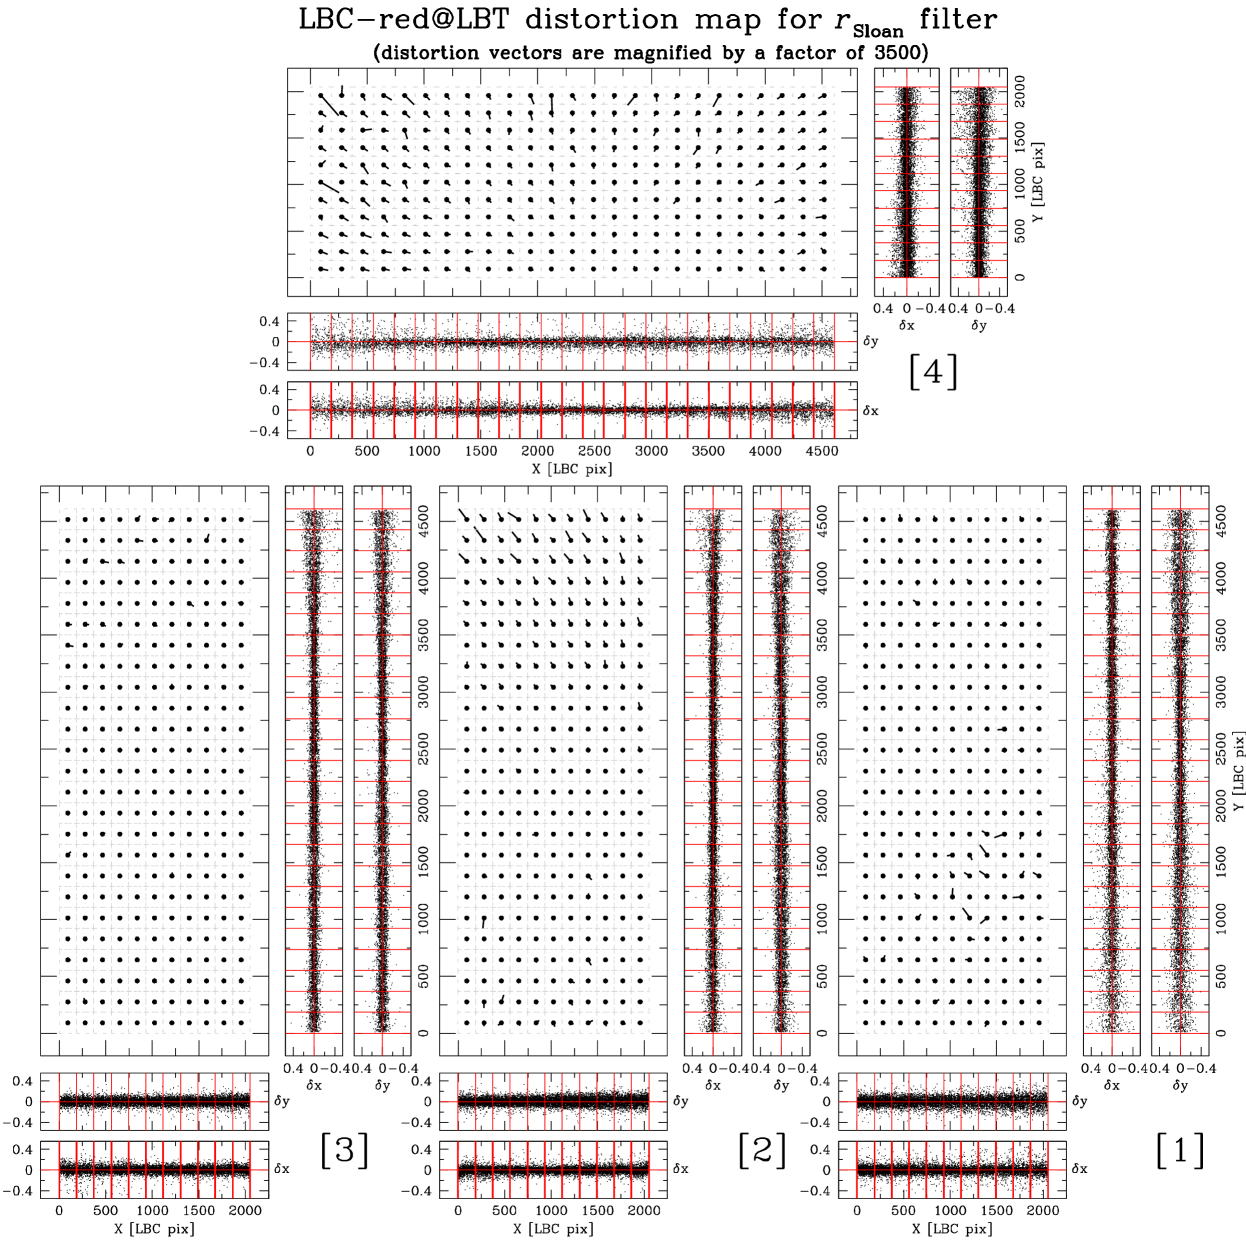
The GD solution for the -filter of the LBC-red is made by three parts: a linear transformation to put all images on the master frame; a polynomial correction; and a table of residuals.
The polynomial correction was mostly performed, as described in Bellini & Bedin (2010). The only difference is that we used a fifth-order polynomial instead of a third-order one to fit the residual trends. At the first iteration, the cubic part of the polynomial was the same of the -filter third-order polynomial of Bellini & Bedin, while higher-order terms were set to zero. Then, we iterated the procedure to derive new polynomial coefficients and improve the master frame until the star positional r.m.s. did not change significantly from one iteration to the next.
The last part of our correction consisted of four look-up tables (one for each CCD) to minimize the residuals of the geometric distortion left by the polynomial correction. We followed the method described in Bellini et al. (2011) for the WFC3/UVIS detector of the HST.
In our correction, we subdivided each chip of the 4-CCDs LBT mosaic in 1125 elements. The table correction was built at a given location of the chip using a bi-linear interpolation among the surrounding grid points. We iterated this procedure by applying 75% of the suggested correction, building a new master frame, and computing new, improved grid points. The convergence was reached when the change in the suggested correction was negligible from one iteration to the next.
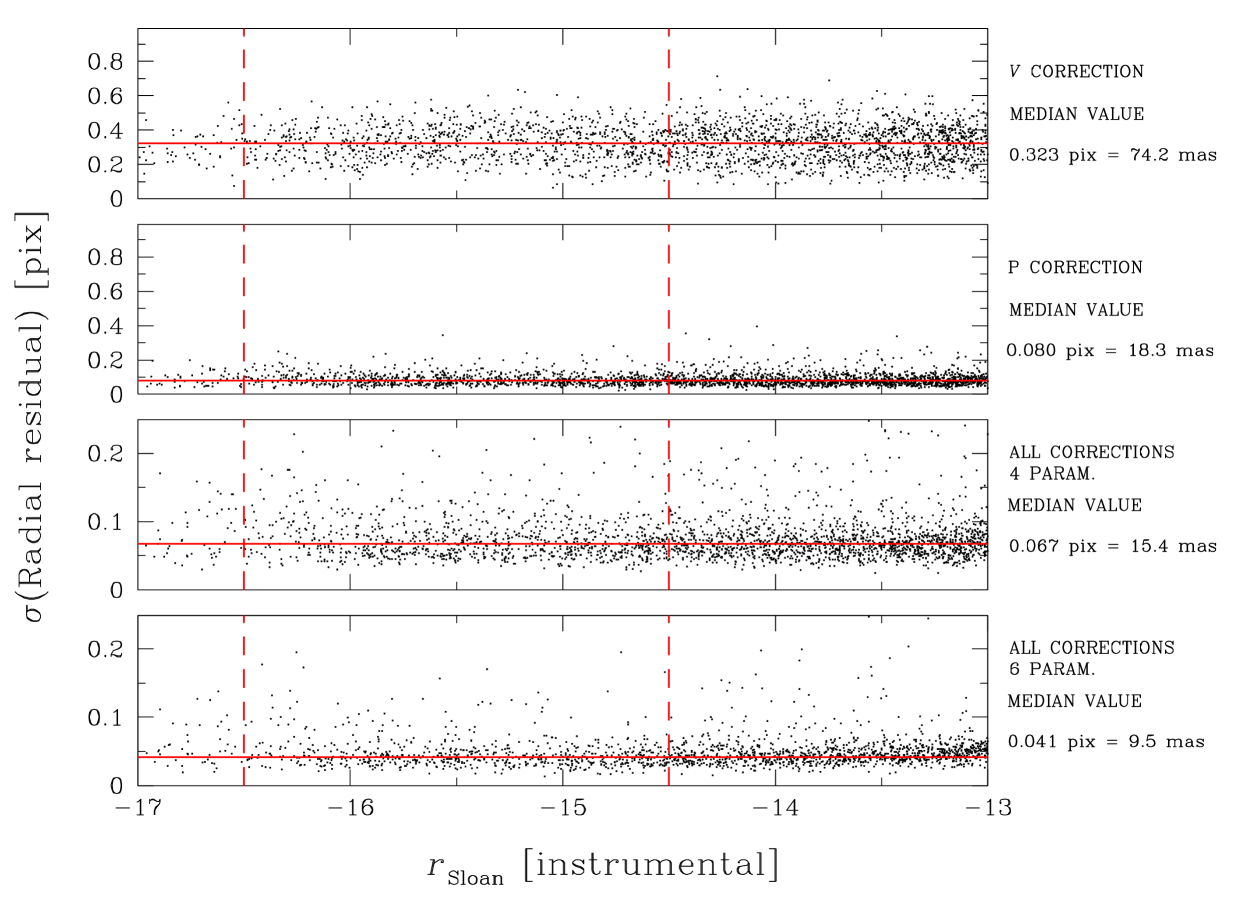
In Figs. 2 and 3, we show the distortion maps before and after applying the distortion corrections, respectively. Figure 4 shows the (Positional residuals), computed as in Libralato et al. (2014) after each step of our correction. In the bottom panel, we show the (Positional residuals) for a master frame derived using general 6-parameter linear transformations. By applying all corrections, the (Positional residuals) improve from 74.2 mas to 9.5 mas.
2.2.4 Geometric-distortion corrected and cleaned catalogues
To build the final master frames for the 222The GD correction in was adopted also for the filter., , and filters, we cross-identified all stars in our GD-corrected catalogues using 6-parameter linear transformations to absorb uncorrected distortion and atmospheric effects (see e.g. Libralato et al. 2014) and to further improve the general astrometric accuracy.
The master lists (one for each filter) were purged from false detections as in Anderson et al. (2008). We selected stellar sources according to their photometric errors and the quality of the PSF-fit (QFIT, derived from the absolute value of the residuals of the PSF-fit for each star scaled by the flux) by considering the 65th percentile of the quoted quantities as a function of magnitude. We ended up with master lists of 15217 sources in , 7700 in and 5759 in .
2.2.5 Astrometric and photometric calibration
The astrometric calibration was also derived with the purpose of obtaining the match with the SDSS (DR9, Ahn et al. 2012) and the Sand et al.’s catalogues. We used the UCAC 4 catalogue (Zacharias et al. 2013) to convert our pixel-based coordinates into equatorial coordinates by cross-identifying the stars in common between the two catalogs using 6-parameter linear transformations.
The photometric calibration was performed using a set of sources extracted from the SDSS catalogue. The magnitudes were obtained by applying the relations by Jordi et al. (2006) and Jester et al. (2005), as described in Sand et al. (2009). The filter has a response curve very similar to the SDSS ; therefore, we calibrated it against the SDSS magnitudes without any further colour transformation. The zero point and the colour term of the calibration relations were obtained using only the best stellar-type sources (i.e. QFIT0.15) where the r.m.s. of the photometric residuals around the mean magnitude is smaller than 0.03 mag. For the and filters, a zero point was sufficient to calibrate the instrumental magnitudes, and no significant colour term was found. For the filter, both and colours were used to derive calibration relations. We obtained a good fit with both colours but used the equation in in the end , which has smaller scatter. The calibration results were checked against Sand et al. (2009) for the two filters in common (, ), finding a close agreement with an r.m.s. scatter below 0.03 mag for magnitudes brighter than 20 mag and 21 mag. For the -filter, the check was performed by comparing the calibration results obtained from the and the colours to fit the colour term, which was negligible in both cases, as already mentioned. The check was performed by using a set of 1500 stars from the SDSS survey having a magnitude brighter than 20 mag in the colour range 1[mag]3. The results of the fit provide calibrated magnitudes that are in good agreement with each other. In the following, we adopt the calibrated magnitudes coming from the transformation equation.
2.3 Proper motions
The images were used to measure the stellar proper motions (PMs). The Hercules -band datasets define a time baseline of 4.94 years and cover a common area of 0.30 deg2. To measure the stellar displacements between the two epochs, we followed the prescriptions given in Anderson et al. (2006). To do this, it is mandatory to select a set of reference objects against which to compute relative PMs. An absolute reference frame is not required here. We measure star motions with respect to other stars in our field. From basic considerations on the expected internal motions of stars belonging to Hercules as opposed to the Galactic field stars, we can expect that the internal velocity dispersion of the formers is much smaller than that of the latters. Indeed, according to the internal velocity dispersion measured by Adén et al. (2009a) and the galaxy distance, we expect the Hercules stars to have an internal velocity dispersion of 0.01 mas yr-1. This is a factor of smaller than our random measurement errors (10 mas yr-1). Furthermore, according to what is observed for other dSphs located at similar distance, such as Carina (100 kpc, Piatek et al. 2003) and Fornax (135 kpc, Piatek et al. 2007), we expect an absolute PM of the Hercules stars of the order of tenths of mas yr-1. Therefore, Hercules stars represent the best choice to define our reference list.
We started by identifying Hercules stars within an ellipse with a semi-major axis of 7′ centered on the galaxy center, ellipticity, and inclination values from Martin et al. (2008) (to mitigate the fraction of field contaminants). Stars within this region were then plotted on the vs. CMD, on which we isolated two regions containing bona-fide Hercules red giant branch (RGB) and HB stars. The CMD selections were then extended to the whole FoV. The initial list of reference stars includes 323 objects.
We used this starting reference list to transform stellar positions of each catalog onto the master frame following the local transformation approach described in Anderson et al. (2006). This allows us to map the coordinate system of one frame into that of another and transform the position of each individual star measured in one frame into that of the other. Because of the low stellar density in the Hercules field, we used the nearest 25 reference stars found on the same chip as the target star in both images. Of these 25 stars, we reject the five with the largest transformation residuals. The final best 20 reference stars will then define the local transformation parameters that map the coordinate system of one frame into that of another. Then, for each star, we computed the displacement on the master frame as the average of the displacements obtained by comparing each pair of transformed positions (one from the first epoch and one from the second epoch). Once we have obtained a first estimate of the stellar PMs, we can improve the reference list by rejecting those stars, which motion is not consistent with the Hercules mean motion (i.e. with a displacement larger than 1 pixel). We iterated the process of improving the reference list and measuring more accurate PMs three times. A further iteration proved to offer negligible improvements. The final list of reference stars includes 255 objects.
Because of the low surface density of Hercules stars and the severe Galactic field star contamination, some of the reference stars used in the local transformation between epochs are actually not members of Hercules. In particular, the fraction of Galactic stars is expected on the basis of Besançon model to increase from 20% to 50%, which moves from the center to the outer regions of the field. However, the inclusion of these stars in the reference list does not sizably affect the astrometric reference, since the mean PM of such stars is comparable to that of Hercules within the measurement errors but with a larger dispersion.
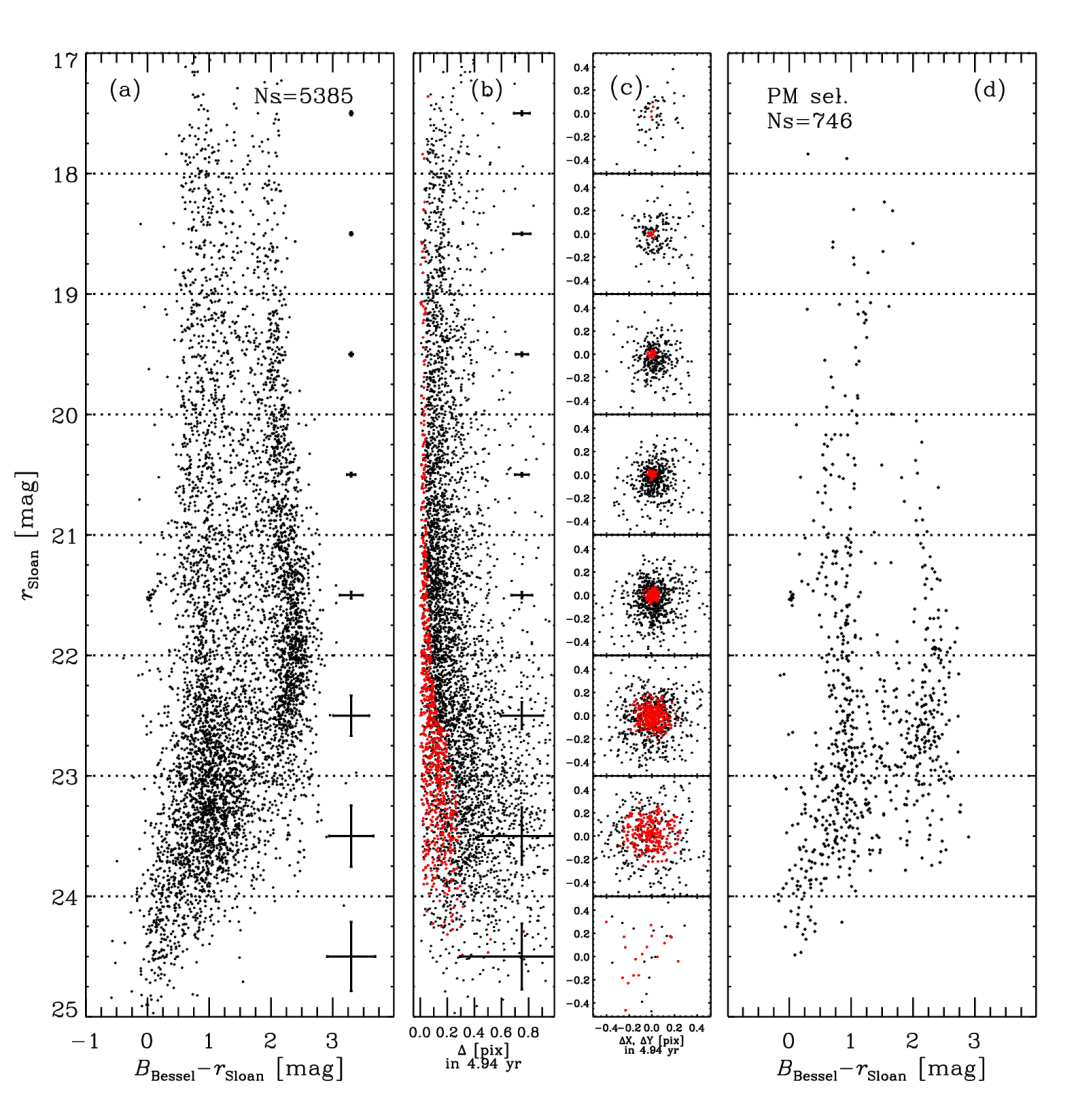
We were able to measure PMs for 5385 objects that have both and photometry. Panel (a) of Fig. 5 shows the vs. CMD of these sources. Similar, but less accurate, results were obtained using probable background galaxies with 23.5 [mag]24.5 and [mag]1.0 as the reference list. The disadvantage of this approach is in the much lower signal-to-noise of these sources (higher random errors) that leads unavoidably to a poorer accuracy in the PM determination.
2.3.1 Proper motion selection
The displacements () for the 5385 stars, which have a PM measure, are reported as black dots in panel (b) of Fig. 5. The mean uncertainties of magnitude and displacement in each magnitude bin are also shown. Unlike what is commonly found for Galactic stellar clusters, panel (b) does not show a clear dichotomy in the PM star distribution. Therefore, to distinguish field stars from Hercules members, we can only select those stars with a PM compatible with a null value. For this reason, we took the dependence of the PM uncertainty on magnitude into account by computing a running 65th percentile of the r.m.s. displacement () as a function of the magnitude. We, then, adopted its half as PM selection radius (). Moreover, we chose only stars that have a number of couples of measurements () larger than 50. These selection criteria represent a compromise between including contaminants that have velocity equal to the Hercules’ mean PM and missing galaxy members with larger PM errors. The resulting selections are shown as red symbols in panel (b). The same colour coding is adopted in panel (c) of Fig. 5, where we show the vector-point diagram (VPD) for each magnitude bin. In other words, the selected stars have a displacement lower than the (magnitude dependent) uncertainty; thus, their displacement is assumed to be nil.
The final PM-selected catalogue consists of 746 sources, and we show their CMD in panel (d) of Fig. 5. The RGB and HB of Hercules stars are clearly defined, compared to the unselected CMD in panel (a). In both panels, the main sequence turn-off of Hercules (24 mag, Sand et al. 2009) is not reached with an adequate signal-to-noise ratio, although we have used the same data of Sand et al. (2009). This effect is caused by the lower (by a factor of 5) total exposure time of the second-epoch data compared to the first-epoch, and it is even enhanced by the different approach to the data reduction and analysis. Sand et al. performed their photometry on the co-added images; we instead measured the stars positions and fluxes on the individual exposures.
The PM selection allows us to disentangle a significant fraction of MW stars. To better highlight our results in Fig. 6, we compare the CMD within Hercules half-light radius before and after the PM-selection procedure. The left panel of Fig. 6 shows that a selection merely based on the stars radial distribution still suffers from a large contamination by field stars. This is significantly reduced by PM-motion selecting Hercules members (right panel of Fig. 6). Nevertheless, panel (d) of Fig. 5 shows that a Galactic sequence at colour 1.9 [mag]2.8 is still present in our PM-selected CMD. To provide a rough estimate of the residual Galactic contamination, we selected two boxes on this sequence and compared the star counts with the unselected catalogue. In the first box, which are located around the HB magnitude level (21 [mag]22), we found that about 8% of Galactic stars survive our proper motion selection, while 25% are in the second box, located at a fainter magnitude level (22 [mag]23). We note that similar fractions are expected from a Galactic simulation taken from the Besançon stellar population synthesis models (Robin et al. 2003, 2004) after applying the same PM-selection criteria described above. The same simulation allows us to estimate the residual fraction of Galactic stars expected at the same levels of magnitude as above, but for the Galactic blue plume in the colour range [mag]1.8. They are expected to be 10% and 40%, respectively. In Table 2, we list the final catalogue of 528 PM-selected sources. From left to right, we report the source identity (Col. 1), right ascension, and declination (Col. 2–3), , and magnitudes with their uncertainty (Col. 4–6), displacement with its uncertainty (Col. 7).

We recall that the selection described above is based on the assumed selection radius for the allowed displacement and on the number of couples. We performed several tests to evaluate the dependence of our results on these quantities. We found that a 30% increment (decrement) of produces an increase of 25% (decrease of 40%) in the number of sources, while the contamination increases (decreases) more than 35%. On the other hand, the number of sources increases by 70% for =10, but the residual contamination doubles. In contrast, by adopting =100, the field contamination and sources are reduced to half the number. We can conclude that the parameters adopted in Fig. 5 are assured to have a reasonable number of stars and marginal contamination.
2.4 Completeness tests


The comparison between our unselected photometric catalogues and those of Sand et al. (2009) shows similar luminosity functions down to magnitudes of 23 mag and 24 mag, respectively (Fig. 7). We recall that the magnitude depth is limited by the exposure times of the second-epoch observations, which are about five times shorter than the first-epoch time exposures. Moreover, given the different data reduction and photometric procedures, there are differences between our stellar counts and those found by Sand et al. even for bright stars. However, such differences, due to the differing photometric reductions, are of the order of the sampling uncertainty and fully accounted by the Poisson noise (Fig. 7), since /1, where is the difference in counts between us and Sand et al.. Fainter than the above-mentioned magnitude limits, stellar counts differ by more than . This implies that our photometry is nearly complete for sources brighter than 23 mag and 24 mag, and, consequently, the photometric completeness does not represent an issue in our study, given the magnitude intervals for the analysed science objects.
3 Membership analysis and comparison to previous works
To date, attempts to identify Hercules members have been mainly based on CMD-selection techniques, sometimes combined with radial velocity studies. Coleman et al. (2007) selected Hercules candidate members by comparing the vs. CMD (where ) of the galaxy central region with the CMD of an adjacent field. Adén et al. (2009a) separated the foreground Galactic dwarf stars from Hercules RGB giants by means of Strömgren photometry and the vs. diagram as a function of magnitude. A similar approach was followed by Simon & Geha (2007) and Deason et al. (2012), who selected galaxy candidates from the SDSS data on the basis of the colours and proximity to Hercules.
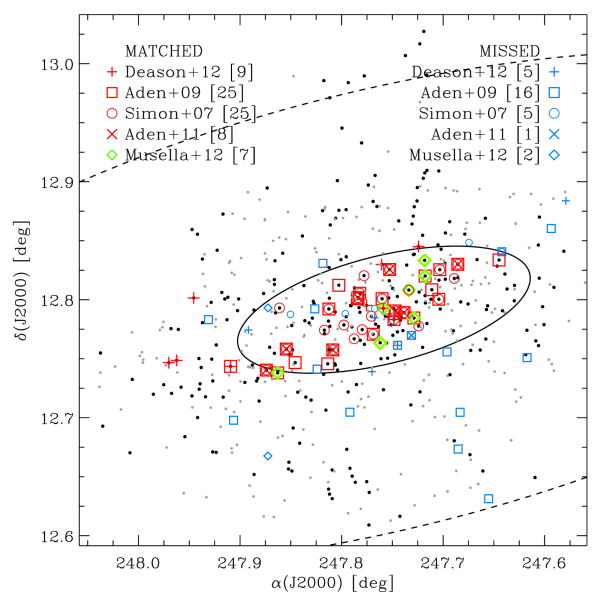
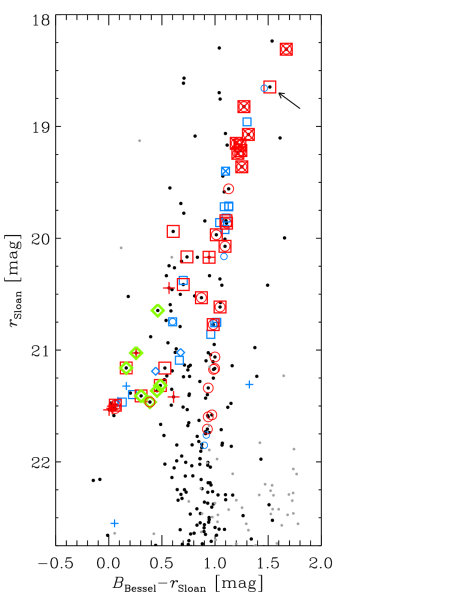
Figure 8 shows the spatial distribution and the CMD of our PM-selected catalogue and the evolved stars with spectroscopic measurements. Red (blue) symbols mark the position of the spectroscopic targets included (non-included) in our final catalogue. The RR Lyrae stars identified by Musella et al. (2012) are also marked. In detail, 41 sources of Adén et al. (2009a)’s list have a counterpart in our complete photometric catalogue; however, only 25 are cross-identified in our PM-selected list. Three stellar sources in Deason et al. (2012) sample are located outside our FoV. Nine of the remaining 14 sources are present in our PM-selected catalogue. As for the sample of Adén et al. (2011), two stars are not present in our final FoV, and we recovered eight of the nine sources, while 25 (red circles) of the 30 sources in Simon & Geha (2007) are part of our PM-selected catalogue. We note that this latter sample was also analysed by Kirby et al. (2008, 2013). The list of cross-identified spectroscopic sources and variables is presented in Table 3. In a recent study, using radial velocity measurements Koch et al. (2014) confirmed the star named Her-3 in Koch et al. (2008, 2014) (#41082 in Adén et al. 2009a, #009 in this work) to be a binary system. We confirm that this star (marked by an arrow in the right panel of Fig. 8) is indeed present in our PM-selected catalogue.
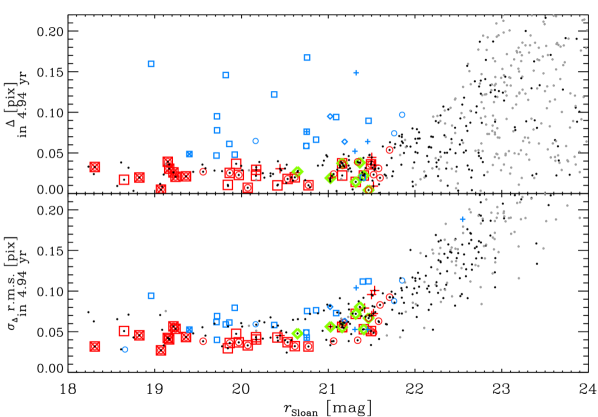
The majority of the sources from Adén et al. (2009a), Simon & Geha (2007), and Adén et al. (2011) catalogues that were PM rejected are located on Hercules RGB and HB loci (right panel of Fig. 8). All these sources have a displacement larger than 0.05 pixels, where the maximum value is allowed to be Hercules members as described in the § 2.3 (Fig. 9). For the sake of clarity, we note that seven un-matched spectroscopic targets show a displacement larger than pixel (one from Simon & Geha 2007, four from Adén et al. 2009a, and two from Deason et al. 2012). Therefore, we can firmly exclude them from the Hercules members. We also note that a 30% increase of and the adoption of =20, result in the inclusion of only two stars from Deason et al. (2012), four stars from Adén et al. (2009a), one star from Musella et al. (2012), and three stars from Simon & Geha (2007).
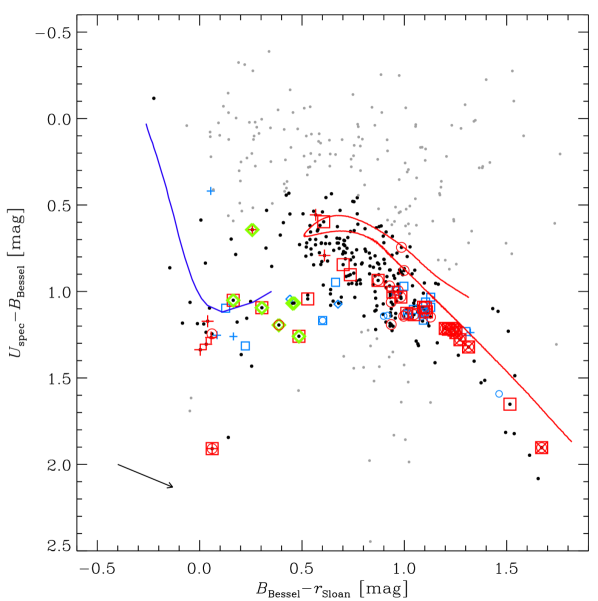
We further investigated the Hercules membership with another powerful tool: the colour-colour diagram. In Fig. 10, we plot the star distribution in the vs. plane. We superimposed a metal-poor ([Fe/H]=) isochrone with age =13 Gyr and the corresponding zero-age horizontal branch (ZAHB) from the stellar model database BaSTI (Pietrinferni et al. 2004, 2006, 2013)333Available at: http://albione.oa-teramo.inaf.it as reference. In this diagram, PM-selected stars with spectroscopic measurements and RR Lyrae variables are located near the isochrone and the ZAHB, following the evolutionary phase prescriptions also in the colour-colour diagram. Sources located far from these regions are marked by grey dots and are not expected to belong to the Hercules UFD. In particular, the grey dots in the upper-right part of the two-colour diagram are mainly background galaxies, while grey dots in the lower regions are foreground Galactic stars (e.g., see Fig.1 in Bono et al. 2010). In conclusion, we are confident that stars selected according to our PM analysis and the colour-colour diagram are likely Hercules members.
4 Stellar population analysis
4.1 Metallicity distribution

Spectroscopic studies have shown the stars in the FoV of Hercules to exhibit a broad metallicity distribution spanning from [Fe/H]= up to (Adén et al. 2011; Kirby et al. 2013, see Fig. 11). This evidence is also supported by photometric metallicity estimators, such as Strömgren indices (Adén et al. 2009a) and Fourier analysis of light curves of RR Lyrae (Musella et al. 2012). This behavior seems quite common among dwarf galaxies (among the UFDs, in particular) and is interpreted as the sign of a complex chemical evolution. However, up to now, the high foreground contamination in the Hercules field has hampered any detailed analysis. We have now recomputed the weighted mean and the standard deviation of Hercules [Fe/H] distribution using our PM-selected sample, which is only marginally contaminated by Galactic stars and background galaxies. The metallicity spread is confirmed, as shown in Fig. 11, where dashed-line histograms refer to original data, whereas shaded histograms show the metallicity distribution of the PM-selected stars. We note that the iron abundances, derived by Adén et al. (2009a) and based on Strömgren photometry, were corrected by adopting the new calibration provided by Adén et al. (2011). The cumulative [Fe/H] distribution, obtained by merging the three samples, is also shown in the bottom panel. From the PM-selected stars, a weighted mean metallicity value of [Fe/H]=0.04 and a dispersion of =0.48 dex are obtained.
4.2 Kinematics and structure
We applied the same cleaning procedure to the RV distributions provided by Adén et al. (2009a) and Simon & Geha (2007) and obtained mean RV and dispersion values that agree with the unselected ones. We also analysed the cumulative RV distribution by applying a weighted mean to the stars in common between both authors and we obtained very similar results. Furthermore, we estimated mean systemic velocity and dispersion using the maximum likelihood approach described in Walker et al. (2006). We derived a mean velocity of 45.020.97 km s-1 with a dispersion of 4.291.17 km s-1 using 26 stars. We used our velocity dispersion and Eq. 11 of Walker et al. (2009) to estimate the galaxy total mass for which we found the value of =3.52.4 M☉, which agrees with literature estimates (e.g. Walker et al. 2009; Adén et al. 2009b). As noted by Adén et al. 2009b, this value is significantly lower than the common mass scale found by Strigari et al. (2008, = M☉), suggesting that Hercules does not share the halo properties seen in other dSphs.
The poor statistics of the RV distribution does not allow us to find firm evidence for possible kinematic sub-structures in Hercules. On the other hand, our data cover a significant fraction of the galaxy body, and our selection procedures allowed us to confidently identify likely members. For these reasons, we were able to investigate the galaxy structural properties. In particular, the left panel of Fig. 8 shows that stars selected according to the PM and colour-colour diagram criteria appear strikingly distributed along the galaxy major axis. We repeated the analysis of Martin et al. (2008) and confirm the large ellipticity (0.68, ) of this MW satellite. Deason et al. (2012) suggested a tidal stripping process to explain the high elongation value, a hypothesis supported by the systemic velocity gradient in the outskirt of Hercules. We note that our PM selection confirmed two probable tidal stripped stars (Deason et al. 2012, F1-09 and F1-10 in their Table 2) as Hercules members. Nevertheless, new spectroscopic data, covering a larger area and a larger sample of stars, are needed to put firm constraints on the Hercules tidal disruption. Our study now provides a robust identification of Hercules members and a solid target list for further spectroscopic investigations.
4.3 Colour-magnitude diagrams
Hercules appears as a very sparsely and poorly populated system (see for instance Fig. 8). In spite of this, the RGB is well-defined, and the HB appears characterised by () a group of moderately blue stars easily recognizable at 0 mag; () a handful of stars that are candidate to be extreme blue HB stars; and () a number of stars redder than the RR Lyrae variables and nearly at same magnitude level. The colour-extension of Hercules HB was interpreted by Belokurov et al. (2007) early as a signature of possible multiple stellar populations in the galaxy, since a metal-rich population, possibly 1-3 Gyr younger than the bulk of stars might be responsible for the red HB stars. Such a component was not ruled out by Brown et al. (2012) on the basis of HST photometry. However, we recall that the morphology of the HB can be driven by a complex interplay of different effects (e.g., see Lee 1994; Buonanno et al. 1997; Pasquato et al. 2013).
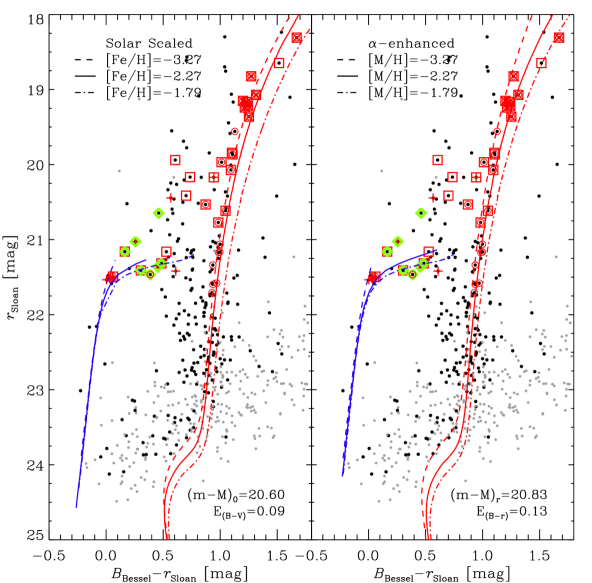
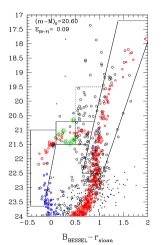
In Fig. 12, we compare Hercules PM- and colour-colour-selected CMD with theoretical prescriptions. We over plotted isochrones and ZAHBs from the BaSTI database for metallicities compatible with the spectroscopic estimates (i.e. [Fe/H]=, , ). For each metallicity, two sets of isochrones were considered: solar-scaled and -enhanced (=+0.4)444The evolutionary models were constructed assuming a helium-to-metal enrichment ratio /=1.4 and a fixed mass-loss rate described by the mass-loss Reimers parameter =0.4 (Pietrinferni et al. 2004).. An age of 13 Gyr, the distance modulus =20.60 mag and the reddening value =0.09 mag were adopted (Musella et al. 2012). The extinction coefficients are from McCall (2004)555=4.80, =4.07, =2.58. To account for the decrease in the He-core mass caused by the use of more updated conductive opacities, the ZAHB magnitude level was increased by 0.05 mag (Cassisi et al. 2007). Agreeing with spectroscopic measurements, we found that the RGB stars fit either solar-scaled models or -enhanced chemical mixture models. In particular, the two redder stars at the RGB-tip (1.4 mag) match well the most metal-rich isochrones.
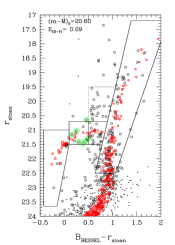
Even after cleaning for external sources, there is a number of stars around 0.5 mag spread over one magnitude (from 20.3 to 21.3 mag). In our total FoV, we counted about 21 of such stars (see dotted line box in Fig.13). The feature extended above the HB level was first recognized by Adén et al. (2009b), who also suggested it might be populated by variable stars. However, Musella et al. (2012) identified only one anomalous Cepheid (AC, star V2 in their Table 2, =20.64 mag) in that region of the CMD, which is consistent with a stellar evolution model with 1.35 M☉ (Z=0.0001). We confirm that this star (the most luminous variable in Fig. 12) with a displacement 0 pix in 4.94 yr is a likely member of the Hercules UFD. The nature of ACs is still debated (e.g. see Marconi et al. 2004). The most widely accepted scenarios are that they could be young (5 Gyr) single stars belonging to a recent star formation episode or they could be massive stars formed via a mass transfer in binary systems, but as old as the other stars in the stellar system. Therefore, Hercules’ AC might be again an indication of the presence of an intermediate-age population that is as old as 2-3 Gyr, as speculated by Musella et al. (2012).
To further investigate this issue and to study stellar counts and distributions in the CMD in general, even in case of a complex population scenario, the stellar population synthesis code SPoT666www.oa-teramo.inaf.it/spot (Raimondo et al. 2005; Raimondo 2009, and references therein) was used to simulate a series of synthetic CMDs. We constructed a library of CMDs for single-age, single-metallicity stellar populations spanning the metallicity range [Fe/H] and the age range 1 [Gyr]14. The synthetic CMDs were randomly populated using Monte Carlo methods with the initial mass function (IMF) of Kroupa (2001) in the mass interval 0.1100 M☉. This procedure assures a proper study of poorly populated stellar systems, such as the Hercules UFD. For each star, the luminosity and effective temperature were derived according to evolutionary tracks by the BaSTI database, then magnitudes in the photometric bands of the LBC@LBT channels (both red and blue) were computed using colour-temperature relations derived from the stellar atmospheres by Castelli & Kurucz (2003, and references therein). The LBC-filter response curves were taken from Giallongo et al. (2008) and Speziali et al. (2008). We explored different assumptions on stellar population parameters, such as total mass, age, metallicity, and different parameterizations of the HB star distribution (the Reimers mass-loss parameter , its dispersion , etc.). Each simulation also included a realistic photometric error.
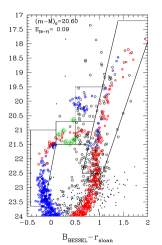
In Fig. 13, we show the comparison between the observed and a synthetic CMD composed by three stellar populations with =14, 13, 10 Gyr and [Fe/H]=, , , respectively. The mass fraction of each subpopulation was derived from the spectroscopic metallicity distribution. In the middle panel of the same figure, we also over plot a stellar population with [Fe/H]= and =1 Gyr (blue circles). From the simulations, we would expect a corresponding number of stars in the MS phase, to have 21 stars in the dotted line box above the red HB. It appears that HST observations (see Fig 1 of Brown et al. 2012) and our data, although not suitable for studying the TO region of the galaxy due to the poor signal-to-noise, tend to exclude such a possibility. This agrees with the general finding that UFD galaxies host mainly old stellar populations (Belokurov et al. 2007; Musella et al. 2012; Brown et al. 2012). Hence, a fraction of stars in that region should belong to the MW, in spite of them having a displacement 0 pix in 4.94 yr (i.e. within our magnitude dependent PM uncertainty, see § 2.3.1). On the other hand, the possibility that a few stars in the aforementioned region might be Hercules intermediate-age stars is not totally ruled out. The right panel of Fig. 13 shows the example of a population that produces a star with photometric properties comparable to those of the only one luminous AC known in Hercules. This specific population has [Fe/H]=, =1.9 Gyr, and a total stellar mass (including white dwarfs and neutron stars see § 4.4) of 8 M☉. From the figure, it is clear that the upper part of the younger MS and the HB blue-tail of the older population occupy the same region on the CMD, where we count just a small number of stars. Moreover, the bulk of the younger MS stars is fainter than 23 mag, the value at which, unfortunately, our data begins to suffer from incompleteness effects. Therefore, we cannot exclude such a small fraction of an intermediate-age population in the galaxy. We emphasize that the very low number of stars involved in the analysis should deserve a more accurate statistical investigation. On the other side, deeper data covering a larger portion of the galaxy are needed to reach a firmer conclusion. Interestingly, Cusano et al. (2013) recently identified a number of pulsating variables brighter than the RR Lyrae stars in And XIX, a new dwarf satellite of the Andromeda galaxy, raising the question of whether this galaxy was still forming stars up to 1 Gyr ago.
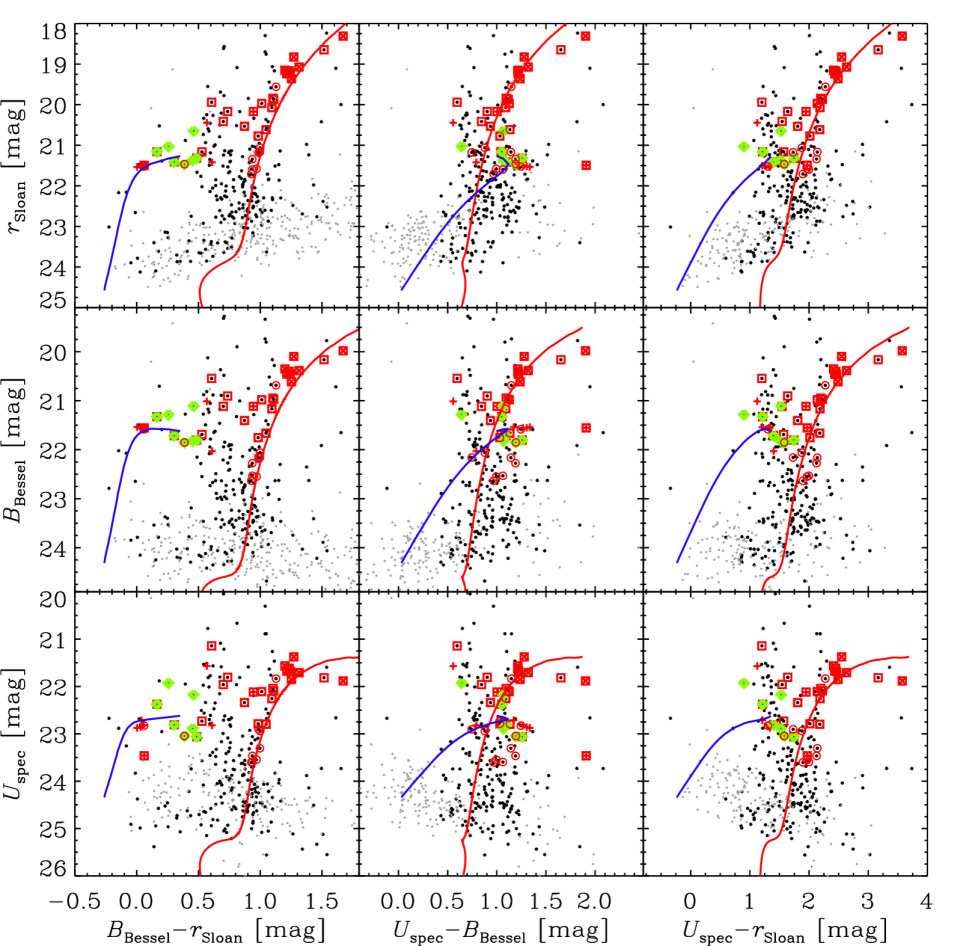
Figure 14 shows the PM-selected CMDs in various filter combinations with superimposed a solar-scaled isochrone with [Fe/H]= and the corresponding ZAHB. The combination of different bands and CMDs allow us to investigate the real membership of the extreme blue-HB stars. We found good agreement of the blue-HB stars with the ZAHB loci in the CMDs, thus supporting their membership to Hercules. Interesting to note is also the HB red incursion in the panels involving the colour (see for a discussion Momany et al. 2003).
| ID | (J2000) | (J2000) | ||||
|---|---|---|---|---|---|---|
| (deg) | (deg) | (mag) | (mag) | (mag) | (pix in 4.94 yr) | |
| 001 | 247.8386 | 12.8540 | 18.920.03 | 18.170.01 | 17.360.02 | 0.060.09 |
| 002 | 247.8689 | 12.7897 | 18.140.01 | 18.140.01 | 17.840.02 | 0.020.06 |
| 003 | 247.9269 | 12.7312 | 19.810.02 | 18.800.01 | 17.880.01 | 0.030.04 |
| 004 | 247.9150 | 12.8006 | 21.590.03 | 19.770.01 | 18.240.01 | 0.030.07 |
| 005 | 247.8111 | 12.8634 | 20.300.04 | 19.340.01 | 18.300.01 | 0.020.06 |
| 006 | 247.7385 | 12.7891 | 21.880.04 | 19.980.04 | 18.310.04 | 0.030.03 |
| 007 | 247.7318 | 12.7109 | 19.980.00 | 19.280.01 | 18.570.01 | 0.010.07 |
| 008 | 247.5811 | 12.8411 | 20.040.03 | 19.320.01 | 18.610.01 | 0.040.03 |
| 009 | 247.8457 | 12.7467 | 21.820.05 | 20.160.01 | 18.650.01 | 0.020.05 |
| 010 | 247.7372 | 13.0069 | … | 19.740.01 | 18.700.01 | 0.030.07 |
4.4 Hercules stellar mass
We have used our PM-decontaminated sample to estimate Hercules’ stellar mass. The number of member stars above 22.5 mag (about half a magnitude brighter than our completeness limit) is quite firm, since the contamination by Galactic stars and background galaxies is only a few percent at this magnitude level (§ 2.3). By contrast, in the region around 0.5 mag and above the red HB, there is still a significant field star contamination, as discussed in § 2.3.1. We considered stellar counts in the different boxes shown in Fig. 13 and restricted our analysis to the area within the galaxy . The observed star counts in the different boxes are =8, 6, 4, and 57, which move from blue to red in the CMD, specifically the red giants are =57.
For each set of parameters (age, chemical composition, IMF, HB parameters, etc.), we constructed a grid of simulated CMDs by changing the total stellar mass to count the desired number of giant stars () in a certain number of simulations. In particular, the mass value changes from a few tens of solar masses up to =5 M☉. The former value is appropriate to produce very few red giant stars if Hercules is considered to host multiple generations of stars with different metal contents (and ages), as suggested by both photometric and spectroscopic observations. The lowest (i.e. =05) considered in the simulation is related to a generation of stars with [Fe/H], contributing with a mass fraction as low as a few percent of the total stellar content according to the spectroscopic measurements (see the previous section). The higher mass value corresponds to the mass of a single-age and single-metallicity population accounting for 100% of observed red giants (i.e. =575). For each set of parameters and each mass value, we generated 500 simulations. Then, we selected only those simulations with a number of giant stars equal to the observed . For each set of simulations computed with the same set of parameters and the appropriate number of reference stars (), we computed the median of the distribution of the integrated total stellar mass (), the luminosity () and the magnitudes. This procedure assured us to accurately recover the mass and luminosity of this sparsely populated faint satellite, whose luminosity can be affected by the number and luminosity of individual stars, which is close to the RGB-tip. The total mass included all the evolving stars from the hydrogen-burning limit up to the asymptotic giant branch and stars along the white dwarf (WD) cooling sequence. In addition, stars with an initial mass higher than 888 is defined as the critical stellar mass over which carbon ignition occurs in non-degenerate conditions, marking the boundary between intermediate-mass and massive stars. is 6.0 M☉ for the used metallicities (Pietrinferni et al. 2004). were assumed to leave a neutron star (NS) as remnant. To evaluate the maximum contribution of NS stars to the total mass, we set the NS mass at its upper limit (2 M☉, see e.g. Fagiolini et al. 2007). We found that the NS mass fraction constitutes a few percent of the galaxy mass at most . We did not take into account the contribution of black holes, which assumes on the mass of the remnant and the IMF. However, for a Kroupa-like IMF in metal-poor old stellar populations it is expected that the mass fraction of both NS and black holes does not exceed 5-10% (Maraston 2005, and references therein). This procedure resulted in more than 2000 realizations for each set of parameters, depending on the expected numbers of stars , which is over more than total simulations.
In Fig. 15, we show, the distributions of and obtained from simulations containing =57, and stellar populations with [Fe/H]= and =14 Gyr; [Fe/H]= and =13 Gyr and [Fe/H]=, =10 Gyr, as an example.

We assumed that Hercules hosts a single-age, single-metallicity population. In such a case, for a population with [Fe/H]=, =13 Gyr, and the Kroupa’s IMF (i.e. =2.3 for stars with mass greater than 0.5 M☉), we found a total stellar mass of =(2.50.2) M☉. As expected, the mass does not significantly depend on metallicity in the [Fe/H] range considered and at fixed age (e.g. 13 Gyr), being =(2.30.2) M☉ for [Fe/H]= and =(2.60.2) M☉ for [Fe/H]=. At fixed metallicity (e.g. [Fe/H]=), if the age increases to 14 Gyr, the mass does not change, while it decreases of 0.3 M☉ when =10 Gyr. We also explored the possibility that the exponent of the Kroupa’s IMF varies: for =1.8 and 2.8, we found a variation on mass values of 8%, which is compatible with the mass uncertainty due to the small number of red giants in Hercules. Finally, adopting a Salpeter-like IMF (i.e =2.35 down to 0.1 M☉, Salpeter 1955) results in a mass value of =(4.10.4) M☉. The luminosity is much less dependent on the population parameters. The -luminosity is =(1.10.1) LV,☉ and the bolometric luminosity is =(1.40.1) L☉; changes of the IMF-shape or ages do not give significant variations (10%). If we rescaled the number of RGB stars to that adopted by Martin et al. (2008) and discard WD and NS stars in our simulations, we find results similar to Martin et al. (2008).
| ID | S&G07 | A09 | A11 | D12 | K13 | M12 |
|---|---|---|---|---|---|---|
| 006 | 308205 | 42241a | 42241a | … | 308205a | … |
| 009 | … | 41082a | … | … | … | … |
| 012 | 308613 | 42149a | 42149a | … | 308613a | … |
| 014 | 308686 | 41743a | 41743a | … | 308686a | … |
| 018 | 308457 | 42795a | 42795a | … | 308457a | … |
| 020 | 309528 | 40789a | 40789a | … | 309528a | … |
| 021 | 308596 | 42096a | 42096a | … | 308596a | … |
| 022 | 309397 | 41460a | 41460a | … | 309397a | … |
| 023 | 309487 | 40993a | 40993a | … | 309487a | … |
| 026 | 308324 | … | … | … | … | … |
| 030 | … | 41737a | … | … | … | … |
| 032 | 308627 | 42008a | … | … | 308627a | … |
| 033 | … | 43167 | … | … | … | … |
| 034 | 308674 | 41912a | … | … | 308674a | … |
| 037 | 308671 | 41758a | … | … | 308671a | … |
| 039 | … | 41401 | … | … | … | … |
| 041 | … | 40435 | … | F1-16 | … | … |
| 049 | … | 41532 | … | … | … | … |
| 052 | … | … | … | F2-01 | … | … |
| 057 | 308524 | 42621 | … | … | 308524a | … |
| 060 | 308829 | 42637a | … | … | 308829a | … |
| 061 | … | … | … | … | … | V2 |
| 064 | 309655 | 41423a | … | … | 309655a | … |
| 073 | … | … | … | F2-07 | … | V1a |
| 075 | 309663 | … | … | … | 309663a | … |
| 083 | … | 42484 | … | … | … | V5a |
| 084 | … | 42550 | … | … | … | … |
| 085 | 3081382 | … | … | … | 3081382a | … |
| 086 | 308327 | … | … | … | 308327a | … |
| 097 | … | 40911 | … | … | … | V8a |
| 098 | 308477 | … | … | … | … | … |
| 100 | … | … | … | … | … | V6a |
| 105 | … | 42355 | … | … | … | V3a |
| 106 | … | … | … | F1-21 | … | … |
| 108 | 308190 | … | … | … | … | V4a |
| 111 | 308256 | 42134 | … | F2-17 | … | … |
| 113 | … | … | … | F1-10 | … | … |
| 114 | … | … | … | F2-16 | … | … |
| 117 | … | … | … | F2-06 | … | … |
| 118 | 309470 | … | … | … | … | … |
| 120 | … | … | … | F1-09 | … | … |
| 122 | 3081556 | … | … | … | 3081556a | … |
| 125 | 308751 | … | … | … | … | … |
| 131 | 3081473 | … | … | … | … | … |
a Available iron abundance value.
5 Summary and conclusions
We have presented LBC@LBT observations in the , and -filters obtained in the direction of the Hercules UFD galaxy using both arms of the LBC. Combined with LBT archive data, the -filter observations covered a time baseline of 4.94 yr (2008-2013). This allowed us to measure the proper motion of stars in the Hercules field over an area about six times the galaxy half-light radius.
We derived a new precise -filter geometric distortion solution for the LBC-red. This allowed us to accurately correct star positions for geometric distortion, resulting in a final catalogue of 5385 stars in (and ) and covering 0.25 deg2 of the sky. We measured star relative proper motions with a precision better than 5 mas yr-1 (0.10 pix in 4.94 yr) for stars down to 22 mag. Finally, we selected 528 sources over an area of 0.12 deg2, which is a large portion of the galaxy body.
The present procedure allowed us to disentangle a significant fraction (90% up to 22 mag) of Milky Way stars from Hercules members. We further improved the CMD cleaning by selecting sources, according to their location in the vs. diagram and removing foreground stars and fainter background galaxies. We finally obtained a sample of 357 likely Hercules stars.
We have compared our PM-selected final catalogue with photometrically and spectroscopically selected literature samples. Our selection criteria allowed us to clear the literature spectroscopic samples from non-members; however, it did not affect the weighted mean and dispersion of the [Fe/H] and RV distributions. Our PM selection provides a set of robustly identified Hercules members and a new target list for further spectroscopic observations.
The comparison of our PM and colour-colour selected CMD with isochrones and synthetic CMDs confirmed the presence in Hercules of an old and metal-poor stellar population with a possible spread in metallicity consistent with that derived from spectroscopic observations and the age range 1–3 Gyr. Unfortunately, our photometric data do not reach the turn-off point preventing more precise estimates of age. However, we tend to exclude, although cannot totally rule out, that the overabundance of stars in the region above the red HB is due to the presence in Hercules of an intermediate-age population as old as 1 Gyr.
Finally, we have proven that our procedure to estimate star proper motions, based on the LBT, can be extended and applied to stellar systems out to large distances with high accuracy and with significant improvement on the membership identification.
6 Acknowledgements
We are grateful to the anonymous referee for useful comments that improve the manuscript. We would like to thank the LBC SDT team and the INAF LBT Queue run observers. Authors thank David Sand who provided the license to use the first-epoch LBC data. We are grateful to Josh Simon, Marla Geha and Evan Kirby for kindly providing spectroscopic data of Hercules stars. Support for this work was provided by INAFPRIN2010 (P.I. G. Clementini) and INAFPRIN2011 (P.I. M. Marconi). M.F. thanks STScI for support as a science visitor. M.C. has been supported by FIRB 2008 (P.I. G. Imbriani).
References
- Adén et al. (2011) Adén, D., Eriksson, K., Feltzing, S., et al. 2011, A&A, 525, A153
- Adén et al. (2009a) Adén, D., Feltzing, S., Koch, A., et al. 2009a, A&A, 506, 1147
- Adén et al. (2009b) Adén, D., Wilkinson, M. I., Read, J. I., et al. 2009b, ApJ, 706, L150
- Ahn et al. (2012) Ahn, C. P., Alexandroff, R., Allende Prieto, C., et al. 2012, ApJS, 203, 21
- Anderson et al. (2006) Anderson, J., Bedin, L. R., Piotto, G., Yadav, R. S., & Bellini, A. 2006, A&A, 454, 1029
- Anderson et al. (2008) Anderson, J., King, I. R., Richer, H. B., et al. 2008, AJ, 135, 2114
- Bellazzini et al. (2006) Bellazzini, M., Correnti, M., Ferraro, F. R., Monaco, L., & Montegriffo, P. 2006, A&A, 446, L1
- Bellini et al. (2011) Bellini, A., Anderson, J., & Bedin, L. R. 2011, PASP, 123, 622
- Bellini & Bedin (2010) Bellini, A. & Bedin, L. R. 2010, A&A, 517, A34
- Bellini et al. (2010) Bellini, A., Bedin, L. R., Piotto, G., et al. 2010, A&A, 513, A50+
- Belokurov et al. (2007) Belokurov, V., Zucker, D. B., Evans, N. W., et al. 2007, ApJ, 654, 897
- Bono et al. (2010) Bono, G., Stetson, P. B., Walker, A. R., et al. 2010, PASP, 122, 651
- Brown et al. (2012) Brown, T. M., Tumlinson, J., Geha, M., et al. 2012, ApJ, 753, L21
- Buonanno et al. (1997) Buonanno, R., Corsi, C., Bellazzini, M., Ferraro, F. R., & Pecci, F. F. 1997, AJ, 113, 706
- Cassisi et al. (2007) Cassisi, S., Potekhin, A. Y., Pietrinferni, A., Catelan, M., & Salaris, M. 2007, ApJ, 661, 1094
- Castelli & Kurucz (2003) Castelli, F. & Kurucz, R. L. 2003, in IAU Symposium, Vol. 210, Modelling of Stellar Atmospheres, ed. N. Piskunov, W. W. Weiss, & D. F. Gray, 20P
- Clementini et al. (2012) Clementini, G., Cignoni, M., Contreras Ramos, R., et al. 2012, ApJ, 756, 108
- Coleman et al. (2007) Coleman, M. G., de Jong, J. T. A., Martin, N. F., et al. 2007, ApJ, 668, L43
- Cusano et al. (2013) Cusano, F., Clementini, G., Garofalo, A., et al. 2013, ApJ, 779, 7
- Deason et al. (2012) Deason, A. J., Belokurov, V., Evans, N. W., Watkins, L. L., & Fellhauer, M. 2012, MNRAS, 425, L101
- Fagiolini et al. (2007) Fagiolini, M., Raimondo, G., & Degl’Innocenti, S. 2007, A&A, 462, 107
- Giallongo et al. (2008) Giallongo, E., Ragazzoni, R., Grazian, A., et al. 2008, aap, 482, 349
- Grebel (2005) Grebel, E. K. 2005, in IAU Colloq. 198: Near-fields cosmology with dwarf elliptical galaxies, ed. H. Jerjen & B. Binggeli, 1–10
- Jester et al. (2005) Jester, S., Schneider, D. P., Richards, G. T., et al. 2005, AJ, 130, 873
- Jordi et al. (2006) Jordi, K., Grebel, E. K., & Ammon, K. 2006, A&A, 460, 339
- Kirby et al. (2013) Kirby, E. N., Cohen, J. G., Guhathakurta, P., et al. 2013, ArXiv e-prints
- Kirby et al. (2008) Kirby, E. N., Simon, J. D., Geha, M., Guhathakurta, P., & Frebel, A. 2008, ApJ, 685, L43
- Klimentowski et al. (2007) Klimentowski, J., Łokas, E. L., Kazantzidis, S., et al. 2007, MNRAS, 378, 353
- Klypin et al. (1999) Klypin, A., Kravtsov, A. V., Valenzuela, O., & Prada, F. 1999, ApJ, 522, 82
- Koch et al. (2014) Koch, A., Hansen, T., Feltzing, S., & Wilkinson, M. I. 2014, ApJ, 780, 91
- Koch et al. (2008) Koch, A., McWilliam, A., Grebel, E. K., Zucker, D. B., & Belokurov, V. 2008, ApJ, 688, L13
- Kroupa (2001) Kroupa, P. 2001, MNRAS, 322, 231
- Lee (1994) Lee, Y.-W. 1994, ApJ, 430, L113
- Libralato et al. (2014) Libralato, M., Bellini, A., Bedin, L. R., et al. 2014, ArXiv e-prints
- Łokas (2009) Łokas, E. L. 2009, MNRAS, 394, L102
- Maraston (2005) Maraston, C. 2005, MNRAS, 362, 799
- Marconi et al. (2004) Marconi, M., Fiorentino, G., & Caputo, F. 2004, A&A, 417, 1101
- Martin et al. (2008) Martin, N. F., de Jong, J. T. A., & Rix, H.-W. 2008, ApJ, 684, 1075
- Martin & Jin (2010) Martin, N. F. & Jin, S. 2010, ApJ, 721, 1333
- Massari et al. (2013) Massari, D., Bellini, A., Ferraro, F. R., et al. 2013, ArXiv e-prints
- McCall (2004) McCall, M. L. 2004, AJ, 128, 2144
- Méndez et al. (2010) Méndez, R. A., Costa, E., Pedreros, M. H., et al. 2010, PASP, 122, 853
- Momany et al. (2003) Momany, Y., Cassisi, S., Piotto, G., et al. 2003, A&A, 407, 303
- Monelli et al. (2003) Monelli, M., Pulone, L., Corsi, C. E., et al. 2003, AJ, 126, 218
- Moore et al. (1999) Moore, B., Ghigna, S., Governato, F., et al. 1999, ApJ, 524, L19
- Musella et al. (2012) Musella, I., Ripepi, V., Marconi, M., et al. 2012, ApJ, 756, 121
- Okamoto et al. (2012) Okamoto, S., Arimoto, N., Yamada, Y., & Onodera, M. 2012, ApJ, 744, 96
- Pasquato et al. (2013) Pasquato, M., Raimondo, G., Brocato, E., et al. 2013, A&A, 554, A129
- Piatek et al. (2007) Piatek, S., Pryor, C., Bristow, P., et al. 2007, AJ, 133, 818
- Piatek et al. (2003) Piatek, S., Pryor, C., Olszewski, E. W., et al. 2003, AJ, 126, 2346
- Pietrinferni et al. (2004) Pietrinferni, A., Cassisi, S., Salaris, M., & Castelli, F. 2004, ApJ, 612, 168
- Pietrinferni et al. (2006) Pietrinferni, A., Cassisi, S., Salaris, M., & Castelli, F. 2006, ApJ, 642, 797
- Pietrinferni et al. (2013) Pietrinferni, A., Cassisi, S., Salaris, M., & Hidalgo, S. 2013, A&A, 558, A46
- Raimondo (2009) Raimondo, G. 2009, ApJ, 700, 1247
- Raimondo et al. (2005) Raimondo, G., Brocato, E., Cantiello, M., & Capaccioli, M. 2005, AJ, 130, 2625
- Robin et al. (2003) Robin, A. C., Reylé, C., Derrière, S., & Picaud, S. 2003, A&A, 409, 523
- Robin et al. (2004) Robin, A. C., Reylé, C., Derrière, S., & Picaud, S. 2004, A&A, 416, 157
- Salpeter (1955) Salpeter, E. E. 1955, ApJ, 121, 161
- Sand et al. (2009) Sand, D. J., Olszewski, E. W., Willman, B., et al. 2009, ApJ, 704, 898
- Simon & Geha (2007) Simon, J. D. & Geha, M. 2007, ApJ, 670, 313
- Speziali et al. (2008) Speziali, R., Di Paola, A., Giallongo, E., et al. 2008, in Society of Photo-Optical Instrumentation Engineers (SPIE) Conference Series, Vol. 7014, Society of Photo-Optical Instrumentation Engineers (SPIE) Conference Series
- Strigari et al. (2008) Strigari, L. E., Bullock, J. S., Kaplinghat, M., et al. 2008, Nature, 454, 1096
- Tollerud et al. (2008) Tollerud, E. J., Bullock, J. S., Strigari, L. E., & Willman, B. 2008, ApJ, 688, 277
- Walker et al. (2006) Walker, M. G., Mateo, M., Olszewski, E. W., et al. 2006, AJ, 131, 2114
- Walker et al. (2009) Walker, M. G., Mateo, M., Olszewski, E. W., et al. 2009, ApJ, 704, 1274
- White (1978) White, S. D. M. 1978, MNRAS, 184, 185
- Zacharias et al. (2013) Zacharias, N., Finch, C. T., Girard, T. M., et al. 2013, AJ, 145, 44