Unveiling the Secrets of Metallicity and Massive Star Formation Using DLAs along Gamma-ray Bursts
Abstract
We present the largest, publicly available, sample of Damped Lyman- systems (DLAs) along Swift discovered Gamma-ray Bursts (GRB) line of sights in order to investigate the environmental properties of long GRB hosts in the redshift range. Compared with the most recent quasar DLAs sample (QSO-DLA), our analysis shows that GRB-DLAs probe a more metal enriched environment at , up to . In the redshift range, despite the large number of lower limits, there are hints that the two populations may be more similar (only at 90% significance level) than at higher redshifts. Also, at high-, the GRB-DLA average metallicity seems to decline at a shallower rate than the QSO-DLAs: GRB-DLA hosts may be polluted with metals at least as far as kpc from the GRB explosion site, probably due to previous star-formation episodes and/or supernovae explosions. This shallow metallicity trend, extended now up to , confirms previous results that GRB hosts are star-forming and have, on average, higher metallicity than the general QSO-DLA population. Finally, our host metallicity measurements are broadly consistent with the predictions derived from the hypothesis of two channels of GRB progenitors, one of which is mildly affected by a metallicity bias, although more data are needed to constrain the models at .
1 Introduction
One of the fundamental aspects of the formation of the first stars and galaxies is the actual conversion of the primordial hydrogen clouds into the first massive, almost metal free, objects (Population III star, Barkana & Loeb, 2001). This first generation of stars, at , disappeared quite rapidly due primarily to strong negative feedback effects (Karlsson et al., 2013; Bromm, 2013; Yoshida et al., 2008; Greif et al., 2012; Chen et al., 2014). However, some of these objects and the following generation of stars probably ended their lives in very energetic explosions, either as pair-instability supernovae or as long Gamma-ray Bursts (GRB, see for a review Mészáros, 2013), which can be detected by current and future high-energy missions up to the highest redshifts.
Thanks to the Swift satellite (Gehrels et al., 2004), hundreds of GRBs have been discovered, even up to (Tanvir et al., 2009; Salvaterra et al., 2009; Cucchiara et al., 2011b). These high- GRBs can be used to test cosmic star-formation rate models as well as the cosmological chemical enrichment (Kistler et al., 2009; Robertson & Ellis, 2012; Tanvir et al., 2012; Salvaterra et al., 2012; Ritter et al., 2014). GRB progenitor models require massive, fast-rotating, and low-metallicity objects, (Galama et al., 1998; Woosley, 1993; Hjorth et al., 2003b; Woosley, 2011; Berger et al., 2011; Levan et al., 2014), although the discovery of few GRBs that might have occurred in a solar or even super solar metallicity environment challenges this paradigm (e.g. Prochaska et al., 2009; Savaglio et al., 2012; Krühler et al., 2012).
Afterglow absorption spectroscopy of GRBs provides a unique tool to determine the constituents of the GRB environment, in particular the amount of metals produced by past and on-going star-formation in the vicinity of the GRB explosion. This has important consequences for our understanding of the progenitor itself as well as the galaxies hosting GRBs throughout cosmic time. GRBs are identified, at first, based only on their high energy emission, therefore their hosts can be studied in great detail after the afterglow emission disappears, representing a sample of star-forming galaxies unbiased with respect to their intrinsic luminosity. In fact, it is possible to use GRBs and their hosts to trace cosmic star-formation in an independent way compared to magnitude limited Lyman-break galaxy surveys, although the effects of dust and metallicity biases are still under investigation (Trenti et al., 2014; Bouwens et al., 2014; Levesque et al., 2010; Modjaz et al., 2008; Trenti et al., 2013; Kocevski & West, 2011).
Similar to GRBs, quasars (QSO) have also been used for decades to study the effects of re-ionization, the conversion of neutral hydrogen into stars, and the cosmic metal enrichment. In fact QSOs, like GRB optical afterglows, are very bright and can be seen up to very high redshift. The spectra of QSOs often show the presence of intervening absorbers (at redshifts lower than the QSOs), some of which are associated with large reservoirs of neutral hydrogen along their lines of sights. In particular, Damped Lyman- systems (DLAs), by definition, have column density of neutral hydrogen , while sub-DLAs are defined as absorbers with column density (other types of subdivisions have been made, but they are not relevant for the purpose of this work). These absorbers, which often trace galaxies along the QSO lines of sight (e.g. Fynbo et al., 2011; Schulze et al., 2012), are the best laboratories to investigate the ISM, its evolution, and cosmic star-formation at high redshift, providing important constraints on galaxy evolution models (e.g. Wolfe et al., 2005; Fynbo et al., 2011; Neeleman et al., 2013; Krogager et al., 2013; Jorgenson & Wolfe, 2014; Christensen et al., 2014; Fumagalli et al., 2014; Rafelski et al., 2012).
Recently, Rafelski et al. (2014) have extended QSO-DLA studies up to : they show that the overall cosmological mean metallicity111The cosmic mean metallicity is defined as log , where is the redshift bin of DLAs as a function of redshift slowly decreases from up to (see also Jorgenson et al., 2013; Prochaska et al., 2003; Rafelski et al., 2012) and then it appears to drop rapidly below the extrapolated linear metallicity evolution, as if a sudden metallicity enrichment in DLAs occurs shortly after the end of re-ionization. GRB-DLAs, in which the DLA is inside the GRB host, have been sparsely studied (Fynbo et al., 2008b; Savaglio et al., 2012; Sparre et al., 2013; Arabsalmani et al., 2014), mainly due to the small sample size, the different data quality, and incompleteness. Nevertheless, Prochaska et al. (2007) have derived a higher metal content at for a set of GRB-DLAs with respect to a large sample of QSO-DLAs, suggesting that GRBs probe denser, more dust depleted, and metal rich regions then the QSO-DLAs population (see also Fynbo et al., 2013).
Finally, chemical evolution models suggest that DLAs metallicity measurements and relative abundance ratios at very high- enable us to better understand the effect of the primordial PopIII stars chemical enrichment (and IMF) onto subsequent PopII stars IMF (Salvadori & Ferrara, 2012; Kulkarni et al., 2013; Ritter et al., 2014).
The goal of this study is twofold: 1) compare the findings by Rafelski et al. (2014), hereafter R14, with a large sample of GRB-DLAs that extends previous studies (Prochaska et al., 2007; Savaglio, 2012; Arabsalmani et al., 2014); 2) investigate the metallicity evolution of GRB-DLAs and compare it with host galaxy metallicity predictions at different redshifts.
The paper is structured as follows: in the next section we will present our samples of GRB- and QSO-DLAs; in §3 we will describe our analysis, in §4 we will discuss our findings and possible biases, and in §5 we will summarize our results. Throughout the paper we adopted the solar metallicity measurements from Asplund et al. (2009), with solar abundance of [X/H]⊙ equal to 7.12 (Sulphur), 7.51 (Silicon), and 4.56 (Zinc).
2 Samples
2.1 Gamma-ray Burst DLAs
We select our GRB-DLAs sample from all the GRB afterglows observed during the 2000-2014 time span for which HI and metallicity measurements can be obtained (Table 1). In order to detect the Ly absorption line (1216 Å rest-frame) with most of the current spectrographs, a GRB has to be at least at in order for the line to be redshifted out of the atmospheric blue cut-off (which usually means a minimum observed wavelength limit of 3400 Å). GRB-DLA absorbers are unambiguously associated with the GRB host galaxies, since often fine-structure transitions (e.g. Fe ii* ) or the termination of Ly forest are identified at the same redshift of the Ly feature (Prochaska et al., 2006; Vreeswijk et al., 2007). The presented sample includes spectra obtained with different instrument resolutions: from low resolution (resolving power ) spectra obtained with the AlFOSC camera, to high resolution () obtained with the UVES instrument. Due to the transient nature of GRB afterglows, some spectra were obtained when the afterglow was quite faint and the resulting signal-to-noise of the acquired spectra is not uniform within the sample. We therefore exclude GRBs with (at usually 6000 Å), due to the unreliable detection of metal lines (see Section 3). All the data obtained with the Very Large Telescope (VLT) instruments were retrieved from the ESO Archive222Based on data obtained from the ESO Science Archive Facility or were available within our collaboration333http://grbspecdb.ucolick.org/. In few other cases we cannot obtain the raw data and we include the results from abundance analysis as they appear in the literature (e.g. GRB 050904 obtained with the FOCAS camera on the Subaru telescope). We include these systems in Table 1 and briefly describe each line of sight in Appendix A.
Our sample includes 13 GRB afterglow spectra obtained with the X-Shooter instrument mounted on the VLT. In order to analyze these data we primarily use our own customized pipeline written in IDL (Becker et al., private comm.) as it is optimized for point sources and has an improved sky subtraction procedure. Additionally, we used the official pipeline (version 2.5, within the REFLEX workflow (Freudling et al., 2013; Goldoni et al., 2006) to verify the output of our custom pipeline. For completeness, in the last column of Table 1 we report the literature reference where these data, if published, appear.
Among the GRBs in Table 1 there are 12 sub-DLAs and we exclude them from the subsequent analysis due to the fact that these absorbers may probe a different environment than the general DLA population. These objects will be studied in a companion paper (Cucchiara et al. in prep), where we will present a more detailed description of the ionization field in order to reproduce the observed absorption pattern (see for example Vreeswijk et al., 2013). We also exclude 4 GRBs where only upper limits on the could be placed (GRB 071020, GRB 051111, and GRB 080913, GRB 090323), but we report them for completeness. For other 4 GRB-DLAs only measurement were obtained but the is too low for reliably identifying any metal feature (GRB 020124, GRB 060522, GRB 080603B, and GRB 121201A). In summary our GRB-DLA sample comprises 55 GRB-DLA lines of sight (3 from the literature). Among these 55, we present metal abundances for 11 new GRB-DLA lines of sight.
2.2 Quasar DLAs
Thanks to the Sloan Digital Sky Survey large samples of quasars have been obtained up to . Thousands of these QSOs present DLAs along their lines of sight. We use the current most complete list of high-resolution QSO-DLA spectra obtained by Rafelski et al. (2012, hereafter R12) and R14, which extend previous work from, e. g., (Prochaska et al., 2003). All these QSOs have been observed with high-resolution spectrographs and have very high S/N, which are of great importance in order to resolve multiple narrow metal feature (see also Section 3.1) as well as to provide accurate metallicity measurements using different metal tracers.
3 Analysis
Our dataset allows us to assess ionic metal abundances directly from the afterglow spectra rather than relying on the literature. First, we select the spectra obtained with high-resolution spectrographs (which we defined at , see also Jorgenson et al. 2013) and high S/N, and compare them to the QSO-DLA sample that has been obtained with high-resolution instruments only (e.g. HIRES on the Keck telescopes). Second, as already presented by Prochaska (2006), abundance estimates (as well as the associate statistical error) obtained using low-resolution spectrographs are often under-estimated because of saturation effects, while blending may cause an over-estimation, and therefore the measurements should be cautiously used. As mentioned before, we perform our own analysis for the GRB line of sights and, in the following sections, we discuss in detail our results from the low-resolution sample. Our approach yields a more homogeneous sample, similar to the QSO-DLAs sample, for which the same procedure has been applied.
3.1 Low Resolution Sample
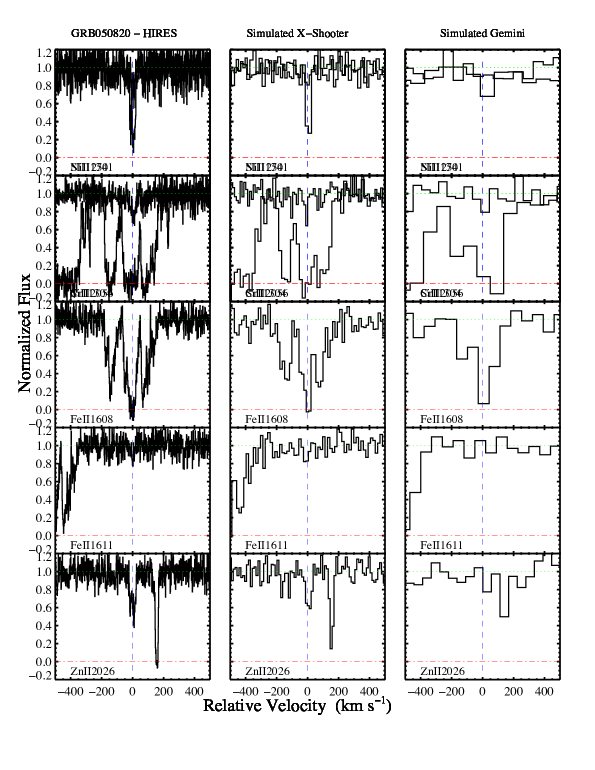
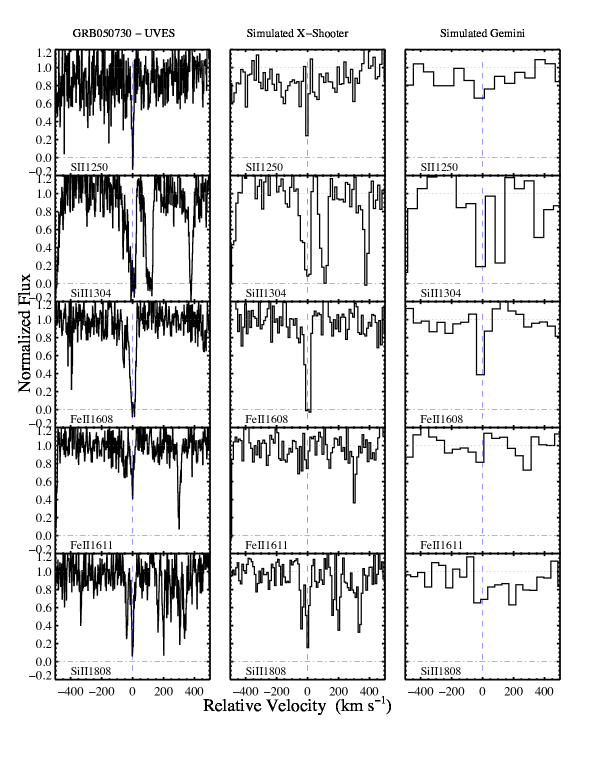
The consequences of low-resolution () spectroscopy on GRB-DLA abundance measurements via, e.g., Curve of Growth methodology (COG, Spitzer, 1978) has been already discussed in the literature (Prochaska, 2006; Jorgenson et al., 2013). Our large and diverse sample enables us to directly compare abundance measurements obtained for systems with different intrinsic metallicity. In the first column of Figures 1 and 2 we show line profiles for two systems observed with the VLT/UVES instrument which provides a resolution of 7 km s-1 (left column): GRB 050820A (Figure 1) is a GRB-DLA with intrinsic moderate metallicity (), while GRB 050730 is a metal poor system ()). In the second and third column we present the same spectra resampled at the resolution of our average X-Shooter and Gemini/GMOS instruments respectively. Three important effects are evident and require particular attention when estimating abundances with mid/low-resolution instruments: 1) blending of nearby lines, either from other transitions rising from the GRB-DLA system or from unrelated intervening systems, may occur in lower resolution spectra (this also makes the determination of the continuum level difficult, and even more so with low S/N data) 2) hidden saturated lines in low-resolution spectra may not be clearly identified and thereby yield a lower value then the true abundance; 3) strong absorption features associated with moderately metal rich systems are still detected at (or 200 km s-1, GMOS typical resolution), but they completely disappear or are difficult to distinguish at even lower resolution, providing un-interesting metallicity abundance limits.
In the first case, the result is an overestimation of metal abundances and de-blending procedures may be very complexed, especially when trying to asses further hidden saturation of the blended components. In the second, instead, the column density is underestimated. We therefore opted to use isolated weak lines (e.g. Fe ii 1608), or very strong transitions (e.g. Si ii 1526) which are likely saturated and therefore provide reasonable lower limits. In the third case it is impossible to distinguish between a true low-metallicity system and the effect of low-resolution instrumentation.
Since the majority of our spectra (34 over 55) have been obtained with and the remaining spectra with we adopt the latter as the minimum resolution for which we can derive accurate metallicity estimates. Therefore, for all the spectra with resolution lower than the X-Shooter spectrograph (typically ) and , we measured metallicity from strong lines and provided only lower limits for the ionic abundances. We note that this analysis is similar to Jorgenson et al. (2013), where ionic abundances from an even lower resolution instrument, like the MagE spectrograph on the Magellan telescope (), was compared with the X-shooter, UVES and HIRES instruments. Also, while “hidden” saturation can be still present, we carefully choose features with depths such to minimize this effect (Prochaska & Wolfe, 1996; Penprase et al., 2010), typically with normalized flux values in any pixel in the line profile. Jorgenson et al. (2013) have also preformed several simulations on the reliability of using the Apparent Optical Depth method technique in deriving ionic abundances in such spectra (AOD, Savage & Sembach, 1991) in comparison with Voigt profile fitting procedure. In order to further check this consistency we also performed a Voigt profile fitting for several ions in our X-Shooter and UVES spectra and compare these values with the ones obtained by our AOD analysis. The column densities agree with each other on average within one standard deviation. For these reasons (agreement between the AOD and Voigt profile methods, the fact that the majority of our spectra have , and that our comparison sample of QSO-DLAs metal abundances are also obtained with the AOD technique), we present our metallicity measurements derived with the AOD methodology in Table 1.
3.2 Neutral Hydrogen
For all the GRBs in Table 1 for which we were able to retrieve the afterglow spectra, we determine the redshift of the GRB-DLA based on the simultaneous identification of the strong Ly feature (identifiable also at low resolution) and at least one of the fine-structure transitions (like FeII* and NiII*) often present in GRB afterglow spectra (Prochaska et al., 2006; Vreeswijk et al., 2007; Prochaska et al., 2007). For those cases in which fine-structure lines were not observed, e.g. due to spectral coverage, we required, that at least other low ions transitions were detected at the same redshift of Ly, or that the end of the Ly forest was also identified.
We fit the Ly profile with a Voigt profile using the x_fitdla procedure within the XIDL444http://www.ucolick.org/xavier/IDL/ package, while we adopted the measurements derived in the literature if the spectra were not available (see notes in Table 1).
The QSO-DLAs measurements were obtained directly from R12 and R14, which performed a similar analysis on a sample of QSO spectra obtained with high-resolution spectrographs on the Keck telescope (e.g. HIRES or ESI).
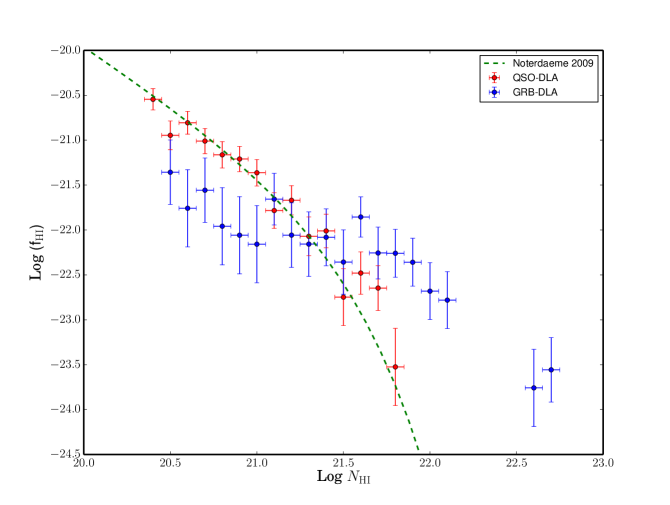
In Figure 3 we present the column density distribution (fHI(N,z)) of our two samples in comparison with the model by Noterdaeme et al. (2009) (see also Wolfe et al., 1995; Péroux et al., 2003; Prochaska & Wolfe, 2009; Noterdaeme et al., 2012b). As previously noted (Reichart & Price, 2002; Savaglio et al., 2003; Jakobsson et al., 2006; Prochaska et al., 2007), HI column density in QSO-DLAs is a factor of ten lower than the GRB-DLAs (although see Noterdaeme et al., 2012a, 2014) . This suggests that GRB-DLAs may trace a denser ISM phase, more similar to the sites of ongoing star formation (Fynbo et al., 2008b), while QSO-DLAs may probe, instead, a lower column density medium, possibly further from dense molecular regions. Moreover, a handful of GRBs with large amount of neutral hydrogen () along their line of sights exhibit the presence of molecular hydrogen (H2) (Prochaska et al., 2009; Krühler et al., 2013; D’Elia et al., 2014), while only in a few cases have been found along quasars (Noterdaeme et al., 2008; Srianand et al., 2012; Jorgenson et al., 2013, 2014).
3.3 Metallicity
Measuring the gas metal content in GRB-DLA systems is not simple, especially because some of the metals might be locked into dust grains (dust depletion effect, Savaglio et al., 2003). For example, the mildly refractory element silicon is usually depleted in the Galaxy, but only marginally in DLAs and therefore it can often be used to determine the gas metallicity (Wolfe et al., 2005; Rafelski et al., 2012), assuming that this also applies for GRB-DLAs. Other good metallicity tracers include sulfur and zinc. Zinc, in particular, is often preferred because it is un-depleted in the ISM and has two strong transitions at rest-frame 2026 Å and 2063 Å. However, it is only a trace element and therefore represents a small fraction of the mass density of the heavy element. Moreover, the evolution of zinc resembles iron only for specific star formation histories and careful modeling of zinc production by SN II and SN Ia shows an underproduction of Zn and Mg compared to S, invoking additional production site, such as intermediate-mass stars, in order to reconcile their abundance values(see Fenner et al., 2004, for a detailed descritpion). Therefore, as pointed out by Rafelski et al. (2012) and Prochaska (2006) we decided to use low-ionized transitions of sulfur (e.g. S ii 1250), silicon (e.g. Si ii 1808), and iron (e.g. Fe ii 1611), in order of importance. We only use the zinc lines in the few cases where the previously discussed lines are unavailable, such as when they fall at the location of atmospheric telluric bands.
We measured ionic abundances using the Apparent Optical Depth method (Savage & Sembach, 1991), which relies on the identification of several unsaturated lines of the same species and provides accurate measurements with no assumptions on the features Doppler parameter as other methods (like Curve-of-Growth analyses, Carroll & Ostlie, 1996). As we mention in the previous earlier these values well agree with the Voigt profile fitting technique.
In some cases, due to the presence of saturated transition, we only estimate lower limits on the overall metallicity (see also Savaglio & Fall, 2004; Savaglio, 2006; Prochaska, 2006). In fact, to be conservative we consider all our measurements from low-resolution data as lower limits.
In Table 1 we summarize our findings, including HI and metallicity measurements, as relative to solar555-log, and the ion used along that specific line of sight. No dust depletion or ionization correction have been applied (see Sections 4.3 and 4.2). In the last column we list the references relative to each GRB and, in the Appendix A, we briefly described each line of sight in more detail.
4 Discussion
4.1 Possible Observational Biases
First of all we need to understand if there are possible biases that might affect either samples: GRBs are selected solely on the prompt emission detection in the gamma-ray energy bands from dedicated satellites (e.g. Swift). The spectra were taken mostly independently of the brightness of the afterglow, although a preference in observing brighter events might be present. Neither of these two selection criteria (brightness in the gamma-ray bands or in the optical) seem to explain the difference in distribution (Figure 3). As previously noted by Pontzen et al. (2010), GRB-DLAs seem to probe a different type of absorbers than the QSO-DLA population. In particular, if the faint afterglows were not observed spectroscopically because some high level of extinction (like the “dark” GRBs from Perley et al., 2013), and assuming a possible correlation between metallicity and visual extinction (see Zafar & Watson, 2013), this would bias us towards lower metallicities. This, combined with a small number of metal-poor GRB-DLAs at high- suggests that, if such bias exists it would have a small effect, also because at high redshift there are less dusty systems (Covino et al., 2013). At , our understanding of dust production mechanisms (e.g. SN, AGB stars) are still to be fully understood, although some advancements have been made both theoretically and observationally (Gall et al., 2011). We also note that, similarly to these authors, we are assuming the extinction along the line of sight as the same as the one derived from afterglow studies, which in principle can lead to different estimates with respect to the hosts galaxy extinction (see Elliott et al., 2013; Perley et al., 2013, for a comparison between the afterglow- and host-derived extinction). Overall, despite the large sample presented here, our conclusions, in particular at high redshift, require more data in order to better assess the effect of such observational biases.
The QSOs sample from R12 and R14, instead, has been selected solely on the presence of a Ly line in their SDSS spectrum and log, therefore represent an unbiased sample with respect to the gas metallicity (Rafelski et al., 2012). The QSO-DLAs were selected based on the presence of Mg ii in the SDSS spectra, implying a small bias against low-metallicity systems at such redshift. Since our redshift range of interest is mostly at , this should not be a source of significant concern.
4.2 Ionization Correction
The identification of fine-structure transitions and the line profile variability within the first hour after the GRB explosion have been associated to the effect of an evolving radiation field from the GRB (like the afterglow) or nearby young stars onto the progenitor surrounding medium (Prochaska et al., 2006; Vreeswijk et al., 2007; De Cia et al., 2012). This processes directly affects metal abundance measurements and the inferred metallicity ionization correction is strongly dependent on the hydrogen column density (Vreeswijk et al., 2013).
Distinguishing between ionized (photoionized or excited) gas from the GRB emission in the vicinity of the GRB progenitor and the bulk of the host galaxy ISM, which is also ionized by the surroundings radiation field, is a complicated process: if the gas probed by the afterglow spectroscopy is close to the GRB (pc), then the ionization is increasing with time and complex modeling is required to estimate the time dependent ionization correction (Krongold & Prochaska, 2013). Probably, the most important example in which a detailed photoionization modeling (including photo-ionization and excitation effects) has been performed, is the sub-DLAs GRB 080310 (Vreeswijk et al., 2013). In most of our GRB-DLAs the data have been acquired at much later time and in several cases, when multiple spectra were obtained, these objects do not present line profile variation: such non-variability suggests that we are likely probing the ISM at larger distances and/or gas clouds unaffected by the GRB radiation.
Reassuringly, similar models to the ones of Vreeswijk et al. (2013) have been performed in GRB-DLAs spectra (Ledoux et al., 2009): ionization corrections are often minimal () compared to other even extreme cases, e.g. star-forming galaxies or Lyman- emitters. For these reasons we did not apply any ionization correction to our derived column densities and our final metallicity measurements. We stress that the ionization correction is an important aspect of the column density determination and requires particular attention and a much larger sample of rapid high-resolution spectroscopic observation sequences starting not later than a few minutes after the burst. While this is the least known quantity in our study we argue that our results are indicative of an overall general characterization of the GRB-DLA population. A large sample of multi-epochs high-resolution datasets and accurate modeling is still needed, but is beyond the scope of this paper.
4.3 Depletion Correction
Understanding the effect of dust depletion in DLAs requires the determination of ionic abundances of both refractory and non-refractory elements (see for example D’Elia et al., 2014). Savaglio & Fall (2004) determined for the first time such “depletion pattern”, while recently De Cia et al. (2013) compared a sample of 20 GRB-DLAs with 47 QSO-DLAs in order to study the dust-to-metal ratio of these systems. These authors used the [Fe/Zn] as dust indicator and found that the dust depletion correction is in the most depleted cases dex independently of metallicity.
These results are in contrast with R12 where strong iron depletion is present at . Instead, R12 shows that silicon is rarely depleted in QSO-DLAs and that depletion effects are relevant only at high metallicity (), therefore are minimal for the majority of our GRB lines of sights(see also Vladilo et al., 2011).
For our GRB-DLA sample, to calculate a depletion correction is not always possible, especially for our low resolution GRB-DLA spectra. Also, in the few cases where iron was used, we derived , so depletion correction should be minimal.
Nevertheless, the application of a depletion correction would increase the metallicity of our systems, strengthening some of our conclusions (see Section 5). Therefore, we choose not to apply any depletion correction to the measured metallicities. Finally, we performed -enhancement correction to the iron based metallicities for our high-resolution sample using the correction factors adopted by R12.
4.4 Metallicity Evolution
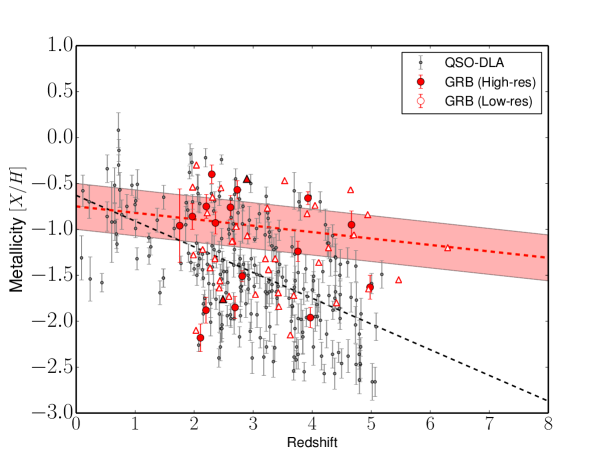
Our findings are shown in Figure 4, where the QSO-DLAs (in gray) and GRB-DLAs (in red) metallicities are plotted. We perform a linear fit of the metallicity measurements (and limits) with redshift using a survival analysis technique (Schmitt, 1985), which takes into account upper and lower limits. In particular we used the statistics.schmittbin package within the IRAF666IRAF is distributed by the National Optical Astronomy Observatory, which is operated by the Association of Universities for Research in Astronomy (AURA) under cooperative agreement with the National Science Foundation. distribution. We also used a bootstrap sampling in order to determine the 1-sigma error in the fit (with 500 iterations).
Ideally, we would like to use our metallicity measurements to investigate the cosmic metal budget at different epochs: this is usually done weighting the average metallicity over a specific redshift bin with the total neutral hydrogen column density in the same redshift interval (see R12 and R14 for the QSO-DLAs sample). Unfortunately, because the large number of limits present in the GRB-DLA sample we simply fit the metallicity of the single systems, which still provide useful insight on the DLA populations metal content.
For the GRB-DLA sample, we derive (thick red dashed line), which is also consistent with no-evolution (at the confidence level). For the QSO-DLA sample we derive a linear trend between redshift and DLA metallicity given by (thick black dashed line in Figure 4).
To test the reliability of our fit and how much this is sensitive to the small number of abundance measurements (with respecting the limits) we ran a series of Monte Carlo simulations: we created 1000 mock samples of GRB-DLAs metallicity measurements and limits (with values within the typical GRB-DLA high-resolution points RMS) and we repeated the survival analysis fit. Assuming an intrinsic true slope from the QSO-DLA distribution of we obtained a slope or less only in 7% of the cases, which means that it is unlikely that our results are affected by low number statistics. Similar tests with different intrinsic distribution (from flat to very steep metallicity evolution) provide similar results and reassure us that, despite the small number statistics, we can recover the input slopes to within the reported 1 confidence interval.
Finally, we point out that GRB-DLAs and QSO-DLAs have a similar metallicity distribution at , suggesting that there is no difference among the two populations of absorbers in terms of metal content. We performed a two-sample Kolmogorov-Smirnov test among these subsamples using the IRAF stsdas.analysis.statistics.twosampt task and we can rule out the null hypothesis that the two distributions are drawn from the same parent population at the 90% confidence level. Instead, if we naively consider the lower limits as actual measurements and apply an arbitrary correction of different values (from +0.1 to +0.3 dex), there remains evidence that the two distributions are distinct even with the highest value considered (+0.3 dex), but the statistical significance is .
However, the GRB-DLA metallicity declines suggests that, in particular at , GRB-DLA environment is more metal enriched than in QSO-DLAs, likely by active star-formation episodes. These metals may have been ejected by supernova explosions or mass losses and polluted the GRB progenitor’s neighborhood before the GRB occurred (Kröger et al., 2006; Mao, 2010; Matteucci & Recchi, 2001; Kulkarni et al., 2013). If this is true, the inferred metallicity may not reflect the overall metal content of such high- GRB host galaxies, although we know that the gas intercepted by GRB afterglow spectra may lie up to few kpc from the GRB explosion site (see next section).
4.5 Characterizing these DLA populations
We will now try to understand the different metallicity evolution between the GRB- and QSO-DLA samples. For example, if GRB-DLAs trace the general host galaxies ISM, this gas ionization state may show the effect of whatever local ionization field is in the vicinity of the GRB or along the line of sight.
Prochaska et al. (2007) argued that the size of such molecular cloud would exceed the largest molecular cloud in the local group, so the GRB-DLAs are tracing material as far as at least 100pc from the GRB (and even out to kpc in the case of GRB 060418, Vreeswijk et al., 2007). The fact that in the redshift range the metallicity of the gas is, on average of the solar value suggests that a substantial amount of metals are already present at high redshift.
These estimates are in agreement with the most recent GRB progenitor models (Woosley, 2011; Woosley & Heger, 2012): if the GRB host galaxy is metal rich, then a large amount of metals have been produced by SNe or, in the highest redshift bin observed, by a late population of PopIII stars (or more likely early PopII). Nevertheless, in order to be able to produce a GRB explosion from Wolf-Rayet type stars, the amount of metal injected into the ISM and mixed throughout the host galaxy has to be below a certain threshold to retain enough angular momentum and minimize the stellar mass loss of the progenitor (Woosley & Heger, 2006; Woosley, 2011; Woosley & Heger, 2012). Clearly more data need to be acquired, in particular at high- to confirm the existence of such limits, also in light of the high-metallicity hosts observed (e.g. Elliott et al., 2013; Krühler et al., 2012; Savaglio et al., 2012).
On the other hand, DLAs identified in QSO spectra are cross-section dependent, and therefore they might not trace the denser part of the galaxies (like for GRB-DLAs). Also, it has been proposed that a combined large sample of GRB- and QSO-DLAs may represent a complete census of star-forming galaxies that could be missed by magnitude limited surveys (Fynbo et al., 2008b).
Finally, as R14 pointed out, the observed metallicity decrement at suggests an increase in the covering fraction of neutral gas: similar behavior in fact can be produced by the combination of increased density of the Universe and lower background radiation field, which allows the hydrogen gas to be self-shielded at the lower density as function of redshift (Fumagalli et al., 2013). In this picture, the denser region would reside in the halo of the galaxies or in the IGM where the star-formation, and therefore metal enrichment, is lower.
4.6 GRB-DLA metallicity in context
A long standing debate exists as to the degree to which GRBs faithfully trace the cosmic star formation rate. Although GRBs have been associated with broad lined supernovae at low redshift and regions of active star formation in their host galaxies, spectroscopic observations have shown that GRB host galaxies tend to be relatively metal poor compared to SNe Ibc hosts (Modjaz et al., 2008). This observed preference for low metallicity environments may impart a redshift dependent bias in the type of star forming regions that can produce a GRB (Kocevski et al., 2009; Trenti et al., 2014).
In particular, at low redshifts (), a preference for low metallicity environments would limit GRBs to low mass spirals and dwarf galaxies (e.g. Levesque et al., 2010), due to the well established relationship between mass and metallicity (see Kocevski & West, 2011; Graham & Fruchter, 2013, and references therein). At higher redshifts, the mass range of galaxies capable of hosting a GRB would increase to include more massive, star forming galaxies, since the average metallicity of all galaxies in the Universe falls. Recent unbiased searches of GRB host galaxies like the THOUGH survey (Hjorth et al., 2012) or of the host galaxies of the “dark” GRB population (Perley et al., 2013) largely support this trend. These surveys find that bursts at intermediate redshifts tend to be drawn from star forming galaxies with a greater diversity of mass, morphology, and dust content, suggesting that high redshift GRBs may serve as more faithful tracers of cosmic star-formation compared to their low redshift counterparts (see also Hunt et al., 2014; Perley et al., 2014).
Our sample of GRB-DLAs, although not a complete host sample, covers a much greater redshift range than the emission line derived measurements in these studies and, more importantly, does not depend on strong observational biases (e.g. brightness of the host, intensity of the emission lines), although we may miss some dusty (therefore metal rich) events. Based on the arguments outlined above, even as metallicity biased tracers of star formation, the GRB-DLA results presented in Figure 4 should become more representative of the metallicity evolution of the general star forming galaxy population with increasing redshift. However, a better understanding of both observational biases (Fynbo et al., 2008a, b) and the effect of metallicity in GRB production (Jakobsson et al., 2013) are required before we can fully address the connection between the environments which are capable of producing GRBs and the conditions of star forming regions in the early Universe.
From a theoretical standpoint, recent simulations by Trenti et al. (2014) have been suggesting that two combined channels of GRB populations exist: one, the “collapsar” mode, which strictly depends on the host metallicity, and a second one, the “binary stars” mode, which is metallicity independent. Assuming these two modes coexist and the known mass-metallicity relation of star forming galaxies, these authors predict GRB host galaxies metallicity redshift evolution with different combinations of these two channels (from strong metallicity bias to an almost negligible one). Unfortunately, metallicity measurements from emission line diagnostics are not yet available for host galaxies, but our sample represents the best opportunity to test these models.
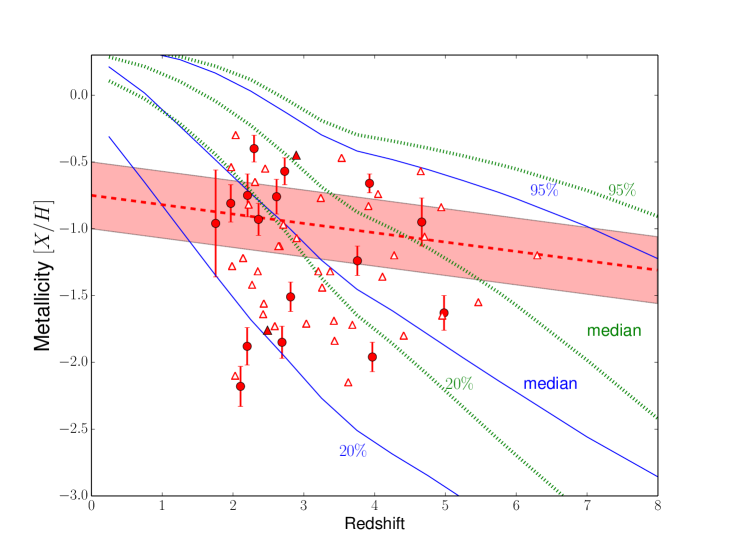
In Figure 5 we present our metallicity results in comparison the predicted metallicity for the upper 95%, the median, and the bottom 20% of the GRB host galaxies distribution, assuming an absent (dotted lines) and a moderate (solid lines) metallicity bias (adapted from Trenti et al., 2014, using a value of ).
These models essentially predict that in any given redshift bin, for example, 20% of the hosts that produce a GRB have metallicity below the lower solid line. Indeed, focusing on the redshift range, 5 over 27 hosts have metallicity below the line. On the other hand the “no-metallicity bias” model does not agree with the data. Overall, it seems that at least at a moderate metallicity bias is required in order to reconcile theory and observations (Vergani et al., 2014), although a more detailed analysis of these models and the implications on the metallicity cut-off in the GRB host masses is needed, in particular to understand the role of such metallicity bias, if indeed exists, at higher redshift.
5 Conclusions
In this work we investigated the properties of GRB lines of sight that show evidence for Damped Lyman- systems within the GRBs host galaxy. Similar systems have been studied along QSOs in order to understand the chemical enrichment and the metal evolution in cold gas systems over cosmic times.
We collected all the publicly available GRB afterglow spectra, including data already published in the literature and we uniformly analyzed these lines of sight in order to obtain metal abundances using mildly or non refractory species (e.g. sulphur, silicon, and zinc). In particular, we opted for a conservative approach when considering low-resolution data (see Section 3.1): we consider depletion correction to our metal abundance measurements a negligible effect (see Section 4.3). Also, we note that ionization correction may have an important role in estimates derived from very early time spectroscopic data ( minutes), due to the highly variable ionization flux from the GRB itself. Nevertheless, since most of our data have been acquired at much later times and the fact that detailed analyses are not always possible (especially with low-resolution data) we do not consider such correction in our analysis (see Section 4.2).
In Figure 4 we present our GRB-DLAs metallicity evolution fit in comparison with the QSO-DLA results from R12. We performed a detailed survival analysis fit to accurately take into account all the limits present in our dataset. As in previous works (Savaglio et al., 2012; Arabsalmani et al., 2014) we derive a much shallower decline of the GRB host metallicity with redshift relative to the QSO-DLA sample suggesting a somewhat metal rich environment for the GRB host galaxies (in particular at ), but still below solar values, in agreement with GRB progenitor models (Woosley & Heger, 2012). At there is a reasonable overlap between the two populations, according to their metallicity properties, indicating similarities between the two DLA populations, despite the higher HI column density traced by the GRB-DLAs. At higher redshift, GRB-DLAs seem to prefer higher metallicities than QSO-DLAs. Despite the small number of high-resolution data, a few lines of sight (e.g. GRB130606A or GRB060510B) seem to indicate that these GRB-DLAs point towards a denser, metal rich environment, likely tracing a less common population of metal-rich DLAs.
Overall, our findings confirm the idea that moving towards higher redshifts, GRBs trace preferentially a denser metal rich environment within galaxies, while the QSO-DLA population may be progressively dominated by neutral regions with minor star formation. In other words, the absence of metal poor GRB-DLAs at high- seems to indicate that such GRB-DLA hosts are at the low-end of the luminosity (or mass) distribution and do not present high star-formation (and GRB progenitors). Another possibility is that these GRBs occurred in a completely different environments (galactic haloes). Deep imaging, with 8-10 meter telescopes or with HST, is needed in order to fully characterize these hosts.
Finally, we compare our findings with the most recent model prediction of GRB host galaxy metallicities (Figure 5, Trenti et al., 2014). Our results broadly agree with host galaxy metallicity predictions where two-channels for GRB productions are considered (collapsars and binary) and mildly affected by a metallicity bias. The model predicts well the metallicity distribution for the bottom 20% and median of the host population, though more work is required to fully understand this metallicity bias and its effect on other properties of the GRB host population (e.g. the hosts mass limit driven by a metallicity cut-off Kocevski et al., 2009).
Our GRB-DLA host galaxies represent the largest sample available to date and, although not complete, it is suitable for multi band follow-up, in particular for the current and upcoming near-infrared spectroscopic instruments, which will allow to determine SFR and metallicities directly using emission line diagnostics. Also, the determination of the hosts properties, like mass and rest-frame UV star formation, will help in better characterizing the overall high- GRB host population, and their capability to harbor GRB progenitors. Furthermore, we will be able to better understand the observational biases that might affect our results, especially at high-, where few lines of sights are observed (including dust extinction and/or cosmic metallicity trend).
While multiband surveys of this sample of GRB-DLA hosts will allow a better characterization of these galaxies, the advent of future missions like JWST and the new generation of 30-m telescopes will be able to identify these faint hosts at the highest redshifts and spatially resolve the regions of star-formation traced by GRB-DLAs, which seem to hide the secrets of primordial star formation sites.
| GRB | log() | Ion | Fine- | Telescope/ | Resolution | S/N | Reference | ||
|---|---|---|---|---|---|---|---|---|---|
| Structure | Instrument | at 6000Å | per pixel | ||||||
| 000926 | 2.3621 | Zn | N | Keck/ESI | 20000 | 10 | [1] | ||
| 011211 | 2.1427 | Si | N | VLT/FORS2 | 2400 | 10 | [2] | ||
| 020124 | 3.198 | … | … | N | VLT/FORS1 | 450 | 4 | [3] | |
| 021004 | 2.3289 | … | … | Y | VLT/UVES | 40000 | 6 | [4][5] | |
| 030226 | 1.98 | Fe | Y | Keck/ESI | 20000 | 40 | [6] | ||
| 030323 | 3.3714 | S | Y | VLT/FORS2 | 2100 | 20 | [7] | ||
| 030429 | 2.658 | Si | N | VLT/FORS1 | 600 | 40 | [8] | ||
| 050319 | 3.24 | S | N | NOT/AlFOSC | 355 | 4 | [9][10] | ||
| 050401 | 2.899 | Zn | Y | VLT/FORS2 | 545 | 10 | [11] | ||
| 050505 | 4.27 | S | Y | Keck/LRIS | 1200 | 20 | [12] | ||
| 050730 | 3.96723 | S | Y | VLT/UVES | 40000 | 10 | [13][14] | ||
| 050820A | 2.6145 | S | Y | VLT/UVES | 40000 | 12 | [8] | ||
| Fe | Y | Keck/HIRES | 30000 | 10 | [14] | ||||
| 050904 | 6.26 | S | Y | Subaru/FOCAS | 1000 | 7 | [15] | ||
| 050908 | 3.344 | … | … | N | Gemini/GMOS | 1200 | 20 | [16] | |
| 050922C | 2.1996 | S | Y | VLT/UVES | 45000 | 10 | [17] | ||
| 051111 | 1.549 | … | … | Y | Keck/HIRES | 55000 | 20 | [18] | |
| 060115 | 3.533 | S | Y | VLT/FORS1 | 990 | 4 | [9] | ||
| 060124 | 2.3 | … | … | N | Keck/LRIS | 1200 | 18 | [9] | |
| 060206 | 4.048 | S | Y | Lick/KAST | 1200 | 28 | [9] | ||
| 060210 | 3.913 | Si | Y | Gemini/GMOS | 1200 | [9] | |||
| 060223A | 4.41 | S | N | Keck/LRIS | 1200 | … | [19] | ||
| 060510B | 4.94 | S | N | Gemini/GMOS | 1200 | 15 | [19] | ||
| 060522 | 5.11 | … | … | N | Keck/LRIS | 1200 | 2 | [19] | |
| 060526 | 3.221 | … | … | N | VLT/FORS1 | 1200b | 18 | [20] | |
| 060605 | 3.773 | … | … | Y | PMAS | 500 | 7 | [21] | |
| 060607A | 3.075 | … | … | Y | VLT/UVES | 55000 | 30 | [17] | |
| 060707 | 3.425 | Fe | Y | VLT/FORS2 | 800 | 7 | [22] | ||
| 060714 | 2.711 | Zn | Y | VLT/FORS1 | 800 | 30 | [22] | ||
| 060906 | 3.686 | S | N | VLT/FORS1 | 800 | 8 | [22] | ||
| 060926 | 3.206 | Zn | Y | VLT/FORS1 | 800 | 20 | [22] | ||
| 060927 | 5.464 | S | N | VLT/FORS1 | 500 | 3 | [23] | ||
| 061110B | 3.433 | S | Y | VLT/FORS1 | 800 | 10 | [9] | ||
| 070110 | 2.351 | Si | Y | VLT/FORS2 | 800 | 15 | [9] | ||
| 070411 | 2.954 | … | … | Y | VLT/FORS2 | 800 | 8 | [9] | |
| 070506 | 2.308 | Zn | N | VLT/FORS1 | 800 | 18 | [9] | ||
| 070721B | 3.628 | Si | Y | VLT/FORS2 | 800 | 5 | [9] | ||
| 070802 | 2.455 | Si | Y | VLT/FORS2 | 800 | 7 | [9] | ||
| 071020 | 2.145 | … | … | N | VLT/FORS2 | 800 | 5 | [9] | |
| 071031 | 2.692 | Fe | Y | VLT/UVES | 55000 | 10 | [24] | ||
| 080210 | 2.641 | Fe | Y | VLT/FORS2 | 1400 | 25 | [9][25] | ||
| 080310 | 2.427 | … | … | Y | VLT/UVES | 55000 | 30 | [17] | |
| 080413A | 2.433 | Zn | N | Gemini/GMOS | 1200 | 17 | [24] | ||
| 080603B | 2.69 | … | Y | NOT/AlFOSC | 355 | … | [9] | ||
| 080607 | 3.037 | Fe | Y | Keck/LRIS | 2000 | [9][26] | |||
| 080721 | 2.591 | S | N | VLT/FORS1 | 800 | 40 | [27] | ||
| 080804 | 2.20542 | Zn | N | VLT/UVES | 55000 | 10 | [9] | ||
| Zn | N | Gemini | 1200 | 10 | [10] | ||||
| 080810 | 3.35 | … | … | Y | NOT/AlFOSC | 400 | 8 | [28] | |
| … | … | Y | Keck/HIRES | 50000 | 30 | [28] | |||
| 080913 | 6.69 | … | … | N | VLT/FORS2 | 800 | 3 | [29] | |
| 081008 | 1.96 | S | Y | VLT/UVES | 40000 | 5 | [30] | ||
| S | Y | Gemini/GMOS | 1200 | 12 | this work | ||||
| 090205 | 4.64 | S | Y | VLT/FORS1 | 440 | 5 | [31] | ||
| 090323 | 3.5778 | … | … | Y | VLT/FORS2 | 1200 | 24 | [32][33] | |
| 090426 | 2.609 | … | … | N | Keck/LRIS | 1200 | 7 | [20] | |
| 090516 | 4.109 | Si | Y | VLT/FORS2 | 800 | 70 | [34] | ||
| 090809 | 2.73 | Si | Y | VLT/X-Shooter | 8000 | 12 | [35] | ||
| 090812 | 2.425 | Si | Y | VLT/FORS2 | 800 | 60 | [36] | ||
| 090926A | 2.1062 | S | Y | VLT/FORS2 | 780 | 35 | [37] | ||
| S | Y | VLT/X-Shooter | 10000 | 20 | [37] | ||||
| 100219A | 4.667 | S | Y | VLT/X-Shooter | 6000 | 6 | [38] | ||
| S | Y | Gemini/GMOS | 1200 | 7 | this work | ||||
| 100425A | 1.755 | Fe | Y | VLT/X-Shooter | 8000 | 4 | [35] | ||
| 110205A | 2.214 | S | Y | FAST | 2400 | 30 | [39] | ||
| 111008A | 4.98968 | Fe | Y | VLT/X-Shooter | 10000 | 10 | [40] | ||
| 111107A | 2.893 | S | Y | VLT/X-Shooter | 8000 | 5 | this work | ||
| 120327A | 2.813 | S | Y | VLT/X-Shooter | 8000 | 30 | [41] | ||
| 120716A | 2.487 | Fe | Y | VLT/X-Shooter | 8000 | 7 | this work | ||
| 120815A | 2.3574 | Zn | Y | VLT/XShooter | 10000 | 12 | [42] | ||
| 120909A | 3.9293 | S | Y | VLT/X-Shooter | 8000 | 9 | this work | ||
| 121024A | 2.2977 | Zn | Y | VLT/X-Shooter | 8000 | 15 | [43] | ||
| 121201A | 3.385 | … | … | VLT/X-Shooter | 8000 | this work | |||
| 130408A | 3.757 | S | Y | VLT/XShooter | 8000 | this work | |||
| S | Y | Gemini/GMOS | 1200 | this work | |||||
| 130505A | 2.2687 | Fe | Y | Gemini/GMOS | 1200 | this work | |||
| 130606A | 5.9134 | … | … | Y | Gemini/GMOS | 1200 | … | [44] | |
| 140226A | 1.9733 | Fe | N | keck/LRIS | 1200 | 30 | this work | ||
| 140311A | 4.953 | Ni | Y | Gemini/GMOS | 1200 | 7 | this work | ||
| 140419A | 3.961 | … | Y | Gemini/GMOS | 1200 | 20 | this work | ||
| 140423A | 3.258 | Fe | Y | Gemini/GMOS | 1200 | 20 | this work | ||
| 140518A | 4.7055 | S | Y | Gemini/GMOS | 1200 | 50 | this work |
Note. — List of the GRB-DLAs identified to date along GRB lines of sight. Missing metallicities are due to lack of metal line transitions or the low signal-to-noise of the spectra. When multiple measurements for the same line of sight are listed, the one derived from high resolution instrument is adopted in our analysis. Some values, either of or , are adopted from the literature reference listed in the last column. References: [1]Castro et al. (2003); [2]Vreeswijk et al. (2006); [3]Hjorth et al. (2003a); [4]Savaglio et al. (2002); [5]Fiore et al. (2005); [6]Shin et al. (2006); [7]Vreeswijk et al. (2004); [8]Jakobsson et al. (2004); [9]Fynbo et al. (2009); [10]Laskar et al. (2011); [11] Watson et al. (2006); [12]Berger et al. (2006); [13]D’Elia et al. (2007); [14]Prochaska et al. (2007); [15]Kawai et al. (2006); [16]Chen et al. (2007); [17]Fox et al. (2008); [18]Penprase et al. (2006); [19]Chary et al. (2007); [20]Thöne et al. (2010); [21]Ferrero et al. (2009); [22]Jakobsson et al. (2006); [23]Ruiz-Velasco et al. (2007); [24]Ledoux et al. (2009); [25]De Cia et al. (2011); [26]Prochaska et al. (2009); [27]Starling et al. (2009); [28]Page et al. (2009); [29] Patel et al. (2010); [30]D’Elia et al. (2011); [31]D’Avanzo et al. (2010); [32]Cenko et al. (2011); [33]Savaglio et al. (2012); [34]de Ugarte Postigo et al. (2012); [35]Skùladòttir (2010); [36]Rau et al. (2010); [37]D’Elia et al. (2010); [38]Thöne et al. (2013); [39]Cucchiara et al. (2011a); [40]Sparre et al. (2014); [41]D’Elia et al. (2014); [42]Krühler et al. (2013); [43]Friis et al. (2014); [44]Chornock et al. (2013).
References
- Arabsalmani et al. (2014) Arabsalmani, M., Møller, P., Fynbo, J. P. U., Christensen, L., Freudling, W., Savaglio, S., & Zafar, T. 2014, ArXiv e-prints
- Asplund et al. (2009) Asplund, M., Grevesse, N., Sauval, A. J., & Scott, P. 2009, ARA&A, 47, 481
- Barkana & Loeb (2001) Barkana, R. & Loeb, A. 2001, Phys. Rep., 349, 125
- Berger et al. (2011) Berger, E. et al. 2011, ApJ, 743, 204
- Berger et al. (2006) Berger, E., Penprase, B. E., Cenko, S. B., Kulkarni, S. R., Fox, D. B., Steidel, C. C., & Reddy, N. A. 2006, ApJ, 642, 979
- Bouwens et al. (2014) Bouwens, R. J. et al. 2014, ArXiv e-prints
- Bromm (2013) Bromm, V. 2013, Reports on Progress in Physics, 76, 112901
- Carroll & Ostlie (1996) Carroll, B. W. & Ostlie, D. A. 1996, An Introduction to Modern Astrophysics
- Castro et al. (2003) Castro, S., Galama, T. J., Harrison, F. A., Holtzman, J. A., Bloom, J. S., Djorgovski, S. G., & Kulkarni, S. R. 2003, ApJ, 586, 128
- Castro-Tirado et al. (2010) Castro-Tirado, A. J. et al. 2010, A&A, 517, A61
- Cenko et al. (2011) Cenko, S. B. et al. 2011, ApJ, 732, 29
- Chary et al. (2007) Chary, R., Berger, E., & Cowie, L. 2007, ApJ, 671, 272
- Chen et al. (2007) Chen, H.-W., Prochaska, J. X., Ramirez-Ruiz, E., Bloom, J. S., Dessauges-Zavadsky, M., & Foley, R. J. 2007, ApJ, 663, 420
- Chen et al. (2014) Chen, K.-J., Bromm, V., Heger, A., Jeon, M., & Woosley, S. 2014, ArXiv e-prints
- Chornock et al. (2013) Chornock, R., Berger, E., Fox, D. B., Lunnan, R., Drout, M. R., Fong, W.-f., Laskar, T., & Roth, K. C. 2013, ApJ, 774, 26
- Chornock et al. (2014) Chornock, R., Fox, D. B., Cucchiara, A., Perley, D. A., & Levan, A. 2014, GRB Coordinates Network, 16301, 1
- Christensen et al. (2014) Christensen, L., Møller, P., Fynbo, J. P. U., & Zafar, T. 2014, ArXiv e-prints
- Covino et al. (2013) Covino, S. et al. 2013, MNRAS, 432, 1231
- Cucchiara et al. (2011a) Cucchiara, A. et al. 2011a, ApJ, 743, 154
- Cucchiara et al. (2011b) — 2011b, ApJ, 736, 7
- D’Avanzo et al. (2010) D’Avanzo, P. et al. 2010, A&A, 522, A20
- De Cia et al. (2011) De Cia, A. et al. 2011, MNRAS, 412, 2229
- De Cia et al. (2012) — 2012, A&A, 545, A64
- De Cia et al. (2013) De Cia, A., Ledoux, C., Savaglio, S., Schady, P., & Vreeswijk, P. M. 2013, A&A, 560, A88
- de Ugarte Postigo et al. (2012) de Ugarte Postigo, A. et al. 2012, A&A, 548, A11
- D’Elia et al. (2011) D’Elia, V., Campana, S., Covino, S., D’Avanzo, P., Piranomonte, S., & Tagliaferri, G. 2011, MNRAS, 418, 680
- D’Elia et al. (2007) D’Elia, V. et al. 2007, A&A, 467, 629
- D’Elia et al. (2010) — 2010, A&A, 523, A36
- D’Elia et al. (2014) — 2014, A&A, 564, A38
- Elíasdóttir et al. (2009) Elíasdóttir, Á. et al. 2009, ApJ, 697, 1725
- Elliott et al. (2013) Elliott, J. et al. 2013, A&A, 556, A23
- Fenner et al. (2004) Fenner, Y., Prochaska, J. X., & Gibson, B. K. 2004, ApJ, 606, 116
- Ferrero et al. (2009) Ferrero, P. et al. 2009, A&A, 497, 729
- Fiore et al. (2005) Fiore, F. et al. 2005, ApJ, 624, 853
- Fox et al. (2008) Fox, A. J., Ledoux, C., Vreeswijk, P. M., Smette, A., & Jaunsen, A. O. 2008, A&A, 491, 189
- Freudling et al. (2013) Freudling, W., Romaniello, M., Bramich, D. M., Ballester, P., Forchi, V., García-Dabló, C. E., Moehler, S., & Neeser, M. J. 2013, A&A, 559, A96
- Friis et al. (2014) Friis, M. et al. 2014, ArXiv e-prints
- Fumagalli et al. (2014) Fumagalli, M., O’Meara, J. M., Prochaska, J. X., Kanekar, N., & Wolfe, A. M. 2014, ArXiv e-prints
- Fumagalli et al. (2013) Fumagalli, M., O’Meara, J. M., Prochaska, J. X., & Worseck, G. 2013, ApJ, 775, 78
- Fynbo et al. (2013) Fynbo, J. P. U. et al. 2013, MNRAS, 436, 361
- Fynbo et al. (2005) — 2005, ApJ, 633, 317
- Fynbo et al. (2008a) Fynbo, J. P. U., Hjorth, J., Malesani, D., Sollerman, J., Watson, D., Jakobsson, P., Gorosabel, J., & Jaunsen, A. O. 2008a, in The Eleventh Marcel Grossmann Meeting On Recent Developments in Theoretical and Experimental General Relativity, Gravitation and Relativistic Field Theories, ed. H. Kleinert, R. T. Jantzen, & R. Ruffini, 726–735
- Fynbo et al. (2009) — 2009, ApJS, 185, 526
- Fynbo et al. (2011) — 2011, MNRAS, 413, 2481
- Fynbo et al. (2008b) Fynbo, J. P. U., Prochaska, J. X., Sommer-Larsen, J., Dessauges-Zavadsky, M., & Møller, P. 2008b, ApJ, 683, 321
- Fynbo et al. (2006) Fynbo, J. P. U. et al. 2006, A&A, 451, L47
- Galama et al. (1998) Galama, T. J. et al. 1998, Nature, 395, 670
- Gall et al. (2011) Gall, C., Hjorth, J., & Andersen, A. C. 2011, A&A Rev., 19, 43
- Gehrels et al. (2004) Gehrels, N. et al. 2004, ApJ, 611, 1005
- Goldoni et al. (2006) Goldoni, P., Royer, F., François, P., Horrobin, M., Blanc, G., Vernet, J., Modigliani, A., & Larsen, J. 2006, in Society of Photo-Optical Instrumentation Engineers (SPIE) Conference Series, Vol. 6269, Society of Photo-Optical Instrumentation Engineers (SPIE) Conference Series
- Graham & Fruchter (2013) Graham, J. F. & Fruchter, A. S. 2013, ApJ, 774, 119
- Greif et al. (2012) Greif, T. H., Bromm, V., Clark, P. C., Glover, S. C. O., Smith, R. J., Klessen, R. S., Yoshida, N., & Springel, V. 2012, MNRAS, 424, 399
- Grevesse & Sauval (1998) Grevesse, N. & Sauval, A. J. 1998, Space Sci. Rev., 85, 161
- Hjorth et al. (2012) Hjorth, J. et al. 2012, ApJ, 756, 187
- Hjorth et al. (2013) Hjorth, J., Melandri, A., Malesani, D., Kruehler, T., & Xu, D. 2013, GRB Coordinates Network, 14365, 1
- Hjorth et al. (2003a) Hjorth, J. et al. 2003a, ApJ, 597, 699
- Hjorth et al. (2003b) — 2003b, Nature, 423, 847
- Hunt et al. (2014) Hunt, L. K. et al. 2014, A&A, 565, A112
- Jakobsson et al. (2013) Jakobsson, P., Chapman, R., Hjorth, J., Malesani, D., Fynbo, J. P. U., Milvang-Jensen, B., Kruhler, T., & Tanvir, N. R. 2013, ArXiv e-prints
- Jakobsson et al. (2006) Jakobsson, P. et al. 2006, A&A, 460, L13
- Jakobsson et al. (2004) — 2004, A&A, 427, 785
- Jorgenson et al. (2013) Jorgenson, R. A., Murphy, M. T., & Thompson, R. 2013, MNRAS, 435, 482
- Jorgenson et al. (2014) Jorgenson, R. A., Murphy, M. T., Thompson, R., & Carswell, R. F. 2014, ArXiv e-prints
- Jorgenson & Wolfe (2014) Jorgenson, R. A. & Wolfe, A. M. 2014, ApJ, 785, 16
- Karlsson et al. (2013) Karlsson, T., Bromm, V., & Bland-Hawthorn, J. 2013, Reviews of Modern Physics, 85, 809
- Kawai et al. (2006) Kawai, N. et al. 2006, Nature, 440, 184
- Kistler et al. (2009) Kistler, M. D., Yüksel, H., Beacom, J. F., Hopkins, A. M., & Wyithe, J. S. B. 2009, ApJ, 705, L104
- Kocevski & West (2011) Kocevski, D. & West, A. A. 2011, ApJ, 735, L8
- Kocevski et al. (2009) Kocevski, D., West, A. A., & Modjaz, M. 2009, ApJ, 702, 377
- Krogager et al. (2013) Krogager, J.-K. et al. 2013, MNRAS, 433, 3091
- Kröger et al. (2006) Kröger, D., Hensler, G., & Freyer, T. 2006, A&A, 450, L5
- Krongold & Prochaska (2013) Krongold, Y. & Prochaska, J. X. 2013, ApJ, 774, 115
- Krühler et al. (2012) Krühler, T. et al. 2012, A&A, 546, A8
- Krühler et al. (2013) — 2013, A&A, 557, A18
- Kulkarni et al. (2013) Kulkarni, G., Rollinde, E., Hennawi, J. F., & Vangioni, E. 2013, ApJ, 772, 93
- Laskar et al. (2011) Laskar, T., Berger, E., & Chary, R.-R. 2011, ApJ, 739, 1
- Lazzati et al. (2006) Lazzati, D., Perna, R., Flasher, J., Dwarkadas, V. V., & Fiore, F. 2006, MNRAS, 372, 1791
- Ledoux et al. (2009) Ledoux, C., Vreeswijk, P. M., Smette, A., Fox, A. J., Petitjean, P., Ellison, S. L., Fynbo, J. P. U., & Savaglio, S. 2009, A&A, 506, 661
- Levan et al. (2014) Levan, A. J. et al. 2014, ApJ, 781, 13
- Levesque et al. (2010) Levesque, E. M., Kewley, L. J., Berger, E., & Zahid, H. J. 2010, AJ, 140, 1557
- Mao (2010) Mao, J. 2010, ApJ, 717, 140
- Matteucci & Recchi (2001) Matteucci, F. & Recchi, S. 2001, ApJ, 558, 351
- Mészáros (2013) Mészáros, P. 2013, Astroparticle Physics, 43, 134
- Modjaz et al. (2008) Modjaz, M. et al. 2008, AJ, 135, 1136
- Neeleman et al. (2013) Neeleman, M., Wolfe, A. M., Prochaska, J. X., & Rafelski, M. 2013, ApJ, 769, 54
- Noterdaeme et al. (2012a) Noterdaeme, P. et al. 2012a, A&A, 540, A63
- Noterdaeme et al. (2008) Noterdaeme, P., Ledoux, C., Petitjean, P., & Srianand, R. 2008, A&A, 481, 327
- Noterdaeme et al. (2012b) Noterdaeme, P. et al. 2012b, A&A, 547, L1
- Noterdaeme et al. (2009) Noterdaeme, P., Petitjean, P., Ledoux, C., & Srianand, R. 2009, A&A, 505, 1087
- Noterdaeme et al. (2014) Noterdaeme, P., Petitjean, P., Pâris, I., Cai, Z., Finley, H., Ge, J., Pieri, M. M., & York, D. G. 2014, A&A, 566, A24
- Page et al. (2009) Page, K. L. et al. 2009, MNRAS, 400, 134
- Patel et al. (2010) Patel, M., Warren, S. J., Mortlock, D. J., & Fynbo, J. P. U. 2010, A&A, 512, L3
- Penprase et al. (2006) Penprase, B. E. et al. 2006, ApJ, 646, 358
- Penprase et al. (2010) Penprase, B. E., Prochaska, J. X., Sargent, W. L. W., Toro-Martinez, I., & Beeler, D. J. 2010, ApJ, 721, 1
- Perley et al. (2013) Perley, D. A. et al. 2013, ApJ, 778, 128
- Perley et al. (2014) — 2014, ArXiv e-prints
- Péroux et al. (2003) Péroux, C., McMahon, R. G., Storrie-Lombardi, L. J., & Irwin, M. J. 2003, MNRAS, 346, 1103
- Pontzen et al. (2010) Pontzen, A. et al. 2010, MNRAS, 402, 1523
- Price et al. (2007) Price, P. A. et al. 2007, ApJ, 663, L57
- Prochaska (2006) Prochaska, J. X. 2006, ApJ, 650, 272
- Prochaska et al. (2006) Prochaska, J. X., Chen, H.-W., & Bloom, J. S. 2006, ApJ, 648, 95
- Prochaska et al. (2007) Prochaska, J. X., Chen, H.-W., Dessauges-Zavadsky, M., & Bloom, J. S. 2007, ApJ, 666, 267
- Prochaska et al. (2008) Prochaska, J. X., Dessauges-Zavadsky, M., Ramirez-Ruiz, E., & Chen, H.-W. 2008, ApJ, 685, 344
- Prochaska et al. (2003) Prochaska, J. X., Gawiser, E., Wolfe, A. M., Cooke, J., & Gelino, D. 2003, ApJS, 147, 227
- Prochaska et al. (2009) Prochaska, J. X. et al. 2009, ApJ, 691, L27
- Prochaska & Wolfe (1996) Prochaska, J. X. & Wolfe, A. M. 1996, ApJ, 470, 403
- Prochaska & Wolfe (2009) — 2009, ApJ, 696, 1543
- Rafelski et al. (2014) Rafelski, M., Neeleman, M., Fumagalli, M., Wolfe, A. M., & Prochaska, J. X. 2014, ApJ, 782, L29
- Rafelski et al. (2012) Rafelski, M., Wolfe, A. M., Prochaska, J. X., Neeleman, M., & Mendez, A. J. 2012, ApJ, 755, 89
- Rau et al. (2010) Rau, A. et al. 2010, ApJ, 720, 862
- Reichart & Price (2002) Reichart, D. E. & Price, P. A. 2002, ApJ, 565, 174
- Ritter et al. (2014) Ritter, J. S., Sluder, A., Safranek-Shrader, C., Milosavljevic, M., & Bromm, V. 2014, ArXiv e-prints
- Robertson & Ellis (2012) Robertson, B. E. & Ellis, R. S. 2012, ApJ, 744, 95
- Ruiz-Velasco et al. (2007) Ruiz-Velasco, A. E. et al. 2007, ApJ, 669, 1
- Salvadori & Ferrara (2012) Salvadori, S. & Ferrara, A. 2012, MNRAS, 421, L29
- Salvaterra et al. (2012) Salvaterra, R. et al. 2012, ApJ, 749, 68
- Salvaterra et al. (2009) — 2009, Nature, 461, 1258
- Sanchez-Ramirez et al. (2012) Sanchez-Ramirez, R. et al. 2012, GRB Coordinates Network, 14035, 1
- Savage & Sembach (1991) Savage, B. D. & Sembach, K. R. 1991, ApJ, 379, 245
- Savaglio (2006) Savaglio, S. 2006, New Journal of Physics, 8, 195
- Savaglio (2012) — 2012, Astronomische Nachrichten, 333, 480
- Savaglio & Fall (2004) Savaglio, S. & Fall, S. M. 2004, ApJ, 614, 293
- Savaglio et al. (2003) Savaglio, S., Fall, S. M., & Fiore, F. 2003, ApJ, 585, 638
- Savaglio et al. (2002) Savaglio, S. et al. 2002, GRB Coordinates Network, 1633, 1
- Savaglio et al. (2012) — 2012, MNRAS, 420, 627
- Schady et al. (2011) Schady, P., Savaglio, S., Krühler, T., Greiner, J., & Rau, A. 2011, A&A, 525, A113
- Schmitt (1985) Schmitt, J. H. M. M. 1985, ApJ, 293, 178
- Schulze et al. (2012) Schulze, S. et al. 2012, A&A, 546, A20
- Shin et al. (2006) Shin, M.-S. et al. 2006, ArXiv Astrophysics e-prints
- Skùladòttir (2010) Skùladòttir, A. 2010, Master Thesis, Univ. of Copenhagen
- Sparre et al. (2013) Sparre, M. et al. 2013, ArXiv e-prints
- Sparre et al. (2014) — 2014, ApJ, 785, 150
- Spitzer (1978) Spitzer, L. 1978, Physical processes in the interstellar medium
- Srianand et al. (2012) Srianand, R., Gupta, N., Petitjean, P., Noterdaeme, P., Ledoux, C., Salter, C. J., & Saikia, D. J. 2012, MNRAS, 421, 651
- Starling et al. (2009) Starling, R. L. C. et al. 2009, MNRAS, 400, 90
- Tanvir et al. (2013) Tanvir, N. R., Cucchiara, A., & Cenko, S. B. 2013, GRB Coordinates Network, 14366, 1
- Tanvir et al. (2009) Tanvir, N. R. et al. 2009, Nature, 461, 1254
- Tanvir et al. (2012) — 2012, ApJ, 754, 46
- Tanvir et al. (2014) Tanvir, N. R., Levan, A. J., Wiersema, K., Petric, A., Chiboucas, K., & Miller, J. 2014, GRB Coordinates Network, 16150, 1
- Thöne et al. (2013) Thöne, C. C. et al. 2013, MNRAS, 428, 3590
- Thöne et al. (2010) — 2010, A&A, 523, A70
- Trenti et al. (2014) Trenti, M., Perna, R., & Jimenez, R. 2014, ArXiv e-prints
- Trenti et al. (2013) Trenti, M., Perna, R., & Tacchella, S. 2013, ApJ, 773, L22
- Vergani et al. (2014) Vergani, S. D. et al. 2014, ArXiv e-prints
- Vladilo et al. (2011) Vladilo, G., Abate, C., Yin, J., Cescutti, G., & Matteucci, F. 2011, A&A, 530, A33
- Vreeswijk et al. (2004) Vreeswijk, P. M. et al. 2004, A&A, 419, 927
- Vreeswijk et al. (2013) — 2013, A&A, 549, A22
- Vreeswijk et al. (2007) — 2007, A&A, 468, 83
- Vreeswijk et al. (2006) — 2006, A&A, 447, 145
- Watson et al. (2006) Watson, D. et al. 2006, ApJ, 652, 1011
- Wolfe et al. (2005) Wolfe, A. M., Gawiser, E., & Prochaska, J. X. 2005, ARA&A, 43, 861
- Wolfe et al. (1995) Wolfe, A. M., Lanzetta, K. M., Foltz, C. B., & Chaffee, F. H. 1995, ApJ, 454, 698
- Woosley (1993) Woosley, S. E. 1993, ApJ, 405, 273
- Woosley (2011) — 2011, ArXiv e-prints
- Woosley & Heger (2006) Woosley, S. E. & Heger, A. 2006, ApJ, 637, 914
- Woosley & Heger (2012) — 2012, ApJ, 752, 32
- Yoshida et al. (2008) Yoshida, N., Omukai, K., & Hernquist, L. 2008, Science, 321, 669
- Zafar & Watson (2013) Zafar, T. & Watson, D. 2013, A&A, 560, A26
Appendix A Description of relevant spectra
A.1 GRB000926
Our results confirm the finding published in the literature. The low-resolution data though allow to place only a lower limit based on the Zn ii lines (also consistent with Prochaska, 2006).
A.2 GRB011211
Our examination of the FORS spectrum allows to place a lower limit based on the Si ii line of , consistent with the result of (Prochaska, 2006).
A.3 GRB020124
We derived similar value to the published work of Hjorth et al. (2003a), but the spectrum is too low S/N to provide an adequate metallicity measurement.
A.4 GRB021004
A.5 GRB030226
We also notice the presence of an intervening system along this sightline at . Based on some isolated Iron lines we place a lower limit on this GRB-DLA consistent with the measurement of (Shin et al., 2006). Our iron-derived metallicity limit is consistent also with the measurement reported by (Schady et al., 2011), considering the large uncertainty in the HI estimate (0.3 dex).
A.6 GRB030323
A.7 GRB030429
The spectra has been presented before Jakobsson et al. (2004). The lower limit in the metallicity is given by the few detected lines (e.g. Si ii).
A.8 GRB050319
A.9 GRB050401
The spectrum was presented by Watson et al. (2006). We obtain similar results and adopt a value of based on Zn ii line measurement.
A.10 GRB050505
The metallicity we derived from sulfur measurements is similar to what has been presented by Berger et al. (2006), though we consider this to be a lower limit.
A.11 GRB050730
A.12 GRB050820
A.13 GRB050904
A.14 GRB050908
This is a sub-DLA system, so it is included for completeness.
A.15 GRB050922C
A.16 GRB051111
Only upper limit has been derived for this GRB.
A.17 GRB060115
These date are part of the compilation from Fynbo et al. (2009). Our estimated lower limit is mostly based on S ii lines.
A.18 GRB060124
This is a sub-DLA system, so it is included for completeness.
A.19 GRB060206
Our analysis is consistent with the results of Fynbo et al. (2006), but we consider our estimated value of a lower limit, based on the strength of the same sulphur lines.
A.20 GRB060210
This GRB spectrum shows the presence of a nearby intervening systems at . Despite its presence a stringent lower limit of can be placed based on iron and silicon lines.
A.21 GRB060223
The value from Chary et al. (2007) has been adopted.
A.22 GRB060510B
A.23 GRB060522
The value of from Chary et al. (2007) has been adopted, but there are no metal lines detected.
A.24 GRB060526
This is a sub-DLA system, so is included for completeness.
A.25 GRB060605
This is a sub-DLA system, so is included for completeness.
A.26 GRB060607A
This is a sub-DLA system, so is included for completeness.
A.27 GRB060707
We confirm the analysis of Jakobsson et al. (2006), but the low-resolution data allows only to place a conservative lower limit of based on weak Fe ii transitions.
A.28 GRB060714
The spectrum has a higher and similarly to GRB060707 we could derive a lower limit, but in this case we used Zn ii lines (Jakobsson et al., 2006).
A.29 GRB060906
A.30 GRB060926
For this GRB we used likely saturated Zn ii lines and place a lower limit of .
A.31 GRB060927
A.32 GRB061110B
A.33 GRB070110
This spectrum is part of the compilation of Fynbo et al. (2009), we performed our own metallicity measurement.
A.34 GRB070411
This is a sub-DLA system, so is included for completeness.
A.35 GRB070506
This spectrum is part of the compilation of Fynbo et al. (2009). We also identified an intervening system at . We derived a metallicity lower limit for the host from Zn ii lines.
A.36 GRB070721B
This spectrum is part of the compilation of Fynbo et al. (2009). The low-resolution of this spectrum allows only a lower limit estimate from Si ii.
A.37 GRB070802
This spectrum is part of the compilation of Fynbo et al. (2009) and has been studied by Elíasdóttir et al. (2009). The low-resolution of this spectrum allows only a lower limit estimate from blended Si ii: we are a bit more conservative than a previous work by Elíasdóttir et al. (2009), but the two values are within 0.1 dex, which is below the typical uncertainty for these low-resolution datasets.
A.38 GRB071020
This GRB is likely a sub-DLA system, so is included for completeness.
A.39 GRB071031
A.40 GRB080210
A.41 GRB080310
This GRB is likely a sub-DLA system, so is included for completeness.
A.42 GRB080413A
A.43 GRB080607
This GRB spectrum was presented by Prochaska et al. (2009) and it shows for the first time the clear presence in a GRB afterglow spectrum of H2 molecular lines. Using different metallicity tracers, we retrieve similar values for the metallicity limits ().
A.44 GRB080721
This spectrum was presented by Starling et al. (2009). We derived a more conservative lower limit, using multiple -elements lines.
A.45 GRB080804
The spectrum was presented by Fynbo et al. (2009). We determine the metallicity and relative depletion using Iron as well as non-refractory elements.
A.46 GRB080810
This GRB is likely a sub-DLA system, so is included for completeness.
A.47 GRB080913
This GRB is likely a sub-DLA system, so is included for completeness.
A.48 GRB081008
This spectrum has been presented by D’Elia et al. (2011). We obtained similar metallicity estimate. We also analyzed a Gemini/GMOS spectrum from which we derived consistent lower limits. We used our UVES spectrum measurements.
A.49 GRB090205
This line of sight appears in D’Avanzo et al. (2010). In particular, we note that these author reported sulfur column abundance from blended profiles. We derived a similar metallicity lower limit of .
A.50 GRB090323
This GRB has a complex structure, with two absorbers within 600km s-1 Savaglio et al. (2012), one of which is a sub-DLA. Due to the complexity of this line of sight and the low-resolution of the VLT/FORS spectrum, we exclude GRB 090323 from our analysis. We report the metallicity in Table 1 for completeness.
A.51 GRB090426
This GRB is likely a sub-DLA system, so is included for completeness.
A.52 GRB090516
These data were presented by de Ugarte Postigo et al. (2012), but only equivalent widths were provided. Our analysis of the low-resolution VLT/FORS2 spectrum results in a lower limit of the metallicity of .
A.53 GRB090809
A.54 GRB090812
These data were presented by de Ugarte Postigo et al. (2012). We estimated a lower limit based on alpha-elements absorption features.
A.55 GRB090926
A.56 GRB100219
This spectrum was presented by Thöne et al. (2013). We supplement this dataset with a Gemini/GMOS spectrum. We also reanalyzed the X-Shooter spectrum. Our measurement is slightly higher then the one presented by these authors, but within their error (0.2 dex).
A.57 GRB100425
We analyzed this dataset using the phase 3 products provided by the ESO database. Our metallicity lower limit is consistent with the one derived by Skùladòttir (2010).
A.58 GRB110205
This spectrum was already presented by Cucchiara et al. (2011a).
A.59 GRB111008A
This X-Shooter spectrum was presented by Sparre et al. (2014). Our Iron and sulfur metallicity estimate are consistent with the ones presented in this work. We report the former as metallicity tracer.
A.60 GRB111107A
This X-Shooter spectrum has not been presented in previous work. The signal-to-noise of the spectra is low, and therefore our metallicity measurement, based on saturated sulphur lines, has to be considered a lower limit.
A.61 GRB120327A
This spectrum has been published by D’Elia et al. (2014). Our sulphur measurement agrees with these authors.
A.62 GRB120716A
This spectrum has not been published in the literature before. The spectrum was obtained 2.6 days after the GRB has been discovered. Despite the low we report a metallicity of based on identified iron lines.
A.63 GRB120815A
This GRB spectrum has been published by Krühler et al. (2013). Our analysis is consistent with these authors results.
A.64 GRB120909A
This X-Shooter spectrum has not been presented before. We derive metallicity measurements from weak Iron lines as well -elements.
A.65 GRB121024A
This X-Shooter spectrum has been recently presente by Friis et al. (2014). We also identified multiple systems at and an intervening one at (corresponding to 400 km s-1). Fine-structure transitions are identified in correspondence of system, suggesting that the cloud at is at large distance from the GRB radiation field. The broad, saturated Ly profiles makes hard to discern between the two components. Therefore we opted for considering them as one single absorber. The metallicity from zinc lines is reported in Table 1, while from iron lines we can infer a large depletion factor (see Friis et al., 2014, for a detailed analysis).
A.66 GRB121201A
This X-Shooter spectrum was preliminary presented in GCN only (Sanchez-Ramirez et al., 2012). This line of sight present a possible Ly emission line. Unfortunately the signal to noise is low (S/N) and at the line redshift () it is difficult to identify metal lines unambiguously. We therefore decide to report only the neutral hydrogen column density.
A.67 GRB130408A
A.68 GRB130505A
We present our Gemini spectrum for the first time. We identified several absorption lines, and we were able to determine a lower limit on the metallicity based on iron weak transition (Fe ii1608).
A.69 GRB130606A
This spectrum has been published by Chornock et al. (2013). The line of sight present signature of a likely sub-DLA system, therefore we present this value here for completeness.
A.70 GRB140226A
This spectrum was obtained by the Keck/LRIS instrument. Several metal lines have been identified, but the low-resolution of this instrument allows to place only a metallicity lower limit from Iron and Sulphur lines.
A.71 GRB140311A
This spectrum was obtained by our collaboration and present few metal absorption features. We were only able to place a lower limit on the metallicity based on nickel lines, since sulphur lines seems contaminated by other lines.
A.72 GRB140419A
This is a sub-DLA system, so is included for completeness.
A.73 GRB140423A
We present our analysis on our Gemini/GMOS spectrum (Tanvir et al., 2014). Based on -elements lines and weak iron lines (e.g. Fe ii 1608) we were able to place a lower limit on the metallicity.
A.74 GRB140518A
This data have not been published before, but preliminary analysis appears in Chornock et al. (2014). Our metallicity limit comes from saturated sulphur transitions.