Beryllium monohydride (BeH): Where we are now, after 86 years of spectroscopy
Abstract
BeH is one of the most important benchmark systems for ab initio methods and for studying Born-Oppenheimer breakdown. However the best empirical potential and best ab initio potential for the ground electronic state to date give drastically different predictions in the long-range region beyond which measurements have been made, which is about cm-1 for 9BeH, cm-1 for 9BeD, and cm-1 for 9BeT. Improved empirical potentials and Born-Oppenheimer breakdown corrections have now been built for the ground electronic states of all three isotopologues. The predicted dissociation energy for 9BeH from the new empirical potential is now closer to the current best ab initio prediction by more than 66% of the discrepancy between the latter and the previous best empirical potential. The previous best empirical potential predicted the existence of unobserved vibrational levels for all three isotopologues, and the current best ab initio study also predicted the existence of all of these levels, and four more. The present empirical potential agrees with the ab initio prediction of all of these extra levels not predicted by the earlier empirical potential. With one exception, all energy spacings between vibrational energy levels for which measurements have been made, are predicted with an agreement of better than 1 cm-1 between the new empirical potential and the current best ab initio potential, but some predictions for unobserved levels are still in great disagreement, and the equilibrium bond lengths are different by orders of magnitude.
pacs:
02.60.Ed , 31.50.Bc , 82.80.-d , 31.15.ac, 33.20.-t, , 82.90.+j, 97, , 98.38.-j , 95.30.KyWith only 5e-, BeH is the simplest neutral open shell molecule, and is therefore of paramount importance in benchmarking ab initio methods. It has been the subject of a plethora of ab initio studies Cade and Huo (1967); Chan (1968); Bender and Davidson (1969); Jungen and Ahlrichs (1970); Mulliken (1971); Popkie (1971); Bagus (1973); Gerratt and Raimondi (1980); Cooper (1984); Larsson (1984, 1985); Henriet and Verhaegen (1986); Petsalakis et al. (1992); Li and Paldus (1995); Martin (1998); Machado et al. (1998); Petsalakis et al. (1999); Meiß ner and Paldus (2000); Fülscher and Serrano-Andrés (2002); Bruna and Grein (2003); Bubin and Adamowicz (2007); Pitarch-Ruiz et al. (2008a, b); Koput (2011), with the first Hartree-Fock level endeavor being in 1967. It is also the second lightest neutral heteronuclear molecule after LiH, and the only neutral diatomic for which spectroscopic measurements on a tritium isotopologue have been performed, making it currently the best benchmark system apart from H2 for studying the breakdown of the Born-Oppenheimer approximation Martin (1998); Le Roy et al. (2006a); Bubin and Adamowicz (2007); Koput (2011); Dattani and Welsh (2014). Due to its simplicity, BeH is expected to be present in astronomical contexts such as exoplanetary atmospheres, cool stars, and the interstellar medium Yadin et al. (2012), but in the context of astronomy, has only been found on our Sun, in the two studies described in Wohl (1971); Shanmugavel et al. (2008). Finally, the extraordinarily long half-life of the halo nucleonic atom 11Be makes 11BeH a compelling candidate for the formation of the first halo nucleonic molecule Dattani and Welsh (2014).
Spectroscopic measurements on 9BeH date back to 1928 Watson (1928); Peterson (1928), and on 9BeD date back to 1935 Koontz (1935). By 1937 there was already an octad of publications on the molecule Watson (1928); Peterson (1928); Watson (1929); Watson and Parker (1930); Watson (1931); Olsson (1932); Koontz (1935); Watson and Humphreys (1937). Since then, higher-resolution spectra have been measured for both of these isotopologues, and also for 9BeT in De Greef and Colin (1974). Before the present paper, the most thorough empirical analysis of 9BeH, 9BeD, and 9BeT was that of Le Roy et al. (2006a), where empirical potentials were built for all three isotopologues, based on a fit to data from De Greef and Colin (1974); Colin et al. (1983); Focsa et al. (1998); Shayesteh et al. (2003); Le Roy et al. (2006a).
This state of the art 2006 empirical study left behind various mysteries which remained unsolved for the last 8 years:
-
1.
The 2006 study predicted that the 9BeH dissociation energy was cm-1 Le Roy et al. (2006a) which is higher than the value of cm-1 in the 1975 experimental study Colin and De Greef (1975) by more than the latter’s uncertainty. The most recent ab initio study (published in 2011) of 9BeH Koput (2011) predicted its dissociation energy to be cm-1 which is another 112 cm-1 higher than the 2006 value, and is higher than the 1975 value by almost three times the latter’s estimated uncertainty.
-
2.
The 2006 analysis was unable to determine a meaningful value for the leading term of the adiabatic BOB (Born-Oppenheimer breakdown) correction function, which helps define the isotopologue shifts in and .
-
3.
The 2006 potentials predicted the existence of 1 more vibrational level for 9BeH, 3 more vibrational levels for 9BeD, and 15 more vibrational levels for 9BeT than have ever been observed in experiments. The 2011 ab initio study then predicted the extra levels, but also one further vibrational level for 9BeH, 2 further levels for 9BeD, and 1 further vibrational level for 9BeT (!).
As mentioned in the final section of the 2006 paper Le Roy et al. (2006a), the predictions of the unobserved vibrational levels in that study were questionable. In fact the large uncertainty in the predicted value of , the inability to determine a meaningful value of , and the lack of confidence in the predictions of the unobserved vibrational levels were all the result of:
-
1.
the fact that the highest vibrational level at which data were available, for any isotopologue, was cm-1 below the dissociation limit, and
-
2.
the study used an EMO (expanded Morse oscillator) model for the potential, which dies off faster than exponentially with respect to the internuclear distance , while theory dictates that for very large , the potential should approach the dissociation asymptote with an inverse-power form (much more slowly than the EMO model does).
No new data has been published for any of the BeH isotopologues, so the cm-1 gap in spectroscopic guidance still presents a challenge. However, by using a model superior to the EMO we:
-
1.
are able to bring the for BeH closer to the 2011 ab initio value by more than 66% of the size of the discrepancy between the 2006 and 2011 values,
-
2.
are able to determine with an estimated uncertainty of cm-1,
- 3.
-
4.
The present fit to the same spectroscopic data as in 2006, is also able to reproduce the measured energy transitions on average about 7% closer than the 2006 potential, with far fewer digits in its parametrization.
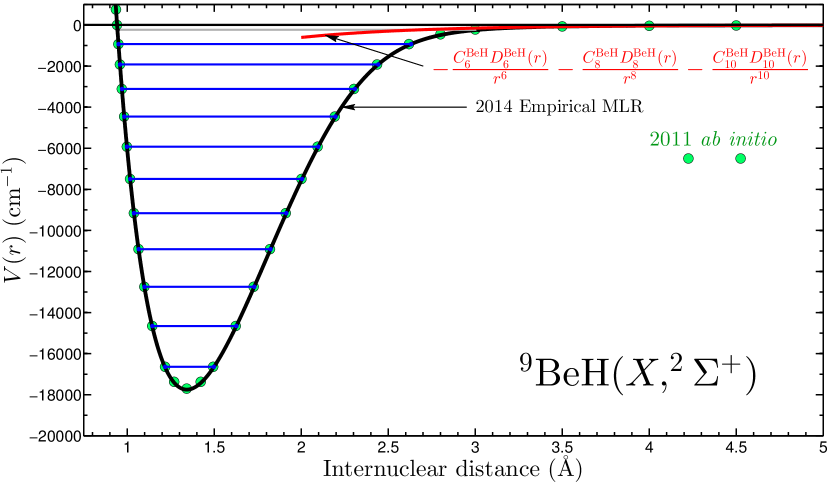
The 2006 study used the EMO model because there was reason to believe that the long-range tail of the rotationless potential had a barrier (see discussion and references in the fourth paragraph of this paper’s Conclusions section). However, the 2011 ab initio calculation Koput (2011) has earned our trust (it predicted all but one of the 9BeH, 9BeD, and 9BeT vibrational spacings in the data region to within 1 cm-1 of the spacings given by the 2006 empirical potential), and it shows no signs of the existence of a rotationless barrier. Furthermore, the theoretical long-range potential based on the tremendously accurate long-range constants ( , and ) which were recently calculated Mitroy (2014) for BeH (presented in Table 1), also suggests that there is no barrier or turning points in the long-range.
| Atom 1 | Atom 2 | |||
|---|---|---|---|---|
| Be | ∞H | 34.77918 | 1 213.132 | 46 593.36 |
| Be | T | 34.79610 | 1 213.825 | 46 624.91 |
| Be | D | 34.80452 | 1 214.171 | 46 640.62 |
| Be | H | 34.82984 | 1 215.209 | 46 687.87 |
This eliminates any doubt that there may have been, that we should not use the more accurate MLR (Morse/Long-range) model for the potential, whose structure is very similar to the EMO for moderate values of the internuclear distance , but unlike the EMO the correct long-range form of the potential according to theory, is promised by the mathematical structure of the MLR. In fact, in 2011 an MLR potential was fitted to spectroscopic data for the -state of 6,6Li2 and 7,7Li2, where there was a gap of more than 5000 cm-1 between data near the bottom of the potential’s well, and data at the very top Dattani and Le Roy (2011). In 2013 spectroscopic measurements were made in the very middle of this gap, and it was found that the vibrational energies predicted by the MLR potential from Dattani and Le Roy (2011) were correct to about 1 cm-1 Semczuk et al. (2013). This means that the MLR model can be capable of making very accurate predictions outside of the data range, which is particularly pertinent for the present case of BeH which at the moment still suffers from the issues mentioned above.
I The new potential
With the exception of using an improved model for the BeH adiabatic potential energy function and the BOB correction functions and , we fit the same Hamiltonian to the same data set as used in the 2006 empirical analysis of BeH Le Roy et al. (2006a). Instead of using the EMO model of the 2006 study, we use the MLR model for , exactly as described for the -state of Li2 in 2011Dattani and Le Roy (2011). We also use the exact same definitions of and as in that Li2 study Dattani and Le Roy (2011); the only difference from those used in the 2006 BeH study is the use of two separate Surkus powers in : and , rather than just .
For each reference isotopologue, the long-range coefficients were taken from Table 1. Relativistic effects were not taken into account in the calculation of these long-range coefficients because the relativistic correction for hydrogen is expected to be about 10 times smaller than the finite-mass correction Mitroy (2014), and the overall error due to neglecting relativistic effects was expected to be smaller than the error due to the Be structure model Mitroy (2014). Likewise, finite mass corrections for 9Be were smaller than the estimated uncertainty in the overall values of the long-range coefficients Mitroy (2014). While this was also true for the isotopes of hydrogen, the differences across the three isotopes are expected to be reliable Mitroy (2014).
The final MLR potential and BOB correction function parameters are presented in Table 2.
| MLR | BOB | BOB | |||
|---|---|---|---|---|---|
| 17664(200) cm-1 | cm-1 | ||||
| Å | 85.07 cm-1 | ||||
| a.u. | 23.51 cm-1 | ||||
| a.u. | 51.10 cm-1 | ||||
| a.u. | 75.10 cm-1 | ||||
| 1.21862088 | cm-1 | ||||
| 1.9636945 | |||||
| 7.598094 | |||||
| 14.16754 | |||||
| 15.2569 | |||||
| 9.2876 | |||||
| 2.52 | |||||
| [pm] | [am] | [cm-1] | [cm-1] | [cm-1] | [cm-1] | [cm-1] | [cm-1] | |
|---|---|---|---|---|---|---|---|---|
| 9BeH | ||||||||
| 2014 Empirical | 134.239 6(2) | - | 17 664(200) | - | 10.165 63 | - | 1.026 7 | - |
| 2011 ab initio Koput (2011) | 134.144 | 95 600 | 17 702 | 38 | 10.165 0 | -0.000 63 | 1.027 2 | -0.000 5 |
| 2006 Empirical Le Roy et al. (2006a) | 134.239 40(12) | 200 | 17 590(200) | 74 | 10.165 71 | -0.000 08 | 1.027 2 | -0.000 5 |
| 9BeD | ||||||||
| 2014 Empirical | 134.172 8(2) | - | 17 759(200) | - | 5.625 3 | - | 0.313 0 | - |
| 2011 ab initio Koput (2011) | 134.124 | 48 800 | 17 711 | 48 | 5.626 0 | 0.000 7 | 0.313 0 | 0.000 0 |
| 2006 Empirical Le Roy et al. (2006a) | 134.171 97(12) | 8 300 | 17 597 | 161 | 5.625 3 | 0.000 0 | 0.312 8 | 0.000 2 |
| 9BeT | ||||||||
| 2014 Empirical | 134.150 4(2) | - | 177 62(200) | - | 4.106 1 | - | 0.166 4 | - |
| 2011 ab initio Koput (2011) | 134.117 | 33 400 | 17 715 | 47 | 4.106 7 | -0.000 6 | 0.166 4 | 0.000 0 |
| 2006 Empirical Le Roy et al. (2006a) | 134.149 51(12) | 8 900 | 17 599 | 163 | 4.106 0 | -0.000 1 | 0.166 3 | 0.000 1 |
II Comparison with 2006 empirical and 2011 ab initio potentials
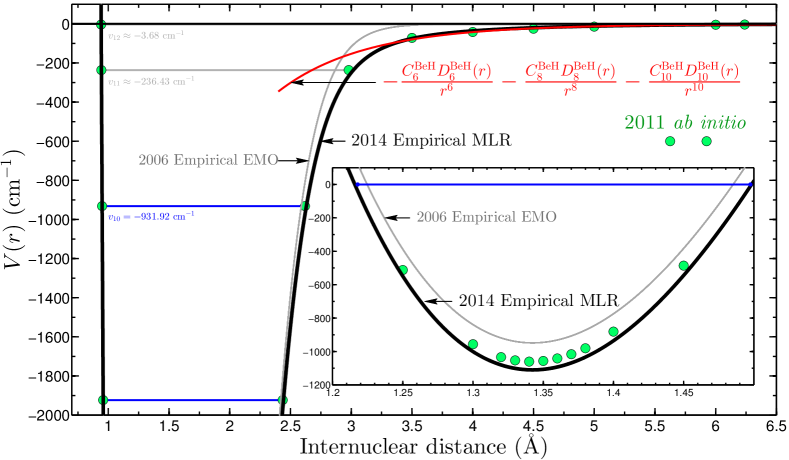
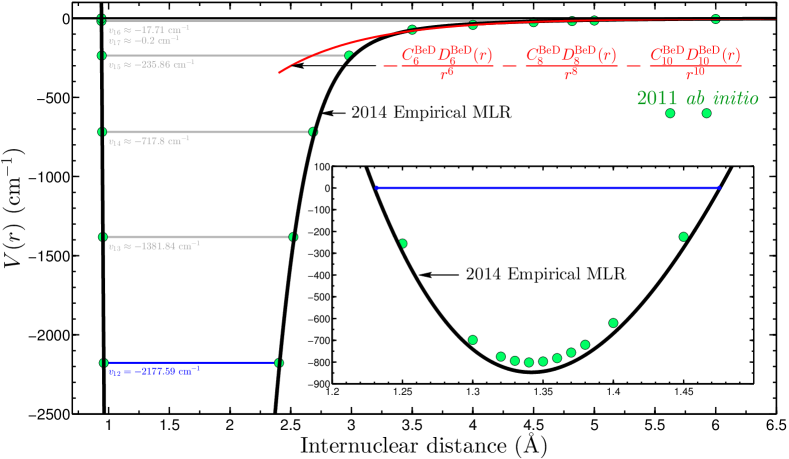
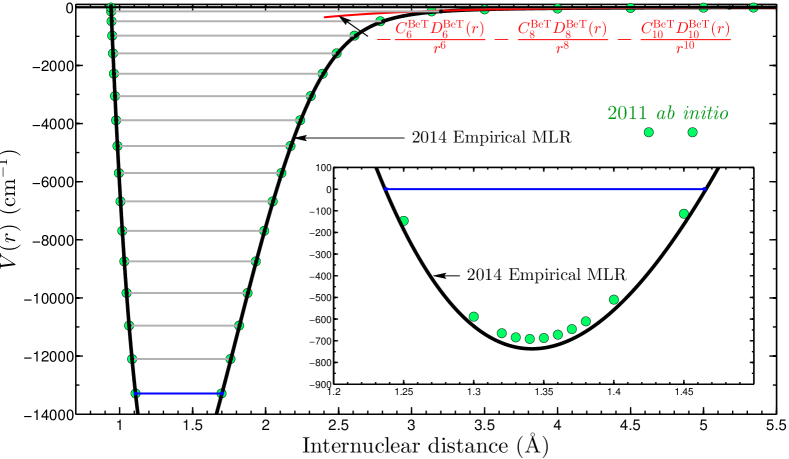
In Figs 1, 2, 3 and 4 the final adiabatic potentials for all three isotopologues are compared to the 2006 EMO model results and to the 2011 ab initio results. While ab initio potentials with varying amounts of included theory were discussed in the original paper Koput (2011), all figures, tables and discussion about rotationless potentials in this paper refer to the final adiabatic potentials for each isotopologue, referred in the original paper as “CV + F + R + D” to indicate the use of MR-ACPF/aug-cc-pCV7Z(i) (denoted by CV), an estimate of electron correlation effects beyond the approximations of MR-ACPF (denoted by F), second-order Douglas-Kroll-Hess (DKH) scalar relativistic corrections (denoted by R) and mass-dependent diagonal BOB corrections (denoted by D). Furthermore, the 2011 ab inito study of Koput (2011) also included non-adiabatic BOB corrections for the calculation of rotational constants and centrifugal distortion constants . The values of these constants with the non-adiabatic corrections taken into account were not presented in the original paper Koput (2011), but were generously provided by the author for the present comparison.
No point-wise representation for these final (CV + F + R + D) potentials were listed in the original paper Koput (2011), but they were generously provided by the author for the present paper. The point-wise representation for each isotopologue listed the (CV + F + R + D) potential at 48 different internuclear distances, which when all plotted in Figs 1, 2, 3 and 4, proved to make the figures messy. Therefore these points were only plotted for fairly large values of , and for small values of , cubic splines were created through the dense meshes of ab initio points, and points were only plotted from the interpolant at certain places chosen to maximize readability.
| 2006 Empirical | 2011 ab initio | 2014 Empirical | 2006 Empirical | 2011 ab initio | 2014 Empirical | ||||
| Le Roy et al. (2006a) | Koput (2011) | [Present work] | Le Roy et al. (2006a) | Koput (2011) | [Present work] | [] | |||
| 9BeH | |||||||||
| -16567.7651 | -16679.67 | -16641.7725 | ZPE | 1021.290 | 1022.33 | ||||
| -14581.3475 | -14693.12 | -14655.3569 | 1986.4176 | 1986.55 | 1986.4156 | -0.13 | |||
| -12670.8937 | -12782.57 | -12744.9033 | 1910.4538 | 1910.55 | 1910.4536 | -0.10 | |||
| -10838.5033 | -10950.10 | -10912.5124 | 1832.3904 | 1832.47 | 1832.3909 | -0.08 | |||
| -9087.4251 | -9198.99 | -9161.4384 | 1751.0782 | 1751.11 | 1751.074 | -0.04 | |||
| -7422.5119 | -7534.13 | -7496.5831 | 1664.9132 | 1664.86 | 1664.8553 | 0.00 | |||
| -5851.1360 | -5962.91 | -5925.3547 | 1571.3759 | 1571.22 | 1571.2284 | 0.01 | |||
| -4384.7147 | -4496.81 | -4459.1038 | 1466.4213 | 1466.10 | 1466.2509 | 0.15 | |||
| -3041.1089 | -3153.45 | -3115.5628 | 1343.6058 | 1343.36 | 1343.5410 | 0.18 | |||
| -1848.9391 | -1962.18 | -1923.3797 | 1192.1698 | 1191.27 | 1192.1831 | 0.91 | |||
| -857.2981 | -972.95 | -931.9223 | 991.641 | 989.23 | 991.4574 | 2.23 | *** | ||
| -165.6714 | -279.32 | -236.4322 | 691.6267 | 693.63 | 695.4901 | 1.86 | * | ||
| - | -27.71 | -3.6818 | - | 251.61 | 232.7504 | 18.86 | * | ||
| 9BeD | |||||||||
| -16829.6649 | -16950.59 | -16911.6232 | ZPE | 759.856 | 760.41 | ||||
| -15340.8226 | -15461.69 | -15422.781 | 1488.8423 | 1488.9 | 1488.8422 | -0.06 | |||
| -13893.4745 | -14014.32 | -13975.4336 | 1447.3481 | 1447.37 | 1447.3474 | -0.02 | |||
| -12488.2889 | -12609.12 | -12570.2475 | 1405.1856 | 1405.2 | 1405.1861 | -0.01 | |||
| -11126.2072 | -11247.05 | -11208.1685 | 1362.0817 | 1362.07 | 1362.079 | 0.01 | |||
| -9808.522 | -9929.4 | -9890.4919 | 1317.6852 | 1317.65 | 1317.6766 | 0.03 | |||
| -8536.9655 | -8657.95 | -8618.9698 | 1271.5565 | 1271.45 | 1271.5221 | 0.07 | |||
| -7313.8838 | -7435.09 | -7395.9756 | 1223.0817 | 1222.86 | 1222.9942 | 0.13 | |||
| -6142.5047 | -6264.04 | -6224.7459 | 1171.3791 | 1171.05 | 1171.2297 | 0.18 | |||
| -5027.3057 | -5149.28 | -5109.7308 | 1115.199 | 1114.76 | 1115.0151 | 0.26 | |||
| -3974.5183 | -4096.98 | -4057.1056 | 1052.7874 | 1052.3 | 1052.6252 | 0.33 | |||
| -2992.8739 | -3115.86 | -3075.5581 | 981.6444 | 981.13 | 981.5475 | 0.43 | |||
| -2094.8334 | -2218.65 | -2177.586 | 898.0405 | 897.21 | 897.9721 | 0.76 | |||
| -1298.8895 | -1424.17 | -1381.8381 | 795.9439 | 794.48 | 795.7479 | 1.27 | * | ||
| -634.5951 | -761.77 | -717.7958 | 664.2944 | 662.4 | 664.0423 | 1.64 | * | ||
| -156.4937 | -279.71 | -235.8591 | 478.1014 | 482.06 | 481.9367 | -0.12 | |||
| - | -50.97 | -17.7062 | - | 228.75 | 218.1529 | -10.6 | * | ||
| - | -8.70 | -0.2036 | - | 17.5026 | 42.27 | * | |||
| 9BeT | |||||||||
| -16940.4368 | -17065.35 | -17025.372 | (ZPE) | 649.249 | 649.65 | ||||
| -15664.4162 | -15789.30 | -15749.348 | 1276.0206 | 1276.05 | 1276.0240 | -0.03 | |||
| -14418.5334 | -14543.42 | -14503.465 | 1245.8828 | 1245.88 | 1245.8830 | 0.00 | |||
| -13203.1649 | -13328.06 | -13288.093 | 1215.3685 | 1215.36 | 1215.3720 | 0.01 | |||
| -12018.8103 | -12143.72 | -12103.738 | 1184.3546 | 1184.34 | 1184.3550 | 0.02 | |||
| -10866.1397 | -10991.08 | -10951.070 | 1152.6706 | 1152.64 | 1152.6680 | 0.03 | |||
| -9746.0175 | -9871.03 | -9830.9584 | 1120.1222 | 1120.05 | 1120.1116 | 0.06 | |||
| -8659.5529 | -8784.68 | -8744.5264 | 1086.4646 | 1086.35 | 1086.4320 | 0.08 | |||
| -7608.1843 | -7733.52 | -7693.2308 | 1051.3686 | 1051.16 | 1051.2956 | 0.14 | |||
| -6593.8005 | -6719.45 | -6678.9691 | 1014.3838 | 1014.07 | 1014.2617 | 0.19 | |||
| -5618.8974 | -5744.95 | -5704.2274 | 974.9031 | 974.50 | 974.7417 | 0.24 | |||
| -4686.7826 | -4813.32 | -4772.2839 | 932.1148 | 931.63 | 931.9435 | 0.31 | |||
| -3801.8486 | -3928.88 | -3887.4944 | 884.934 | 884.44 | 884.7895 | 0.35 | |||
| -2969.9698 | -3097.98 | -3055.7135 | 831.8788 | 830.90 | 831.7809 | 0.88 | |||
| -2199.1267 | -2327.94 | -2284.9518 | 770.8431 | 770.04 | 770.7617 | 0.72 | |||
| -1500.4838 | -1630.46 | -1586.4731 | 698.6429 | 697.48 | 698.4787 | 1.00 | * | ||
| -890.4642 | -1022.04 | -976.768 | 610.0196 | 608.42 | 609.7051 | 1.29 | * | ||
| -395.3986 | -527.51 | -481.3635 | 495.0656 | 494.53 | 495.4045 | 0.87 | |||
| -65.0597 | -185.60 | -141.9067 | 330.3389 | 341.91 | -2.45 | * | |||
| - | -40.97 | -9.6258 | 65.0597 | 144.63 | 132.2809 | -12.35 | * | ||
Table 3 compares spectroscopic constants derived from the present study to those derived from the 2006 Le Roy et al. (2006a) and 2011 Koput (2011) studies, and Table 4 compares the predicted vibrational binding energies, zero point energies, and vibrational spacings. A similar comparison was made across Tables IV, V and VI of Koput (2011). While those tables did not show for 9BeH or for 9BeD for the 2011 ab initio potentials and for 9BeT for the 2006 empirical potential, those potentials did in fact support these levels, so their predictions are included in Table 4 of the present paper.
In last column of Table 4, it is emphasized that the disagreement between the present empirical potential and the 2011 ab initio potential of Koput (2011) only rises above 1 cm-1 for one vibrational spacing in the data region (the space between and for 9BeH). This was also the only vibrational spacing in the data region for which the disagreement between the predicted energy spacing of the 2011 ab initio and the 2006 empirical potential was larger than 1 cm-1. However, in the region where measurements have not been made, the ab initio potential is for the most part in much better agreement with the present empirical potential than the 2006 empirical potential, particularly in the number of vibrational levels supported and in the energy spacings of higher vibrational energies.
Furthermore, in Table 3 we see that the 2011 ab initio potentials of Koput (2011) predicted a dissociation energy that is 74 cm-1 closer to the present empirical potential than the the predicted by the 2006 empirical potential of Le Roy et al. (2006a). Combining this observation with those in the above paragraph, and the comparison of the potential energy curves in Figs 1, 2, 3 and 4, tells us that the 2011 ab initio potential actually made more accurate predictions than the 2006 empirical potential for various rotationless properties such as the dissociation energy, vibrational energy spacings for very high values of , number of predicted levels, and the potential energy curves themselves are simply in better agreement.
Finally it is interesting to note that the predicted value for the leading term of the adiabatic BOB correction function for hydrogen ( cm-1 in Table 2), despite its large uncertainty due to the large gap in data between the highest observed vibrational level and the dissociation asymptote, is very similar to the value ( cm-1) obtained for the recent extensive study on the ground (-state of MgH, for which the fit was to spectroscopic data across MgH and MgD (c.f. to the present study which involves a fit to 2821 data across BeH, BeD and BeT).
III Conclusion
Spectroscopic studies of BeH date back to as early as 1928 Peterson (1928); Watson (1928); Wigner and Witmer (1928), and Hartree-Fock level ab initio studies on the system go back as far as 1967 Cade and Huo (1967). At present, about 11%, 17%, and 21% of the adiabatic rotationless potentials for 9BeH, 9BeD and 9BeT respectively, have not yet been covered by spectroscopic measurements. Consequently, the dissociation energy , the number of vibrational levels, and the leading term of hydrogen’s adiabatic BOB correction function have been elusive, the latter having its first empirical value reported in this present work, and the former two varying greatly in the most recent empirical Le Roy et al. (2006a) and ab initio Koput (2011) studies before this work.
For all three isotopologues, the confidence intervals for the empirical values of the ’s deduced from the present study are still about cm-1 which is rather large for a , especially for such a fundamental system. However, these empirical values are closer than ever to the state of the art ab initio values Koput (2011) which differ by at most 48 cm-1 (in the case of 9BeD).
The present study predicts the exact same number of vibrational levels for all three isotopologues as the state of the art ab initio study Koput (2011). Of the predicted levels, for 9BeH, for 9BeD, and for 9BeT have never been observed experimentally. Of these unobserved transitions, for 9BeH, for 9BeD, and for 9BeT are predicted to be bound by over 100 cm-1, by both the present study and the state of the art ab initio study of Koput (2011), so they are likely to exist. The higher levels are in a region where the ab initio vibrational energies had already started to deviate rather greatly from the present empirical potential, so confirmation of their existence awaits further experiments or higher level ab initio calculations, perhaps with non-adiabatic BOB corrections included.
Finally, the nature of the long-range tail of BeH potentials has been an intriguing mystery for several decades. Early electronic structure studies Bagus (1973); Gerratt and Raimondi (1980); Colin et al. (1983) discussed the possibility of there being a rotationless barrier or multiple inflection points in the long-range region. This was at focus in subsequent ab initio studies which found that these irregularities disappeared as the basis set size increased or other improvements were made Cooper (1984); Larsson (1984); Henriet and Verhaegen (1986), and even in later studies which again found such irregularities in the Å region Li and Paldus (1995); Petsalakis et al. (1999); Meiß ner and Paldus (2000); Li and Paldus (2005) . Figs 2, 3 and 4 provide a compelling reason to believe that no such irregularities found in earlier ab initio studies are genuine. The latest ab initio study of Koput (2011), which in the data region agrees very well with experiments, did not show evidence of such irregularities. Since the figures show that no spectroscopic data is available in the Å region, the fact that the empirical potentials from the present analysis also do not appear to have such irregularities is a consequence of the fact that the model upon which they were based was designed to smoothly transition between Morse-like short-range to mid-range behavior, and inverse-power long-range behavior according to theory. Since the coefficients in Table 1 are all positive, the theoretical inverse-power tail of the long-range potential is monotonically decreasing with respect to and therefore cannot have a barrier or inflection point. Due to the large gap between the highest experimentally observed vibrational levels and the point at which the empirical MLR potentials join the theoretical long-range potentials (that we see in the figures), there may be some room for inflections which the MLR model was not able to capture, but the acute agreement with the accurate ab initio potential energy curves rules out the possibility of a barrier and casts doubt on the existence of inflection points.
Finally, the new adiabatic potentials and BOB corrections functions for 9BeH, 9BeD, and 9BeT presented in this paper can be used to benchmark ab initio methods, especially for open shell molecules, since BeH is the simplest neutral open shell molecule with a stable ground electronic state. All of them are provided for a dense grid of internuclear distance values in a text file in this paper’s Supplementary Material, along with and programs to generate them at any internuclear distance using their analytic expressions. The present study adds BeH to the ever-growing list of molecules for which accurate empirical MLR-type potentials are available Le Roy et al. (2006b); Roy and Henderson (2007); Salami et al. (2007); Shayesteh et al. (2007); Li and Le Roy (2008); Le Roy et al. (2009); Coxon and Hajigeorgiou (2010); Stein et al. (2010); Li et al. (2010); Piticco et al. (2010); Le Roy et al. (2011b); Ivanova et al. (2011); Dattani and Le Roy (2011); Xie et al. (2011); Yukiya et al. (2013); Knöckel et al. (2013); Semczuk et al. (2013); Tritzant-Martinez et al. (2013); Wang et al. (2013); Li et al. (2013a, b); Gunton et al. (2013); Meshkov et al. (2014); Dattani et al. (2014).
Note about references
While 24 ab initio studies were referenced in the introductory paragraph to this paper, other references may have been missed due to the author not being aware of their existence. Likewise, experimental studies before 1937 and after 1974 have been cited, but other studies about which the author is unaware may exist. If the reader is aware of any such references, they are keenly encouraged to inform the author at .
Acknowledgments
It is with pleasure that the author thanks Bob Le Roy of University of Waterloo (Canada) for suggesting BeH as an interesting molecule for testing extrapolation with analytic models. The author also gratefully thanks Jim Mitroy of Charles Darwin University (Australia) for providing his unpublished calculated values for the constants appearing in Table 1 and used for the models to which the data was fitted, Jacek Koput of Adam Mickiewicz University (Poland) for his very prompt supply of his pointwise ab initio potentials for 9BeH, 9BeD, and 9BeT from Koput (2011), Yoshitaka Tanimura of Kyoto University (Japan) for his generous hospitality, and last but indubitably not least, Staszek Welsh of Oxford University (UK) for assistance with running many fits at a preliminary stage of this project. Financial support was generously provided by JSPS.
References
- Cade and Huo (1967) P. E. Cade and W. M. Huo, The Journal of Chemical Physics 47, 614 (1967).
- Chan (1968) A. C. H. Chan, The Journal of Chemical Physics 49, 727 (1968).
- Bender and Davidson (1969) C. Bender and E. Davidson, Physical Review 183, 23 (1969).
- Jungen and Ahlrichs (1970) M. Jungen and R. Ahlrichs, Theoretica Chimica Acta 17, 339 (1970).
- Mulliken (1971) R. S. Mulliken, International Journal of Quantum Chemistry 5, 95 (1971).
- Popkie (1971) H. E. Popkie, The Journal of Chemical Physics 54, 4597 (1971).
- Bagus (1973) P. S. Bagus, The Journal of Chemical Physics 58, 1886 (1973).
- Gerratt and Raimondi (1980) J. Gerratt and M. Raimondi, Proceedings of the Royal Society A: Mathematical, Physical and Engineering Sciences 371, 525 (1980).
- Cooper (1984) D. L. Cooper, The Journal of Chemical Physics 80, 1961 (1984).
- Larsson (1984) M. Larsson, The Journal of Chemical Physics 81, 6409 (1984).
- Larsson (1985) M. Larsson, Physica Scripta 32, 97 (1985).
- Henriet and Verhaegen (1986) C. Henriet and G. Verhaegen, Physica Scripta 33, 299 (1986).
- Petsalakis et al. (1992) I. D. Petsalakis, G. Theodorakopoulos, and C. A. Nicolaides, The Journal of Chemical Physics 97, 7623 (1992).
- Li and Paldus (1995) X. Li and J. Paldus, The Journal of Chemical Physics 102, 2013 (1995).
- Martin (1998) J. M. Martin, Chemical Physics Letters 283, 283 (1998).
- Machado et al. (1998) F. Machado, O. Roberto-Neto, and F. Ornellas, Chemical Physics Letters 284, 293 (1998).
- Petsalakis et al. (1999) I. D. Petsalakis, D. Papadopoulos, G. Theodorakopoulos, and R. J. Buenker, Journal of Physics B: Atomic, Molecular and Optical Physics 32, 3225 (1999).
- Meiß ner and Paldus (2000) H. Meiß ner and J. Paldus, The Journal of Chemical Physics 113, 2622 (2000).
- Fülscher and Serrano-Andrés (2002) M. P. Fülscher and L. Serrano-Andrés, Molecular Physics 100, 903 (2002).
- Bruna and Grein (2003) P. J. Bruna and F. Grein, Physical Chemistry Chemical Physics 5, 3140 (2003).
- Bubin and Adamowicz (2007) S. Bubin and L. Adamowicz, The Journal of Chemical Physics 126, 214305 (2007).
- Pitarch-Ruiz et al. (2008a) J. Pitarch-Ruiz, J. Sánchez-Marin, A. M. Velasco, and I. Martin, The Journal of Chemical Physics 129, 054310 (2008a).
- Pitarch-Ruiz et al. (2008b) J. Pitarch-Ruiz, J. Sánchez-Marín, and A. M. Velasco, Journal of Computational Chemistry 29, 523 (2008b).
- Koput (2011) J. Koput, The Journal of chemical physics 135, 244308 (2011).
- Le Roy et al. (2006a) R. J. Le Roy, D. R. Appadoo, R. Colin, and P. F. Bernath, Journal of Molecular Spectroscopy 236, 178 (2006a).
- Dattani and Welsh (2014) N. S. Dattani and S. Welsh, in 69th International Symposium on Molecular Spectroscopy, Vol. RD01 (2014) p. RD01.
- Yadin et al. (2012) B. Yadin, T. Veness, P. Conti, C. Hill, S. N. Yurchenko, and J. Tennyson, Monthly Notices of the Royal Astronomical Society 425, 34 (2012).
- Wohl (1971) H. Wohl, Solar Physics 16, 362 (1971).
- Shanmugavel et al. (2008) R. Shanmugavel, S. Bagare, N. Rajamanickam, and B. K. Kumar, Serbian Astronomical Journal , 51 (2008).
- Watson (1928) W. W. Watson, Physical Review 32, 600 (1928).
- Peterson (1928) M. Peterson, Physical Review 31 (1928).
- Koontz (1935) P. G. Koontz, Physical Review 48, 707 (1935).
- Watson (1929) W. W. Watson, Physical Review 34, 372 (1929).
- Watson and Parker (1930) W. W. Watson and A. Parker, Physical Review 36, 1019 (1930).
- Watson (1931) W. W. Watson, Physical Review 37, 167 (1931).
- Olsson (1932) E. Olsson, Zeitschrift für Physik 73, 732 (1932).
- Watson and Humphreys (1937) W. W. Watson and R. F. Humphreys, Physical Review 52, 318 (1937).
- De Greef and Colin (1974) D. De Greef and R. Colin, Journal of Molecular Spectroscopy 53, 455 (1974).
- Colin et al. (1983) R. Colin, C. Drèze, and M. Steinhauer, Canadian Journal of Physics 61, 641 (1983).
- Focsa et al. (1998) C. Focsa, P. Bernath, R. Mitzner, and R. Colin, Journal of Molecular Spectroscopy 192, 348 (1998).
- Shayesteh et al. (2003) A. Shayesteh, K. Tereszchuk, P. F. Bernath, and R. Colin, The Journal of Chemical Physics 118, 1158 (2003).
- Le Roy et al. (2011a) R. J. Le Roy, C. C. Haugen, J. Tao, and H. Li, Molecular Physics 109, 435 (2011a).
- Colin and De Greef (1975) R. Colin and D. De Greef, Canadian Journal of Physics 53, 2142 (1975).
- Mitroy (2014) J. Mitroy, Private Communication (2014).
- Dattani and Le Roy (2011) N. S. Dattani and R. J. Le Roy, Journal of Molecular Spectroscopy 268, 199 (2011).
- Semczuk et al. (2013) M. Semczuk, X. Li, W. Gunton, M. Haw, N. S. Dattani, J. Witz, A. K. Mills, D. J. Jones, and K. W. Madison, Physical Review A 87, 052505 (2013).
- Le Roy et al. (2011b) R. J. Le Roy, C. C. Haugen, J. Tao, and H. Li, Molecular Physics 109, 435 (2011b).
- Wigner and Witmer (1928) E. Wigner and E. E. Witmer, Zeitschrift für Physik 51, 859 (1928).
- Li and Paldus (2005) X. Li and J. Paldus, Private Communication (2005).
- Le Roy et al. (2006b) R. J. Le Roy, Y. Huang, and C. Jary, The Journal of Chemical Physics 125, 164310 (2006b).
- Roy and Henderson (2007) R. J. L. Roy and R. D. E. Henderson, Molecular Physics 105, 663 (2007).
- Salami et al. (2007) H. Salami, A. J. Ross, P. Crozet, W. Jastrzebski, P. Kowalczyk, and R. J. Le Roy, The Journal of Chemical Physics 126, 194313 (2007).
- Shayesteh et al. (2007) A. Shayesteh, R. D. E. Henderson, R. J. Le Roy, and P. F. Bernath, The Journal of Physical Chemistry. A 111, 12495 (2007).
- Li and Le Roy (2008) H. Li and R. J. Le Roy, Physical Chemistry Chemical Physics : PCCP 10, 4128 (2008).
- Le Roy et al. (2009) R. J. Le Roy, N. S. Dattani, J. a. Coxon, A. J. Ross, P. Crozet, and C. Linton, The Journal of Chemical Physics 131, 204309 (2009).
- Coxon and Hajigeorgiou (2010) J. A. Coxon and P. G. Hajigeorgiou, The Journal of Chemical Physics 132, 094105 (2010).
- Stein et al. (2010) A. Stein, H. Knöckel, and E. Tiemann, The European Physical Journal D 57, 171 (2010).
- Li et al. (2010) H. Li, P.-N. Roy, and R. J. Le Roy, The Journal of Chemical Physics 133, 104305 (2010).
- Piticco et al. (2010) L. Piticco, F. Merkt, A. A. Cholewinski, F. R. McCourt, and R. J. Le Roy, Journal of Molecular Spectroscopy 264, 83 (2010).
- Ivanova et al. (2011) M. Ivanova, A. Stein, A. Pashov, A. V. Stolyarov, H. Knöckel, and E. Tiemann, The Journal of Chemical Physics 135, 174303 (2011).
- Xie et al. (2011) F. Xie, L. Li, D. Li, V. B. Sovkov, K. V. Minaev, V. S. Ivanov, A. M. Lyyra, and S. Magnier, The Journal of Chemical Physics 135, 024303 (2011).
- Yukiya et al. (2013) T. Yukiya, N. Nishimiya, Y. Samejima, K. Yamaguchi, M. Suzuki, C. D. Boone, I. Ozier, and R. J. Le Roy, Journal of Molecular Spectroscopy 283, 32 (2013).
- Knöckel et al. (2013) H. Knöckel, S. Rühmann, and E. Tiemann, The Journal of Chemical Physics 138, 094303 (2013).
- Tritzant-Martinez et al. (2013) Y. Tritzant-Martinez, T. Zeng, A. Broom, E. Meiering, R. J. Le Roy, and P.-N. Roy, The Journal of Chemical Physics 138, 234103 (2013).
- Wang et al. (2013) L. Wang, D. Xie, R. J. Le Roy, and P.-N. Roy, The Journal of Chemical Physics 139, 034312 (2013).
- Li et al. (2013a) H. Li, X.-L. Zhang, R. J. Le Roy, and P.-N. Roy, The Journal of Chemical Physics 139, 164315 (2013a).
- Li et al. (2013b) G. Li, I. E. Gordon, P. G. Hajigeorgiou, J. A. Coxon, and L. S. Rothman, Journal of Quantitative Spectroscopy and Radiative Transfer 130, 284 (2013b).
- Gunton et al. (2013) W. Gunton, M. Semczuk, N. Dattani, and K. Madison, Physical Review A 88, 062510 (2013).
- Meshkov et al. (2014) V. V. Meshkov, A. V. Stolyarov, M. C. Heaven, C. Haugen, and R. J. LeRoy, The Journal of Chemical Physics 140, 064315 (2014).
- Dattani et al. (2014) N. S. Dattani, L. N. Zack, M. Sun, E. R. Johnson, R. J. Le Roy, and L. M. Ziurys, physics.chem-ph , arXiv:1408.2276 (2014).