Interplay of spin-orbit and entropic effects in Cerium
Abstract
We perform first-principle calculations of elemental cerium and compute its pressure-temperature phase diagram, finding good quantitative agreement with the experiments. Our calculations indicate that, while a signature of the volume-collapse transition appears in the free energy already at low temperatures, at larger temperatures this signature is enhanced because of the entropic effects, and originates an actual thermodynamical instability. Furthermore, we find that the catalyst determining this feature is — in all temperature regimes — a pressure-induced effective reduction of the -level degeneracy due to the spin-orbit coupling. Our analysis suggests also that the lattice vibrations might be crucial in order to capture the behavior of the pressure-temperature transition line at large temperatures.
pacs:
64, 71.30.+h, 71.27.+aAt ambient temperature elemental cerium undergoes a pressure-induced first-order isostructural transition, which is accompanied by a volume collapse of about . The critical pressure where this transition occurs increases linearly with the temperature, and the corresponding transition line in the pressure-temperature phase diagram ends at a critical temperature . Since 1949, when the - transition was discovered, it has stimulated a lot of experimental and theoretical work, but a complete theoretical description of this phenomenon is still lacking. In particular, two theoretical pictures are still nowadays under debate: (i) the Kondo volume collapse model (KVC), that was proposed by Allen and Martin Allen and Martin (1982) and independently by Lavagna, Lacroix, and Cyrot Lavagna et al. (1982), and (ii) the orbital-selective Mott transition (HM), that was proposed by Johansson Johansson (1974). The main difference between these two models is that, while the KVC attributes the - transition of cerium to a rapid change of the degree of hybridization between the electrons and the conduction bands (and consequently of the Kondo temperature), within the HM transition the key quantity whose rapid variation is repsonsible of the transition is the kinetic energy of the electrons, while the itinerant electrons are inert spectators of the transition. Consistently with both the HM and the KVC, photoemission experiments Wieliczka et al. (1984); Weschke et al. (1991); Patthey et al. (1985) have demonstrated that the electrons are correlated both in the phase and in the phase. On the other hand, calculations of the optical spectrum Haule et al. (2005) have enabled to interpret the experiments van der Eb et al. (2001) in favor of the KVC.
In our view, there are few fundamental questions that have to be answered in order fully understand the physics underlying the - transition or cerium. (1) Why does vary rapidly only within a narrow window of volumes rather than varying smoothly? (2) How does the rapid variation of affect the free energy and, in particular, generate the - isostructural transition? (3) Is the fact that the - isostructural transition ends at purely due to electronic effects or does it require to take into account the temperature-induced lattice vibrations?
Recent first principle calculations of cerium Lanatà et al. (2013) within the Gutzwiller approximation in combination with the local density approximation (LDA+GA) have suggested a possible solution to the first of the questions listed above. In fact, these calculations have shown that a clear signature of the - isostructural transition of cerium can be observed at zero temperature if (and only if) the spin-orbit coupling is taken into account. Furthermore, they have shown that the reason underlying this result is that the spin-orbit coupling effectively reduces the -level degeneracy from to when the hybridization strength is reduced by increasing the volume, thus causing a crossover in the evolution of . On the contrary, if the spin-orbit couping is not taken into account evolves smoothly as a function of the volume. This point of view has been further clarified in a following work Lanatà et al. (2014a) making use of the “principle of maximum entanglement entropy”. The importance of the spin-orbit coupling for the determination of the thermodynamical properties of cerium has been finally confirmed also within the framework of LDA in combination with dynamical mean field theory (LDA+DMFT) Kotliar et al. (2006), see Ref. Bieder and Amadon (2014), where the spin-orbit coupling was neglected because of the great computational complexity of the problem. In fact, the LDA+DMFT low-temperature pressure-volume phase diagram — that is in very good quantitative agreement with the LDA+GA calculations of Ref. Lanatà et al. (2013) — does not display any signature of the transition at low temperatures. Furthermore, it was shown that, if the spin-orbit coupling is neglected, not even the entropy is sufficient to induce a thermodynamical instability, but only a softening of the bulk modulus.
The second of the questions listed above is particularly challenging, as a rapid variation of affects differently the internal energy and the entropy of the system. In fact, at small volumes (where ) the Kondo-stabilization effect decreases the internal-energy McMahan et al. (2003); Amadon et al. (2006), while the entropy is small; on the contrary, at large volumes (where ) the entropy of the system is large, thus decreasing considerably the free energy and stabilizing the phase. Because of these reasons, it is rather complicated to predict quantitatively the behavior of the free energy in concomitance with a rapid variation of , and accurate first-principles calculations are essential in order to study this problem.
Since the spin-orbit coupling and the entropic effects are both important at finite temperatures, it is clear that in order to fully understand the - transition at finite temperatures (and in particular to answer the second and the third questions listed above) it is essential to perform first principles calculations able to take into account both of these physical effects. In this work, besides taking into account the spin-orbit coupling, we describe the entropic effects at finite temperatures by employing a charge self-consistent combination of LDA with the rotationally-invariant slave-boson (SB) mean-field theory Lechermann et al. (2007), that we have implemented following Ref. Lanatà et al. (2014b). Note that this method is equivalent to LDA+GA at zero temperature Bünemann and Gebhard (2007) and, although it is not as accurate as LDA+DMFT, it has the advantage to be much less computationally demanding. For completeness, in the supplemental material is given a brief introduction of the LDA+SB method.
As in Ref. Lanatà et al. (2013), we employ the “standard” prescription for the double-counting functional and the general (rotationally-invariant) Slater-Condon parametrization Anisimov et al. (1997) of the on-site interaction, assuming that the Hund’s coupling constant is and that the value of the interaction-strength is .
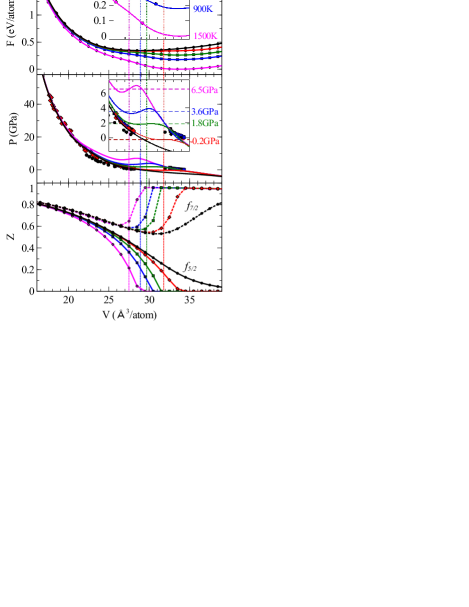
In the upper panel of Fig. 1 is shown the evolution of the free energy at different temperatures . While at small volumes is not very sensitive to , at larger volumes it is considerably reduced by the temperature. Because of this effect, at the phase is stable at zero pressure, while at lower temperatures the phase is stable only at negative pressures. In other words, consistently with the experiments, our calculations indicate that at the volume-collapse transition occurs at positive pressures. The boundaries of the transition have been evaluated within the common-tangent construction, and are indicated by the dots in the inset of the upper panel of Fig. 1.
The pressure-volume curves, that are calculated from the free energy using , are shown in the middle panel of Fig. 1 in comparison with the room-temperature experimental data of Refs. Zachariasen and Ellinger (1977); Olsen et al. (1985). The critical pressures (at different temperatures) are here identified by the equal-area construction, and are indicated by horizontal lines. The volumes where reaches the maximum value are indicated by vertical lines. Remarkably, our finite-temperature calculations are in very good agreement with the room-temperature experimental pressure-volume phase diagram. In particular, note that the entropic effects improve the comparison with the experiments at large volumes, which confirms that they are very important to describe the thermodynamical properties of cerium, especially in the phase.
In the lower panel of Fig. 1 is shown the evolution as a function of the volume of the Gutzwiller quasi-particle renormalization weights of the and -electrons. Interestingly, the overall qualitative behavior of the quasi-particle weights is similar for all temperatures: both and are significantly smaller than already at high pressures, and in this regime they monotonically decrease as a function of the volume; on the contrary, at volumes larger than a temperature-dependent crossover volume we observe that increases while rapidly decreases. This behavior was already discussed in the zero-temperature calculations of Ref. Lanatà et al. (2013), and reflects the above-mentioned effective reduction of the -level degeneracy from to due to the spin-orbit coupling. Remarkably, here we find that the crossover of the ’s takes place for all temperatures at the same volume where reaches its maximum value. This finding indicates that, also at finite temperatures, the - volume-collapse transition is induced by the rapid reduction of the Kondo temperature, which occurs because the spin-orbit coupling effectively reduces the -level degeneracy from to at .
Note that, while at zero temperature we find that even at large volumes, at we find that for all volumes larger than a critical value , which approaches when the temperature is increased. This observation is suggestive respect to the considerations of Ref. Held et al. (2000), which partially reconciliate the HM and the KVC pictures at finite temperatures. On the other hand, we believe that the second-order selective Mott transition found in our calculations does not reflect an actual physical effect, but is an artifact of the SB approximation scheme. More precisely, we do not expect that in cerium a transition should be observed as a function of the volume, but only as a function of the pressure. In any case, we point out that the thermodynamical properties or cerium are determined exclusively by the free energy, which does not display any singular behavior at in our calculations.

In Fig. 2 the theoretical pressure-temperature phase diagram extrapolated from the free-energy curves of Fig. 1 is shown in comparison with the experimental data. Note that at zero temperature no transition is observed in our calculations with , but only a signature identified by a maximum (but negative) value of , see Ref. Lanatà et al. (2013). The empty square at and negative pressures indicates this signature. Remarkably, the behavior of the transition line in the pressure-temperature phase diagram is in good agreement with the experiments, see Fig. 2. In particular, note that the critical pressure increases as a function of the temperature, and it is positive for . On the other hand, our calculations do not reproduce the experimental behavior of the transition line at high temperatures. In fact, while experimentally the transition line ends at , our calculations indicate that the transition line continues far beyond the range of temperatures displayed in Fig. 2, as a volume-collapse transition is observed even at .
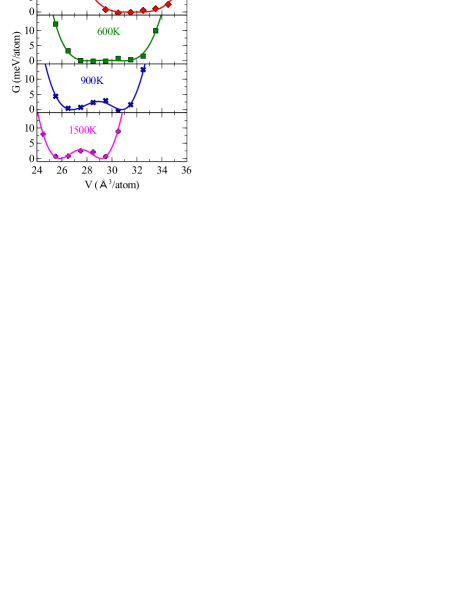
In Fig. 3 are shown the thermodynamical potentials as a function of the volume, which are evaluated at different by fixing the corresponding critical pressures . Consistently with the definition of the common-tangent construction, displays a double-minima structure, indicating that the system is unstable at . Interestingly, the energy-barrier between the and phases is smaller than for all of the temperatures considered, and it increases monotonically with . Note also that increases rapidly only at low temperatures, while it remains almost unchanged between and .
We point out that, within the Born-Hoppenheimer approximation, the function represents the effective potential experienced by the cerium atoms at fixed temperature and pressure . This observation suggests that the lattice vibrations — which were not taken into account in our calculations — might be the actual reason why the transition line ends at the finite temperature . In fact, since the energy-barrier is very small even at high temperatures, it might be possible that, because of the temperature-induced lattice vibrations, the atom-configurations “sample” simultaneously both the and the phase not only at the critical pressure defined above, but also within a small interval of pressures , thus transforming the volume-collapse transition in a crossover when the temperature is sufficiently high.
In conclusion, we have calculated from first principles the phase diagram of fcc cerium, finding good agreement with the experiments. Our analysis suggests that the iso-structural pressure-induced - transition is induced by a rapid variation of the Kondo temperature, which occurs because of the interplay between the spin-orbit coupling and the -electron correlations. While a signature of the volume-collapse transition appears in the free energy already at low temperatures, at higher temperatures this signature is enhanced because of the entropic effects, and originates an actual thermodynamical instability. The behavior of the theoretical thermodynamical potential at constant pressure indicates that the and phases are separated by a very small energy barrier at all temperatures. This observation suggests an appealing possible explanation of why the pressure-temperature transition line ends at : at the atom configurations might be able to overcome the above-mentioned barrier and sample simultaneously the and phases even slightly before the critical pressure, thus transforming the - transition in a crossover. In order to clarify this point, and thus answer the third of the questions listed in the introduction of this work, it would be interesting to perform molecular dynamics simulations Parrinello and Rahman (1981); P. et al. (2013), e.g., using effective atomistic potentials extrapolated from the free-energy curves of this work. Alternatively, this issue could be investigated by performing direct Monte Carlo simulations (iterating LDA+SB calculations of cerium with a large unit cell).
I ACKNOWLEDGMENTS
We thank Kristjan Haule, Michele Fabrizio and XiaoYu Deng for useful discussions. N.L. and G.K. were supported by U.S. DOE Office of Basic Energy Sciences under Grant No. DE-FG02-99ER45761. The collaboration was supported by the U.S. Department of Energy through the Computational Materials and Chemical Sciences Network CMSCN. Research at Ames Laboratory supported by the U.S. Department of Energy, Office of Basic Energy Sciences, Division of Materials Sciences and Engineering. Ames Laboratory is operated for the U.S. Department of Energy by Iowa State University under Contract No. DE-AC02-07CH11358.
References
- Allen and Martin (1982) J. W. Allen and R. M. Martin, Phys. Rev. Lett. 49, 1106 (1982).
- Lavagna et al. (1982) M. Lavagna, C. Lacroix, and M. Cyrot, Phys. Lett. A 90, 210 (1982).
- Johansson (1974) B. Johansson, Philos. Mag. 30, 469 (1974).
- Wieliczka et al. (1984) D. M. Wieliczka, C. G. Olson, and D. W. Lynch, Phys. Rev. Lett. 52, 2180 (1984).
- Weschke et al. (1991) E. Weschke, C. Laubschat, T. Simmons, M. Domke, O. Strebel, and G. Kaindl, Phys. Rev. B 44, 8304 (1991).
- Patthey et al. (1985) F. Patthey, B. Delley, W. D. Schneider, and Y. Baer, Phys. Rev. Lett. 55, 1518 (1985).
- Haule et al. (2005) K. Haule, V. Oudovenko, S. Y. Savrasov, and G. Kotliar, Phys. Rev. Lett. 94, 036401 (2005).
- van der Eb et al. (2001) J. W. van der Eb, A. B. Kuz’menko, and D. van der Marel, Phys. Rev. Lett. 86, 3407 (2001).
- Lanatà et al. (2013) N. Lanatà, Y.-X. Yao, C.-Z. Wang, K.-M. Ho, J. Schmalian, K. Haule, and G. Kotliar, Phys. Rev. Lett. 111, 196801 (2013).
- Lanatà et al. (2014a) N. Lanatà, H. U. R. Strand, Y. Yao, and G. Kotliar, Phys. Rev. Lett. 113, 036402 (2014a).
- Kotliar et al. (2006) G. Kotliar, S. Y. Savrasov, K. Haule, V. S. Oudovenko, O. Parcollet, and C. A. Marianetti, Rev. Mod. Phys. 78, 865 (2006).
- Bieder and Amadon (2014) J. Bieder and B. Amadon, Phys. Rev. B 89, 195132 (2014).
- McMahan et al. (2003) A. K. McMahan, K. Held, and R. T. Scalettar, Phys. Rev. B 67, 075108 (2003).
- Amadon et al. (2006) B. Amadon, S. Biermann, A. Georges, and F. Aryasetiawan, Phys. Rev. Lett. 96, 066402 (2006).
- Lechermann et al. (2007) F. Lechermann, A. Georges, G. Kotliar, and O. Parcollet, Phys. Rev. B 76, 155102 (2007).
- Lanatà et al. (2014b) N. Lanatà, Y. X. Yao, C. Z. Wang, K. M. Ho, and G. Kotliar (2014b), eprint cond-mat/1405.6934.
- Bünemann and Gebhard (2007) J. Bünemann and F. Gebhard, Phys. Rev. B 76, 193104 (2007).
- Anisimov et al. (1997) V. I. Anisimov, F. Aryasetiawan, and A. Lichtenstein, J. Phys. Condens. Matter 9, 767 (1997).
- Zachariasen and Ellinger (1977) W. H. Zachariasen and F. H. Ellinger, Acta Crystallogr. Sec. A 33, 155 (1977).
- Olsen et al. (1985) J. Olsen, L. Gerward, U. Benedict, and J.-P. Itié, Physica B+C 133, 129 (1985).
- Held et al. (2000) K. Held, C. Huscroft, R. T. Scalettar, and A. K. McMahan, Phys. Rev. Lett. 85, 373 (2000).
- Lipp et al. (2008) M. J. Lipp, D. Jackson, H. Cynn, C. Aracne, W. J. Evans, and A. K. McMahan, Phys. Rev. Lett. 101, 165703 (2008).
- Beecroft and Swenson (1960) R. Beecroft and C. Swenson, Journal of Physics and Chemistry of Solids 15, 234 (1960).
- Jayaraman (1965) A. Jayaraman, Phys. Rev. 137, A179 (1965).
- Schiwek et al. (2002) A. Schiwek, F. Porsch, and W. B. Holzapfel, High Pressure Research 22, 407 (2002).
- Parrinello and Rahman (1981) M. Parrinello and A. Rahman, J. Appl. Phys. 52, 7182 (1981).
- P. et al. (2013) Y. Z. P., X. Deng, K. Basu, Q. Yin, and G. Kotliar (2013), eprint cond-mat/1303.3322.