Supernova Remnant Kesteven 27: Interaction with A Neighbor HI Cloud Viewed by Fermi
Abstract
We report on the likely detection of -ray emission from the supernova remnant (SNR) Kesteven 27 (Kes 27). We analyze 5.7 yr Fermi Large Area Telescope data of the SNR region and find an unresolved source at a position consistent with the radio brightness peak and the X-ray knot of Kes 27, which is located in the eastern region of the SNR and caused by the interaction with a nearby HI cloud. The source’s emission is best fit with a power-law spectrum with a photon index of 2.50.1 and a 0.2 GeV luminosity of 5.8 erg s-1 assuming a distance of 4.3 kpc, as derived from radio observations of the nearby HI cloud. Comparing the properties of the source with that of other SNRs that are known to be interacting with nearby high-density clouds, we discuss the origin of the source’s emission. The spectral energy distribution of the source can be described by a hadronic model that considers the interaction of energetic protons, escaping from the shock front of Kes 27, with a high-density cloud.
Subject headings:
acceleration of particles — gamma rays: ISM — ISM: individual objects (Kesteven 27) — ISM: supernova remnants1. Introduction
The high sensitivity and fine spatial resolution of the Fermi Gamma-ray Space telescope, along with that of the ground-based very high energy (VHE) -ray telescopes, have allowed us to conduct unprecedentedly detailed study of supernova remnants (SNRs) at high-energy GeV and TeV energies. From Fermi observations, we now know that due to their interaction with nearby molecular clouds (e.g., Ferrand & Safi-Harb 2012), middle-aged SNRs, such as W51C (Abdo et al., 2009), W44 (Abdo et al., 2010d), IC 443 (Abdo et al., 2010e), and W28 (Abdo et al., 2010a), are among the brightest MeV to GeV -ray sources, having -ray luminosities of 1036 erg s-1. As a comparison, young SNRs with ages no larger than a few thousands of years, such as RX J1713.73946 (Ellison et al., 2010; Abdo et al., 2011), Cas A (Abdo et al., 2010b), and Tycho (Acciari et al., 2011), have -ray luminosities two orders of magnitude lower. -ray emission from dynamically evolved SNRs interacting with molecular clouds is believed to be dominated by pion decay emission, resulting from collision of relativistic protons with ambient material (e.g., Abdo et al. 2009, 2010d, 2010e, 2010a). Their high luminosities rule out the alternative leptonic origin, since the required total electron energy would be 1051 erg, larger than the typical kinetic energy released by a supernova explosion (e.g., Abdo et al. 2010a). In the leptonic scenario, the high energy emission is thought to be due to either inverse Compton up-scattering of ambient low-energy photons by relativistic electrons or Bremsstrahlung radiation from high-energy electrons. Even among young (2000 yrs) SNRs, sometimes there is also evidence suggesting a hadronic origin to the observed -ray emission. The position of -ray emission may coincide with the region in an SNR that is known to be interacting with a nearby molecular cloud (e.g., Xing et al. 2014). Here in this paper, we report Fermi detection of another such case, the SNR Kesteven 27 (Kes 27).
As a thermal composite SNR, Kes 27 (also known as G327.400.4) was found to be confined in an HI shell and interacting with a nearby HI cloud on the southeast (McClure-Griffiths et al., 2001), leading to a radio brightness peak at the southeast edge of Kes 27 (Milne et al., 1989; McClure-Griffiths et al., 2001). The extent of the SNR’s radio emission is approximately 21′ as measured with the Molonglo Observatory Synthesis Telescope (MOST) at 843 MHz (Whiteoak & Green, 1996). A kinematic distance of approximately 4.30.5 kpc was estimated for the HI cloud and thus Kes 27, derived from the velocity measurements from the HI absorption spectra toward them (McClure-Griffiths et al., 2001). Kes 27 has also been observed at X-ray energies with different X-ray telescopes including Einstein (Lamb & Markert, 1981; Seward, 1990), ROSAT (Seward et al., 1996), ASCA (Enoguchi et al., 2002; Kawasaki et al., 2005), and Chandra (Chen et al., 2008). Slightly different from other thermal composite SNRs whose X-ray emission is centrally peaked, high-spatial Chandra imaging has revealed that this SNR has bright emission in the region east of its center and the emission near the eastern shell roughly coincides with the radio morphology (Chen et al., 2008). The X-ray imaging thus also indicates the enhanced emission due to the interaction with the HI cloud. From X-ray observations of the diffuse emission from Kes 27, a dynamical age of 8000 yr was derived for the SNR, adopting a shock velocity of 580 km s-1 and a diameter of 20′ (Chen et al., 2008).
In this paper we report our analysis of the Fermi Large Area Telescope (LAT) data of the Kes 27 region and the likely detection of -ray emission from the interaction region of the SNR. We describe the Fermi observation data we used in Section 2, and present the data analyses and results in Section 3. The results are discussed in Section 4.
2. Observation
As the main instrument onboard the Fermi Gamma-ray Space Telescope, LAT is a -ray imaging instrument that scans the whole sky every three hours and can conduct long-term -ray observations of sources in the energy range from 20 MeV to 300 GeV (Atwood et al., 2009). In our analysis we selected LAT events from the Fermi Pass 7 Reprocessed (P7REP) database inside a region centered at the position of Kes 27. The SIMBAD position of Kes 27 is R.A., Decl. (equinox J2000.0), which was adopted as the central position of Kes 27 after comparing with the radio (Milne et al., 1989) and X-ray maps (Seward et al., 1996; Enoguchi et al., 2002; Chen et al., 2008) of this source. We kept events during the time period from 2008-08-04 15:43:36 (UTC) to 2014-04-13 22:13:17 UTC, and rejected events below 200 MeV because of the relative large uncertainties of the instrument response function of the LAT in the low energy range. In addition, following the recommendations of the LAT team111http://fermi.gsfc.nasa.gov/ssc/data/analysis/scitools, we included those events with zenith angles less than 100 degrees, which prevents the Earth’s limb contamination, and during good time intervals when the quality of the data was not affected by the spacecraft events.
3. Analysis and Results
3.1. Source Detection
We included all sources within 16 degrees centered at the position of Kes 27 in the Fermi 2-year catalog (Nolan et al., 2012) to make the source model. The spectral function forms of these sources are provided in the catalog. The spectral normalizations of the sources within 8 degrees from Kes 27 were set as free parameters, and the other parameters were fixed at their catalog values. In addition, the -ray pulsar PSR J15435149 (Ng et al., 2014) was included in the source model, which was not listed in the catalog. We modeled the pulsar’s emission with a power law with an exponential cut-off, which is the characteristic spectrum for pulsar emission, and set the spectral normalization, spectral index, and cutoff energy as free parameters. The Galactic and extragalactic diffuse emission was also added in the source model with the spectral model gll_iem_v05.fits and the file iso_source_v05.txt, respectively, used. The normalizations of the diffuse components were free parameters.
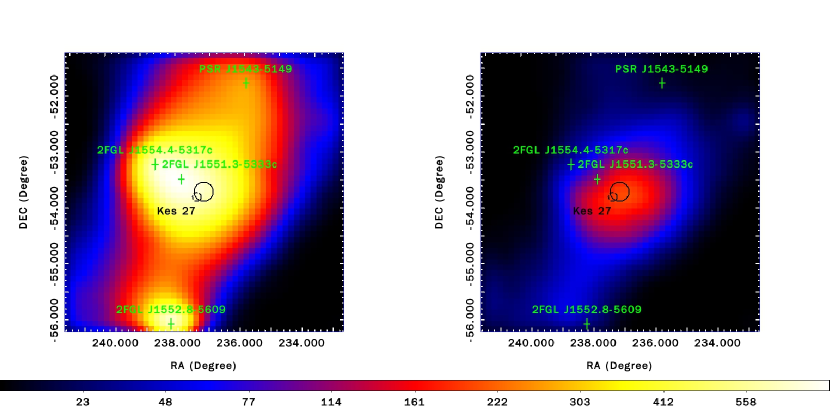
We performed standard binned likelihood analysis to the LAT data in the 0.2 GeV range using the LAT science tools software package v9r23p5, and extracted the Test Statistic (TS) map of a region centered at the position of Kes 27. A TS map that included sources in the source model outside of the region was made, which is shown in the left panel of Figure 1. The TS map indicates that Kes 27 is located in a complex region with two nearby catalog sources, 2FGL J1554.45317c and 2FGL J1551.35333c. Then removing all the sources in the source model in this region, a residual map was made and is shown in the right panel of Figure 1. Excess -ray emission appears near the center with TS217, indicating 15 detection significance. For these analyses, we also tested to included sources within 20 degrees centered at Kes 27 and free the spectral indices of the sources within 5 degrees from Kes 27, but the results of source positions and spectra did not have significantly differences (consistent within uncertainties) and at the Kes 27 region, TS, only slightly lower than that from fixing the spectral indices.
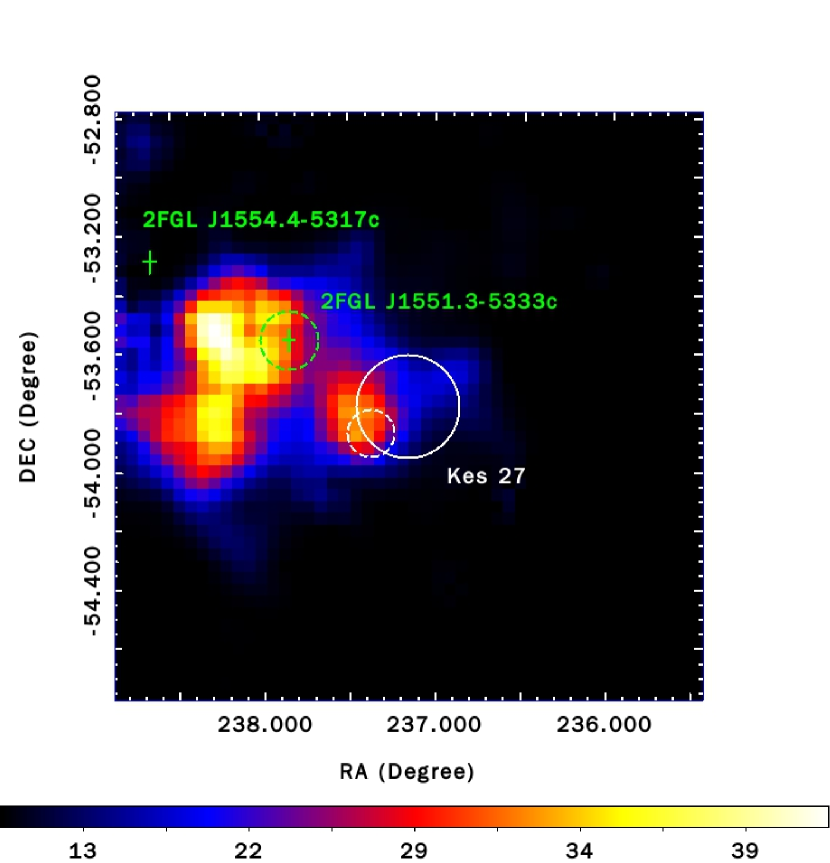
While Lande et al. (2012) analyzed the two nearby sources 2FGL J1554.45317c and 2FGL J1551.35333c, and determined that they did not have extended emission, we also investigated whether or not the excess emission could be due to any confusion because of the proximity to 2FGL J1551.35333c. Different TS maps in the energy ranges of 1 GeV, 2 GeV, and 3 GeV were made, as the point spread functions (PSFs) of LAT are significantly reduced at the high energies222http://www.slac.stanford.edu/exp/glast/groups/canda/lat_Performance.htm. For making the TS maps, all the sources except 2FGL J1551.35333c in the source model were removed. We found that the excess emission is clearly resolved from 2FGL J1551.35333c. A TS map of the source region in 3–300 GeV is displayed in the left panel of Figure 2, showing that they are separate. Actually at the high energy range, the catalog position of 2FGL J1551.35333c, having TS34, is not at the TS peak (48). There may be another source east to 2FGL J1551.35333c. We tested to determine the position for this source in 3–300 GeV and obtained R.A.=23822, Decl.=5361, (equinox J2000.0), with a large uncertainty of 026 (1). The position is 02 away from 2FGL J1551.35333c, and therefore they are consistent within the uncertainty. No conclusion could be made for them based on the current data. In any case, the excess emission at the Kes 27 region was always present in these analyses.
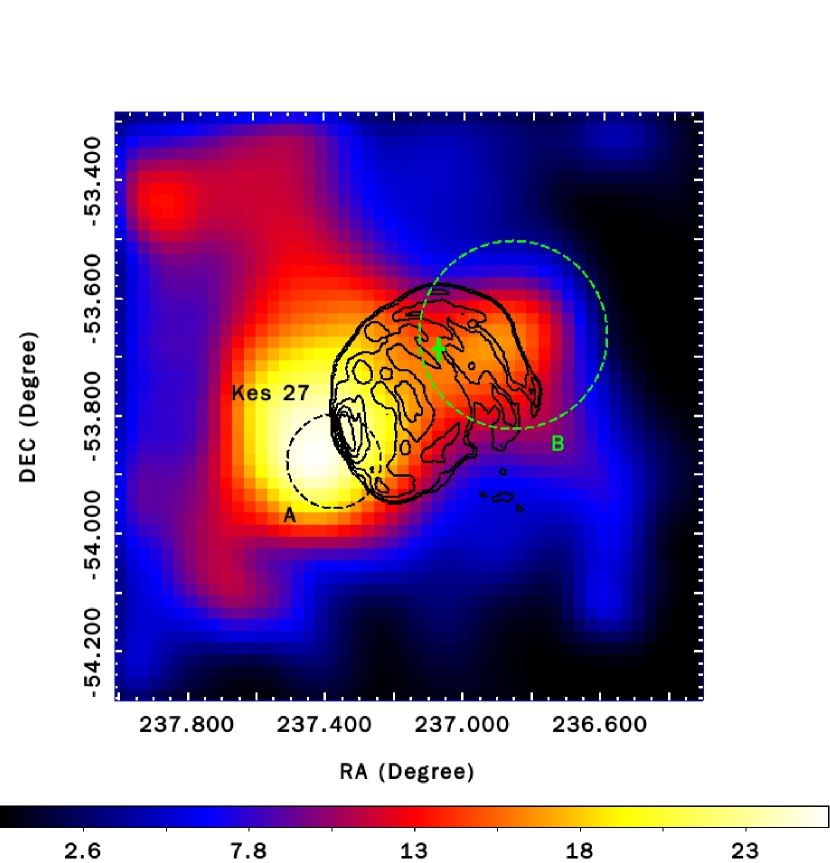
Examining the excess emission at the high energy range, we found that it actually consists of two individual sources. The residual TS map of the region centered at Kes 27 (right panel of Figure 2), which was made from using the 3 GeV data, shows the details. Two possible sources are resolved, with the southeast and northwest ones marked as and , respectively. The TS values for them are 22 and 14, respectively. While source dominates the emission in the 0.2 GeV energy range (see § 3.3), source is more significantly detected in the 3 GeV energy range. We overlaid the radio intensity contours for Kes 27, detected by MOST at 843 MHz (Whiteoak & Green, 1996), on the map, and found that the radio brightness peak of Kes 27 is located close to the southeast source. By running gtfindsrc in the LAT software package, we determined its position, which is R.A.=23737, Decl.=5388, (equinox J2000.0), with 1 nominal uncertainty of 004. This position is consistent with that of the radio brightness peak of Kes 27 (approximately R.A.=23733, Decl.=5382) within the 2 error circle. The positional coincidence suggests that source is likely associated with Kes 27. Below we considered this source as the -ray counterpart to Kes 27 (see also the Discussion section).
For source , we also obtained its best-fit position in the 3 GeV energy range, and the position is R.A.=23686, Decl.=5367, with 1 nominal uncertainty of 008. We tested to consider and remove this source from the 3 GeV TS map, and the excess -ray emission (i.e., source ) at the southeast region of Kes 27 was still present with TS20.
We thus added these two sources at their best-fit positions to the source model and performed binned likelihood analysis in the 0.2 GeV range. The spectra of them were modeled with a power law. We found that sources and have photon indices of 0.1 (with a TS value of 76) and 0.1 (with a TS value of 80), respectively.
Source B could be emission from Kes 27 too as it positionally coincides with the northwest part of Kes 27 (Figure 2). However, given the radio and X-ray morphology of the SNR, no notable features were seen at the source’s position, and it would be hard to explain why the SNR is bright at this source’s region but not in the whole region if the SNR has significant -ray emission. In the Chandra observation reported by Chen et al. (2008), an X-ray point source, CXOU J154816.7534125, was detected at the position of R.A.=2370700, Decl.=536904 (0.5″ uncertainty). This source (marked by a green cross in the right panel of Figure 2) is 012 away from the best-fit position of source but within the 2 error circle. It was thought to be a background candidate AGN. As AGNs generally have a power-law -ray spectrum, with photon index up to 3.0 in the Fermi -ray energy range (Abdo et al., 2010f), the spectrum of source also suggests the possible association between them (for source ’s spectrum, see § 3.3).
3.2. Spatial Distribution Analysis
We analyzed the spatial distribution of the Kes 27 counterpart to determine whether it is point-like or extended. We used both a point source and uniform disk models with power-law spectra at the best-fit position to analyze the emission in the 3–300 GeV range. Source was included in the source model. The searched radius range for the uniform disks was 01–05 with a step of 01. Additionally in the analysis, only front converting events for the instrument response function P7REP_SOURCE_V15::FRONT were included, which allows to reduce the PSF of the LAT point sources to 03 (68% containment) in 3 GeV range. For the point source, we set the spectral normalizations of the sources within 8 degrees from Kes 27 as free parameters, and fixed all the other parameters in the source model at the Fermi 2-year catalog values. The spectral indices of Kes 27 and source , and the spectral index and cutoff energy of PSR J15435149 were fixed at the values obtained from likelihood analysis in the 0.2 GeV energy range. For the disk models, we fixed all spectral parameters of the sources in the source model at the values obtained above, but set the spectral normalization parameters of the disk models free. No significant extended emission was detected; TSext values, calculated from , were smaller than 0.
3.3. Spectral Analysis
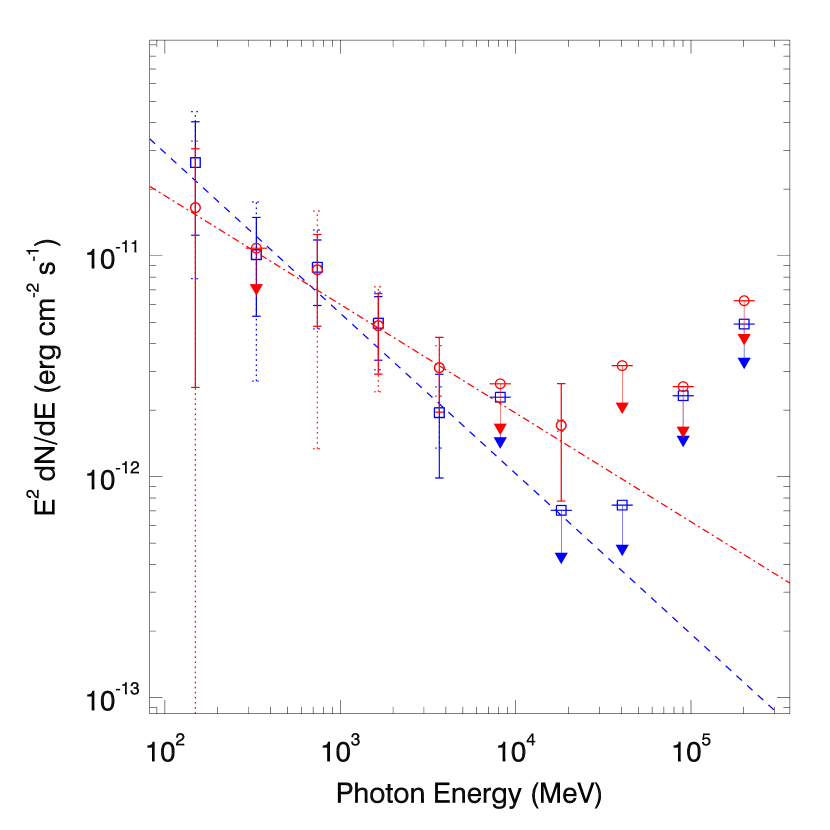
Considering the Kes 27 counterpart and source as point sources at their best-fit positions, their -ray spectra were extracted by performing maximum likelihood analysis to the LAT data in 10 evenly divided energy bands in logarithm from 0.1–300 GeV. By assuming a power law for emission in each energy band, the obtained fluxes are less model dependent, providing a good description for the -ray emission of a source. The source model included all sources in the Fermi 2-year catalog and the pulsar J15435149. The spectral normalizations of the sources within 8 degrees from Kes 27 were set as free parameters, while all the other parameters of sources were fixed at the values we obtained above in Section 3.1. We kept only spectral flux points with TS greater than 4 (corresponding to the detection significance of 2), and derived 95% flux upper limits in the other energy bands. The obtained spectra of the counterpart to Kes 27 and source are shown in Figure 3, and the flux and uncertainty values are given in Table 1. From the flux measurements, it can be noted that source was more significantly detected at energies of 1 GeV.
In addition to the statistical uncertainties obtained above, we note that the LAT effective area introduces approximately 5%–10% systematic uncertainties to the energy fluxes (Nolan et al., 2012; Abdo et al., 2013). There are also systematic uncertainties due to the Galactic diffuse emission model, which can be estimated from repeating the likelihood analysis in each energy band, with the normalization of the diffuse component artificially fixed to the 6% deviation from the best-fit value (see e.g., Abdo et al. 2009, 2010a, 2010c). The uncertainties estimated in this way are provided in Table 1. They are the dominant ones in the systematic uncertainties (Abdo et al., 2010a, 2013).
4. Discussion
4.1. Source Identification
Having analyzed 5.7 year Fermi/LAT data of the Kes 27 region, we found a -ray source at the position consistent with that of the radio brightness peak of the SNR. The -ray source has power-law emission with photon index of 2.5, and the total 0.2–300 GeV flux is approximately 2.6 erg s-1 cm-2. We performed spatial distribution analysis in the 3 GeV energy range, but no significant extended emission was detected for the source. The 0.2 GeV detection significance of the source for a point-source profile at the best-fit position is 8.
The positional coincidence strongly suggests the association of the -ray source with Kes 27, the emission of which is enhanced and thus detectable due to the SNR’s interaction with a nearby dense cloud. The Fermi detected SNRs that are interacting with dense clouds can appear to have prominent flux peaks around GeV, which is likely to be explained by the hadronic scenario (e.g., Li & Chen 2012 and references therein): a cloud with high mass density acts as a large target for relativistic protons to interact with and decay into neutral pions and subsequently -rays. For example, the SNRs W44 (Giuliani et al., 2011), HB 21 (Pivato et al., 2013), and IC 443 (Ackermann et al., 2013) were observed to have such features in their spectra. Some of the interacting SNRs may not appear to have the prominent features, with the spectra described by models such as a flat power law (; e.g., G296.510.0, Araya 2013; W41, Castro et al. 2013; RCW 103, Xing et al. 2014), a relative soft power law (; e.g., MSH 1739, Castro et al. 2013), or a curved power law (e.g., W51C, Abdo et al. 2009; Kes 79, Auchettl et al. 2014). However, the spectral data points of these SNRs at energies of several hundreds of MeV were detected with low TS values and thus large uncertainties. When the spectral energy distributions (SEDs) of them were constructed combining results from observations at TeV energies, the SEDs were found to also peak around 1 GeV.
The spectrum of the source at the southeast of Kes 27 is very similar in this respect by having only significant emission above 1 GeV. Although this source is located in a complex region, having two nearby sources (2FGL J1554.45317c and 2FGL J1551.35333c) and an additional -ray source possibly associated with a background candidate AGN, the analysis of 3 GeV data clearly separates it from the nearby sources. Further considering distance kpc to the source, its luminosity is approximately 5.8 erg s-1, which is in the luminosity range of the currently detected SNRs. The -ray luminosities are 1033–1034 erg s-1 and 1036 erg s-1 for young and middle-aged SNRs, respectively, although we note that several young SNRs with relatively hard -ray spectra probably have leptonic dominated emission (e.g., Abdo et al. 2011; Tanaka et al. 2011).
We searched in the SIMBAD Astronomical Database within the 2 error circle of the best-fit position of the -ray source, and only a few normal stars are known in the region. The position, spectrum, and flux (or luminosity if we assume 4.3 kpc source distance) of the source all support its association with Kes 27. We thus conclude that we have likely found the -ray emission from the strongest interaction region of Kes 27.
4.2. Origin of the -ray Emission
Chandra X-ray imaging of the field resolved the SNR into different substructures, one of which is a dense knot in eastern side region E1 that corresponds to the radio brightness peak. Emission from these substructures results from thermal plasma radiation, which does not provide any direct information about non-thermal particles at the shock (see Chen et al. 2008 for the details). Radio flux measurements of Kes 27 can be described by a power law with a spectral index of (Caswell et al., 1975; Milne et al., 1989), but are for the whole SNR. We therefore only considered the -ray emission in the following modelling.
We first explored the possibility that the -rays originate from direct collision of the accelerated protons with the surrounding dense gas (the HI shell and, specifically, the southeastern cloud) without diffusive process. The detailed algorithm given in Kelner et al. (2006) was adopted here to calculate the -decay -rays. We assumed that the energy distribution of accelerated protons have power law form with index , and that the average gas density of the surrounding target gas () is of order 1–10 cm-3. To explain the observed GeV fluxes, the energy converted into relativistic protons is required to be erg. This corresponds to a fraction of the explosion energy converted into protons’ energy (where denotes the supernova explosion energy in units of erg). This is plausible in view of the presence of the surrounding dense HI gas and especially, the dense clump on the southeastern edge (McClure-Griffiths et al., 2001; Chen et al., 2008). If the hot gas density (as high as cm-3) obtained from the X-ray emission along the eastern boundary (regions E1 and E2) can be a reference value for the target gas density, the conversion fraction would be in a moderate range within . In this scenario, the proton index is the same as the -ray photon index, , as obtained from the spectral fit. This value seems slightly high, as compared to 2.1–2.4 derived from the observed slope of the detected cosmic ray spectrum at Earth (Gabici, 2013), and would be difficult to be theoretically explained for the shock accelerated protons.
However, a high proton index can be naturally expected if the accelerated protons experience a diffusion process before they bombard the surrounding dense gas. The centroid of the -ray TS map is essentially located outside the southeastern boundary (see Figure 2) and appears to be coincident with the HI cloud on the southeast (McClure-Griffiths et al., 2001). Therefore, the adjacent cloud may be ‘illuminated’ by the protons escaping from the SNR. A convenient algorithm has been established for such a bombardment for the illumination of an adjacent cloud by the diffusive energetic protons escaping from an expanding SNR shock front (Li & Chen, 2010). In this scenario, at a given position for the dense cloud outside the SNR, the proton spectrum is obtained by accumulating all the contribution of the escaping protons throughout the entire history of the SNR expansion. When this accumulative collection of diffusive protons collides with the nearby cloud, the -decay -rays emanate. The power-law index of the escaping protons will be higher than and approaches (Aharonian & Atoyan, 1996), where is the power-law index of diffusion coefficient (, and = 0.3–0.7; e.g., Berezinskii et al. 1990). We hereby refer to Li & Chen (2010) and the references therein for details of the model.
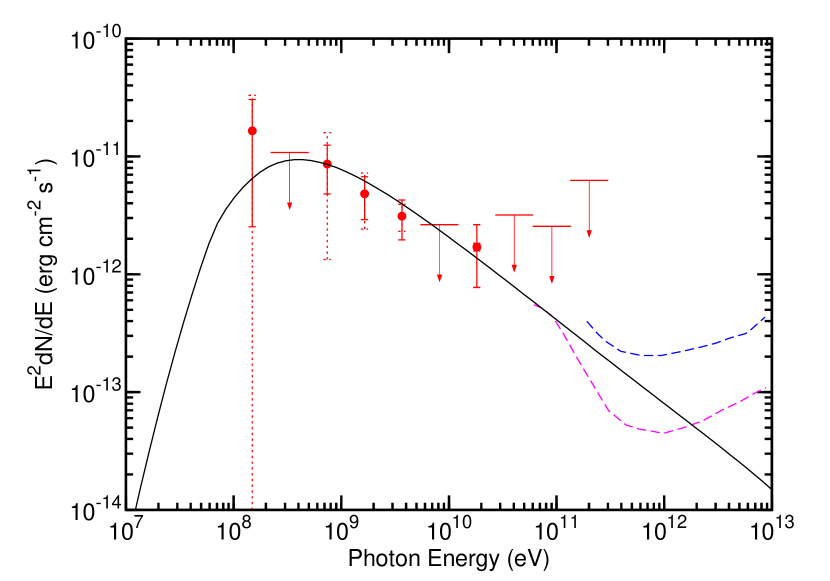
In our calculation using the latter model, an age of yr is adopted for SNR Kes 27. At a distance of 4.3 kpc, the SNR is pc in radius and the HI cloud is thus assumed to be at pc away from the center of the SNR. Other parameters used in the calculation were the fraction of the explosion energy converted into the accelerated protons (Blandford & Eichler, 1987), the spectral index for the energy distribution of the protons (e.g., Giuliani et al. 2010), and the correction factor of slow diffusion around the SNR (Fujita et al., 2009). The parameters and determine the diffusion coefficient and thus the diffusion radius in the model. In the calculation to fit the observed -ray spectrum, and a total cloud mass of are required. The model spectrum is shown in Figure 4. The model cloud mass is consistent with the observation. Actually, according to McClure-Griffiths et al. (2001), the bulk (including the core) of the HI cloud on the southeast appears to be outside the SNR’s edge. The hot gas density is cm-3 in region E1 (Chen et al., 2008), and may be no higher than the average gas density of the cloud, since this region is likely in the outer part of the cloud. Therefore, the cloud, degree in angular radius, may thus have a mass . We note that our model spectrum is slightly lower than the sensitivity limit of HESS (Aharonian et al. 2006; see Figure 4), which may explain the non-detection of Kes 27 at TeV energies in the HESS Galactic plane survey (Carrigan et al., 2013). Considering the much improved sensitivity of the Cherenkov Telescope Array (CTA), the Fermi detection of Kes 27 can be confirmed by CTA observations, and the model used here may also be tested or constrained.
References
- Abdo et al. (2009) Abdo, A. A., Ackermann, M., Ajello, M., et al. 2009, ApJ, 706, L1
- Abdo et al. (2010a) —. 2010a, ApJ, 718, 348
- Abdo et al. (2010b) —. 2010b, ApJ, 710, L92
- Abdo et al. (2010c) —. 2010c, ApJ, 722, 1303
- Abdo et al. (2010d) —. 2010d, Science, 327, 1103
- Abdo et al. (2010e) —. 2010e, ApJ, 712, 459
- Abdo et al. (2010f) —. 2010f, ApJ, 715, 429
- Abdo et al. (2011) —. 2011, ApJ, 734, 28
- Abdo et al. (2013) Abdo, A. A., Ajello, M., Allafort, A., et al. 2013, ApJS, 208, 17
- Acciari et al. (2011) Acciari, V. A., Aliu, E., Arlen, T., et al. 2011, ApJ, 730, L20
- Ackermann et al. (2013) Ackermann, M., Ajello, M., Allafort, A., et al. 2013, Science, 339, 807
- Aharonian et al. (2006) Aharonian, F., Akhperjanian, A. G., Bazer-Bachi, A. R., et al. 2006, ApJ, 636, 777
- Aharonian & Atoyan (1996) Aharonian, F. A., & Atoyan, A. M. 1996, A&A, 309, 917
- Araya (2013) Araya, M. 2013, MNRAS, 434, 2202
- Atwood et al. (2009) Atwood, W. B., Abdo, A. A., Ackermann, M., et al. 2009, ApJ, 697, 1071
- Auchettl et al. (2014) Auchettl, K., Slane, P., & Castro, D. 2014, ApJ, 783, 32
- Berezinskii et al. (1990) Berezinskii, V. S., Bulanov, S. V., Dogiel, V. A., & Ptuskin, V. S. 1990, Astrophysics of cosmic rays
- Blandford & Eichler (1987) Blandford, R., & Eichler, D. 1987, Phys. Rep., 154, 1
- Carrigan et al. (2013) Carrigan, S., Brun, F., Chaves, R. C. G., et al. 2013, ArXiv e-prints
- Castro et al. (2013) Castro, D., Slane, P., Carlton, A., & Figueroa-Feliciano, E. 2013, ApJ, 774, 36
- Caswell et al. (1975) Caswell, J. L., Clark, D. H., & Crawford, D. F. 1975, Australian Journal of Physics Astrophysical Supplement, 37, 39
- Chen et al. (2008) Chen, Y., Seward, F. D., Sun, M., & Li, J.-t. 2008, ApJ, 676, 1040
- Ellison et al. (2010) Ellison, D. C., Patnaude, D. J., Slane, P., & Raymond, J. 2010, ApJ, 712, 287
- Enoguchi et al. (2002) Enoguchi, H., Tsunemi, H., Miyata, E., & Yoshita, K. 2002, PASJ, 54, 229
- Ferrand & Safi-Harb (2012) Ferrand, G., & Safi-Harb, S. 2012, Advances in Space Research, 49, 1313
- Fujita et al. (2009) Fujita, Y., Ohira, Y., Tanaka, S. J., & Takahara, F. 2009, ApJ, 707, L179
- Gabici (2013) Gabici, S. 2013, in Astrophysics and Space Science Proceedings, Vol. 34, Cosmic Rays in Star-Forming Environments, ed. D. F. Torres & O. Reimer, 221
- Giuliani et al. (2010) Giuliani, A., Tavani, M., Bulgarelli, A., et al. 2010, A&A, 516, L11
- Giuliani et al. (2011) Giuliani, A., Cardillo, M., Tavani, M., et al. 2011, ApJ, 742, L30
- Green (2009) Green, D. A. 2009, Bulletin of the Astronomical Society of India, 37, 45
- Kawasaki et al. (2005) Kawasaki, M., Ozaki, M., Nagase, F., Inoue, H., & Petre, R. 2005, ApJ, 631, 935
- Kelner et al. (2006) Kelner, S. R., Aharonian, F. A., & Bugayov, V. V. 2006, Phys. Rev. D, 74, 034018
- Lamb & Markert (1981) Lamb, R. C., & Markert, T. H. 1981, ApJ, 244, 94
- Lande et al. (2012) Lande, J., Ackermann, M., Allafort, A., et al. 2012, ApJ, 756, 5
- Li & Chen (2010) Li, H., & Chen, Y. 2010, MNRAS, 409, L35
- Li & Chen (2012) —. 2012, MNRAS, 421, 935
- McClure-Griffiths et al. (2001) McClure-Griffiths, N. M., Green, A. J., Dickey, J. M., et al. 2001, ApJ, 551, 394
- Milne et al. (1989) Milne, D. K., Caswell, J. L., Kesteven, M. J., Haynes, R. F., & Roger, R. S. 1989, Proceedings of the Astronomical Society of Australia, 8, 187
- Ng et al. (2014) Ng, C., Bailes, M., Bates, S. D., et al. 2014, MNRAS, 439, 1865
- Nolan et al. (2012) Nolan, P. L., Abdo, A. A., Ackermann, M., et al. 2012, ApJS, 199, 31
- Pivato et al. (2013) Pivato, G., Hewitt, J. W., Tibaldo, L., et al. 2013, ApJ, 779, 179
- Seward (1990) Seward, F. D. 1990, ApJS, 73, 781
- Seward et al. (1996) Seward, F. D., Kearns, K. E., & Rhode, K. L. 1996, ApJ, 471, 887
- Tanaka et al. (2011) Tanaka, T., Allafort, A., Ballet, J., et al. 2011, ApJ, 740, L51
- Whiteoak & Green (1996) Whiteoak, J. B. Z., & Green, A. J. 1996, A&AS, 118, 329
- Xing et al. (2014) Xing, Y., Wang, Z., Zhang, X., & Chen, Y. 2014, ApJ, 781, 64
| (A) | (B) | |
| (GeV) | (10-12 erg cm-2 s-1) | (10-12 erg cm-2 s-1) |
| 0.15 | 16.514.016.5 | 26.414.018.5 |
| 0.33 | 10.8 | 10.14.87.4 |
| 0.74 | 8.63.87.3 | 8.92.94.2 |
| 1.65 | 4.81.92.4 | 4.91.61.9 |
| 3.67 | 3.11.20.8 | 1.91.00.6 |
| 8.17 | 2.6 | 2.3 |
| 18.20 | 1.70.90.1 | 0.7 |
| 40.54 | 3.2 | 0.8 |
| 90.27 | 2.6 | 2.3 |
| 201.03 | 6.3 | 4.9 |
Note. — The first uncertainties are statistical uncertainties. The second uncertainties are systematic uncertainties introduced by the Galactic diffuse emission. The 5–10% systematic uncertainties introduced by the LAT effective area are not listed here. Fluxes without uncertainties are the 95 upper limits.