A Rapidly Spinning Black Hole Powers the Einstein Cross
Abstract
Observations over the past 20 years have revealed a strong relationship between the properties of the supermassive black hole (SMBH) lying at the center of a galaxy and the host galaxy itself. The magnitude of the spin of the black hole will play a key role in determining the nature of this relationship. To date, direct estimates of black hole spin have been restricted to the local Universe. Herein, we present the results of an analysis of 0.5 Ms of archival Chandra observations of the gravitationally lensed quasar Q 2237+305 (aka the “Einstein-cross”), lying at a redshift of z = 1.695. The boost in flux provided by the gravitational lens allows constraints to be placed on the spin of a black hole at such high redshift for the first time. Utilizing state of the art relativistic disk reflection models, the black hole is found to have a spin of at the 90% confidence level. Placing a lower limit on the spin, we find (4). The high value of the spin for the black hole in Q 2237+305 lends further support to the coherent accretion scenario for black hole growth. This is the most distant black hole for which the spin has been directly constrained to date.
Subject headings:
accretion, accretion disks — black hole physics — relativistic processes — quasars: individual (Q 2237+305) — galaxies: high-redshift1. Introduction
Black holes play a key role in the growth and evolution of galaxies, and their stellar content (Fabian, 2012). The spin of the black hole () is crucial as it can influence both the radiative and kinetic components of the energy output. In an optically thick geometrically thin accretion disk the radiative efficiency, and hence luminosity (), of the inner region depends on the spin, peaking at for a maximal spin black hole (, Thorne 1974). This should be compared to the fiducial spin value estimated from observations of the cosmic X-ray background (CXB, or equivalently , Soltan 1982). Similarly, if relativistic jets are powered by tapping the spin of the black hole via, for example the “Blandford-Znajek” process, a larger spin may result in a more powerful jet ( , where is the magnetic flux, Blandford & Znajek 1977). Hence, the spin distribution of black holes is a crucial ingredient in the feedback process effecting the co-evolution of the black hole and its host galaxy (Fabian, 2012).
Direct constraints on the spin of a black hole are now possible via modeling the accretion disk reflection spectrum (Lightman & White, 1988; Fabian et al., 1989; Tanaka et al., 1995; Miller, 2007). Detailed observations of AGN in the local universe () illustrate the power of this method to constrain the inner accretion flow geometry in the strong GR regime through both spectral (e.g., Fabian et al. 2009; Risaliti et al. 2013; Reynolds 2013) and timing methods (e.g., Zoghbi et al. 2012; De Marco et al. 2013; Kara et al. 2013; Uttley et al. 2014). However, at the current time it is only possible to indirectly probe the spin distribution for black holes at high redshift (Davis & Laor, 2011; Wu et al., 2013; Trakhtenbrot, 2014), though such methods are necessarily hampered by substantial systematic uncertainties, e.g., Raimundo et al. (2012).
In order to determine the influence of the black hole on structure growth we would like to probe the spin distribution out to the epoch of peak galaxy and star formation (). In Reis et al. (2014), we demonstrated how the boost in flux provided by a strong gravitational lens can be used to constrain the spin of a SMBH lying at a cosmologically relevant distance, i.e., RX J1131-1231 at z = 0.658 (). The black hole was found to have a large spin, at the 3 confidence level. This is the most distant SMBH for which the spin of the black hole has been directly measured to date. The high spin value would support the coherent accretion scenario (e.g., Volonteri et al. 2013). This source class opens up a promising avenue to begin to constrain SMBH spin evolution as a function of redshift, and will facilitate comparison with black hole host-galaxy co-evolution models, in particular as models become increasingly sophisticated, e.g., Dubois et al. (2014); Sesana et al. (2014).
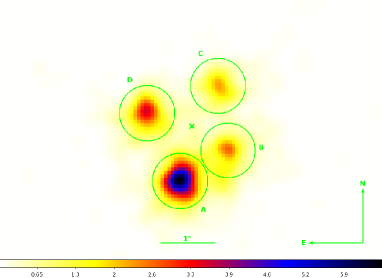
Q 2237+305 was discovered by Huchra et al. (1985) and determined to be a strongly lensed quasar lying at a redshift of z = 1.695. The quasar is lensed by a Sab barred galaxy at z = 0.0395 into 4 distinct components (Yee, 1988). Due to the low redshift of the lens, Q 2237+305 commanded immediate interest due to the short inter image time-delays ( is 3 hr) and the discovery of micro-lensing, which facilitate detailed study of the quasar and lensing galaxy (see Fig. 1; Irwin et al. 1989; Wambsganss & Paczynski 1994). Optical spectroscopy of the gravitationally distorted quasar host galaxy has resulted in the detection of broad and narrow line region components consistent with emission from a typical Seyfert galaxy, e.g., Motta et al. (2004). The black hole has been constrained to have a mass of , based on analysis of the H emission line (Assef et al., 2011). In addition to being quadruply lensed, the quasar flux is also magnified with an average magnification 16 (Schmidt et al., 1998).
The system is of significant interest at X-ray energies as micro-lensing can provide constraints on the inner accretion flow at AU scales (Chartas et al., 2012). The quasar is viewed almost face-on (Poindexter & Kochanek, 2010; Sluse et al., 2011). First resolved at X-ray wavelengths by Chandra, where in addition to the detection of an iron K line, a time delay at X-ray energies was also detected (; Dai et al. 2003). The micro-lensing studies have also enabled constraints on the size of the corona, where the source of the hard X-ray emission has been constrained to be compact with a size or (Mosquera et al., 2013), and the temperature profile of the accretion disk, which is found to be consistent with expectations from standard thin accretion disk theory, i.e., , Morgan et al. 2010).
In this paper, we describe analysis of archival Chandra observations of Q 2237+305, where we directly measure the spin of the SMBH lying at a redshift of .
2. Observations
Our sample consists of 26 observation in total, obtained over the first 13 yrs of operation of Chandra, i.e., ut000906 – ut130106 where the relevant observation IDs are: 00431, 01632, 06831–06840, 11534–11539, 12831, 12832, 13191, 13195, 13960, 13961, 14513, 14514. Analysis of the majority of these observations have been previously presented in the context of micro-lensing studies of Q 2237+305 by Dai et al. (2003); Chen et al. (2012) and collaborators. With the exception of the first 2 observations, which were taken with the standard full frametime of 3.24s, all subsequent observations were obtained with a frametime of 1.74s. The summed exposure time is 468 ks.
The analysis procedure follows that undertaken in our analysis of the lensed quasar RX J1131-1231 (Reis et al., 2014). In brief, all data are re-processed in ciao v4.5111http://cxc.harvard.edu/ciao utilizing the latest Chandra calibration files in the standard manner. Although the individual components of Q 2237+305 are separated by mere arc seconds, the unique spatial resolution of Chandra facilitates straightforward imaging of this lensed quasar at X-ray energies. Here advantage is taken of the native sub-arcsecond spatial resolution provided by the Chandra mirrors and now available via the EDSER algorithm in ciao. All images are re-binned to 1/8th of the native ACIS pixel size before smoothing with a Gaussian of 0.25. An example image is displayed in Fig. 1. Spectra are extracted from 0.5 radius regions via the specextract script with the PSF correction enabled, where the regions are re-centered on each individual component in each image prior to extraction. The overall flux from each individual lensed image from each observation was examined to determine if any of the observations are affected by pile-up222http://cxc.harvard.edu/ciao/download/doc/pileup_abc.pdf. Unsurprisingly given the cosmological distance, pile-up does not affect any of the observations considered herein. For completeness, the solitary XMM-Newton exposure obtained in 2002 is also considered (Fedorova et al., 2008).
All spectra are subsequently combined using the combine_spectra script before grouping to a signal-to-noise ratio of 3 per spectral bin with dmgroup. The spectra and background files are then exported to xspec v12.8.0m333http://heasarc.gsfc.nasa.gov/xanadu/xspec/ for spectral analysis.
3. Analysis & Results
The final summed Chandra spectrum contains data from 26 observations with 4 lensed images of the source per observation resulting in a total on source time of 1.8 Ms. The resulting spectrum contains approximately 22 k net counts in the 0.35 – 8.0 keV energy range. Data outside this interval are not considered further due to low S/N and/or high backgrounds.
Initially, the brightest source image in each observation was characterized with a simple power-law in order to search for evidence of extreme micro-lensing variability, which can affect the Fe K region by, for example, introducing narrow red-shifted Fe line components to the spectrum, such as that previously observed in RX J1131-1231 (Chartas et al., 2012). The brightest image does not reveal any evidence for any anomalous variability; although, we note that the S/N is necessarily low in individual exposures.
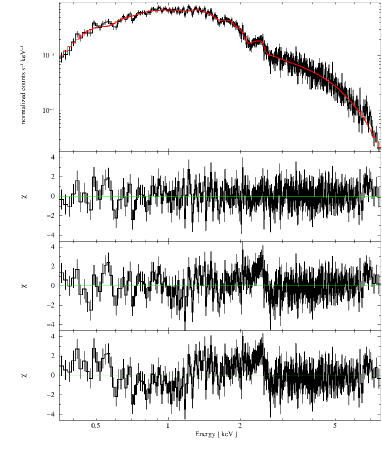
Our energy range of interest 0.35 – 8 keV corresponds to the energy range 0.94 – 21.56 keV in the quasar rest frame, thus providing access to the Fe K line and a portion of the Compton hump region of the reflection spectrum. To characterize the spectrum, we fit the data with a simple power-law modified by absorption in the Galaxy and the lens, i.e., pha(zpha(zpo))444The abundance model of Asplund et al. (2009) is used throughout this work, i.e., aspl. where and (Dai et al., 2003). This fit reveals characteristic residuals consistent with those expected from the soft excess at lower energies ( 1 keV) and a broad iron line at a rest-frame energy of 6.4 keV, see Fig. 2. In the standard manner, we initially characterize the properties of the observed residuals using simple models, e.g., see Reis et al. (2014).
The soft excess is accounted for using a diskbb component. Fitting the broad line component with a Gaussian reveals a broad line (EW = 167, ) whose centroid energy is skewed to lower energies (), as it attempts to account for the red wing of what is in fact a relativistically broadened line. To more accurately model this line, we utilize the relativistic line model relline of Dauser et al. (2010). The final phenomenological model (pha(zpha(diskbb+po+relline))) provides an excellent fit to the data () as is evidenced in Fig. 2. Of particular note, the relline component suggests a rapidly spinning black hole viewed at low inclination, i.e., , , , , , and where all of the errors are at the 90% confidence level. The low inclination returned by the model agrees with previous work suggesting the quasar is viewed approximately face-on (Poindexter & Kochanek, 2010; Sluse et al., 2011). The radial emissivity profile of the reflected emission is parameterized by a broken power-law, where the large inner index is consistent with preferentially beamed emission from a compact corona, lying at small separation from the black hole, onto the inner disk due to a rapidly spinning black hole, e.g., see Wilkins & Fabian (2012).
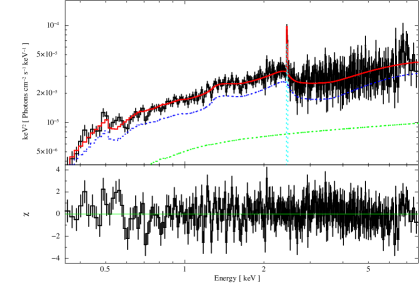
Given the clear presence of reflection signatures in the spectrum, we now proceed to apply a self consistent disk reflection model in combination with a state of the art relativistic convolution kernel: relconv and reflionx (Dauser et al., 2010; Ross & Fabian, 2005). Our final model is pha(zpha(zpo + zgauss + relconv*reflionx))555Our results using the reflionx reflection tables were compared to similar fits using the recent xillver reflection tables of García et al. (2013), and were found to be consistent within the quoted errors.. As this model is physically self-consistent, an additional narrow Gaussian line is required to fit the observed line profile (, EW 40 eV), see Fig. 3. This differs from the simple model above where the relline component is free to fit the data without knowledge of the broader continuum. Nonetheless, the parameters of the inner accretion flow are remarkably similar to the phenomenological model, i.e., (90% confidence level). This model is reflection dominated, , where the reflection fraction is defined , see Table 1 for details.
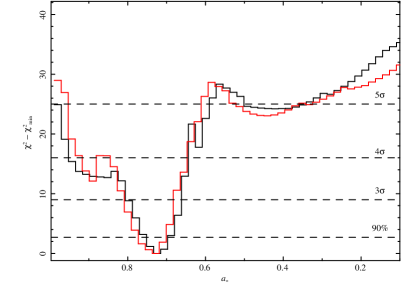
The solar abundance model is of slightly lower quality in comparison to the phenomenological model presented earlier, with evidence of systematic residuals at low energy (compare Fig. 2 & 3). Enhanced iron abundances have been discovered in the inner accretion disk for a number of AGN, e.g., Fabian et al. (2009); Risaliti et al. (2013). As such, the above model is re-fit with a variable iron abundance (). This model is qualitatively similar to the solar abundance model, see Table 1. However, the enhanced reflection component in the iron band results in a modified continuum requiring a mildly harder illuminating power-law () and commensurately higher ionization of the accretion disk (). The iron abundance is large, (90%) reducing to at the 3 confidence level. In Fig. 3 (right), we plot confidence contours of the spin parameter for both models. It is clear that our ability to constrain the spin is robust with respect to our ability to constrain the Fe abundance.
The 2 – 10 keV rest frame luminosity is measured to be (Table 1). Given that the bolometric correction and the magnification of this quasar work in the opposite sense and likely have similar magnitudes (within a factor of 2, i.e., Schmidt et al. 1998; Vasudevan & Fabian 2007), this luminosity corresponds to a relatively low Eddington rate of .
Finally, we note that the above model was also applied to the single existing XMM-Newton observation (Fedorova et al., 2008). This observation resulted in only 12 ks goodtime with EPIC/pn and 20 ks for each of the MOS CCDs. The S/N in this observation is low, containing only 2000 counts in the EPIC/pn exposure, and 1000 with each MOS camera. Nonetheless, the spectrum is consistent with the reflection spectrum detected by Chandra at higher S/N discussed above. As such, we do not consider this dataset further.
| Parameter | ||
|---|---|---|
| 0.05 | 0.05 | |
| (0.11 0.01) | (0.06 0.01) | |
| 6.58 0.03 | 6.58 | |
| (6.6 2.9) | (6.6 3.1) | |
| 1.80 | 1.640.04 | |
| (3.9) | (7.80.08) | |
| 3.020.25 | 3.310.28 | |
| 4.65 | 4.35 | |
| 0.73 | 0.74 | |
| 681 | 993 | |
| 1.0 | ||
| (8.5) | (2.8) | |
| — | — | — |
| 2.4 | 0.40 0.12 | |
| — | — | — |
| 388/339 | 371/338 |
4. Discussion
In this paper we present a direct measurement of the spin of the black hole at high redshift, i.e., . This is the most distant black hole for which a direct constraint on the spin has been made to date. The spin of the black hole in the quasar Q 2237+305 is found to be 0.65 at the 4 confidence level. Thus the Q 2237+305 SMBH is rapidly rotating during the epoch of peak star formation and galaxy growth. Models for the spin evolution of a growing SMBH predict the largest differences for the most massive black holes (, e.g., Volonteri et al. 2013). As a probe of SMBH/galaxy co-evolution, the measured high spin for the black hole in Q 2237+305 would support the coherent accretion scenario for black hole growth. It is also noteworthy that the high measured value for the spin implies an accretion efficiency consistent with or greater than that implied by the Soltan argument (Soltan, 1982).
Our analysis is necessarily aggressive given the moderate number of counts available. However, the theoretical and observational support for the reflection model utilized herein has considerable support from an increasing number of high S/N ratio observations at low redshift, e.g., Fabian et al. (2009); Zoghbi et al. (2012); De Marco et al. (2013); Risaliti et al. (2013); Kara et al. (2013); Walton et al. (2014). The best fit reflection model requires an enhanced iron abundance (, see Table 1). Such a large iron abundance in the inner accretion flow has been observed in a number of local Universe AGN, e.g., 1H0707-495 (Fabian et al., 2009), NGC 1365 (Risaliti et al., 2013), and in larger samples of systems (Walton et al., 2013).
The enhanced iron abundance is required by the presence of residuals at low energies, i.e., 1 keV in the observer frame. This corresponds to rest frame energies 2.7 keV. Such residuals can in principle originate in an absorption component (Miller et al., 2008), though a large column would be required to effect emission at such high energies. This possibility was investigated by the addition of a partial covering absorber to the solar abundance model, i.e., pha(zpha(zpcfabs(zpo+zgauss+relconv*reflionx))). The improvement in the fit is similar to the variable abundance model but with an extra degree of freedom (()). The column density is large as expected, , and a covering fraction . This model requires a soft power-law index of . This model is disfavored for a number of reasons: (i) optical studies of Q 2237+305 find the extinction to be modest (, Agol et al. 2000) and consistent with the small X-ray column i.e., (Dai et al., 2003), (ii) optically thick winds are unlikely to form in the inner disks of AGN at the luminosity observed herein (, Reynolds 2012), and (iii) the recent NuStar observations of low redshift AGN, which have demonstrated the broadband spectrum to be consistent with the reflection scenario, e.g., Risaliti et al. (2013); Walton et al. (2014).
Q 2237+305 is the second high redshift quasar that we have been able to measure the spin of by taking advantage of the boost in flux provided by a strong gravitational lens. Previously, the spin of the SMBH in the z = 0.658 quasar RX J1131-1231 has been determined to be (Reis et al., 2014), also consistent with the coherent accretion scenario.
Models for black hole growth and evolution and their co-evolution with the host galaxy are becoming more sophisticated, e.g., Dubois et al. (2014); Sesana et al. (2014). However, it is important to note that caution is required in interpreting these observational results at the current time. Apart from the small size of the sample, the quasars for which this type of study will be possible do not form a statistically complete sample and as such may be subject to considerable bias, e.g., we could be sampling the most luminous systems as the luminosity of the accretion flow will have a spin dependence with larger spins facilitating more luminous inner accretion flows.
Finally, we note that quasars are known to be a major contributor to the CXB, as such knowledge of the precise form of their SED is important (Ueda et al., 2014). The reflection contribution to the X-ray spectrum of Q 2237+305 is uncertain primarily due to our inability to accurately constrain the iron abundance in the current observation, i.e., (see Table 1). Further observations will be required in order to constrain the iron abundance and hence the reflection fraction of this high redshift black hole.
References
- Agol et al. (2000) Agol, E., Jones, B., & Blaes, O. 2000, ApJ, 545, 657
- Asplund et al. (2009) Asplund, M., Grevesse, N., Sauval, A. J., & Scott, P. 2009, ARA&A, 47, 481
- Assef et al. (2011) Assef, R. J., Denney, K. D., Kochanek, C. S., et al. 2011, ApJ, 742, 93
- Blandford & Znajek (1977) Blandford, R. D., & Znajek, R. L. 1977, MNRAS, 179, 433
- Chartas et al. (2012) Chartas, G., Kochanek, C. S., Dai, X., et al. 2012, ApJ, 757, 137
- Chen et al. (2012) Chen, B., Dai, X., Kochanek, C. S., et al. 2012, ApJ, 755, 24
- Dai et al. (2003) Dai, X., Chartas, G., Agol, E., Bautz, M. W., & Garmire, G. P. 2003, ApJ, 589, 100
- Dauser et al. (2010) Dauser, T., Wilms, J., Reynolds, C. S., & Brenneman, L. W. 2010, MNRAS, 409, 1534
- Davis & Laor (2011) Davis, S. W., & Laor, A. 2011, ApJ, 728, 98
- De Marco et al. (2013) De Marco, B., Ponti, G., Cappi, M., et al. 2013, MNRAS, 431, 2441
- Dubois et al. (2014) Dubois, Y., Volonteri, M., & Silk, J. 2014, MNRAS, 440, 1590
- Fabian et al. (2009) Fabian, A. C., Zoghbi, A., Ross, R. R., et al. 2009, Nature, 459, 540
- Fabian et al. (1989) Fabian, A. C., Rees, M. J., Stella, L., & White, N. E. 1989, MNRAS, 238, 729
- Fabian (2012) Fabian, A. C. 2012, ARA&A, 50, 455
- Fedorova et al. (2008) Fedorova, E. V., Zhdanov, V. I., Vignali, C., & Palumbo, G. G. C. 2008, A&A, 490, 989
- García et al. (2013) García, J., Dauser, T., Reynolds, C. S., et al. 2013, ApJ, 768, 146
- Huchra et al. (1985) Huchra, J., Gorenstein, M., Kent, S., et al. 1985, AJ, 90, 691
- Irwin et al. (1989) Irwin, M. J., Webster, R. L., Hewett, P. C., Corrigan, R. T., & Jedrzejewski, R. I. 1989, AJ, 98, 1989
- Kara et al. (2013) Kara, E., Fabian, A. C., Cackett, E. M., et al. 2013, MNRAS, 434, 1129
- Lightman & White (1988) Lightman, A. P., & White, T. R. 1988, ApJ, 335, 57
- Miller (2007) Miller, J. M. 2007, ARA&A, 45, 441
- Miller et al. (2008) Miller, L., Turner, T. J., & Reeves, J. N. 2008, A&A, 483, 437
- Morgan et al. (2010) Morgan, C. W., Kochanek, C. S., Morgan, N. D., & Falco, E. E. 2010, ApJ, 712, 1129
- Mosquera et al. (2013) Mosquera, A. M., Kochanek, C. S., Chen, B., et al. 2013, ApJ, 769, 53
- Motta et al. (2004) Motta, V., Mediavilla, E., Muñoz, J. A., & Falco, E. 2004, ApJ, 613, 86
- Poindexter & Kochanek (2010) Poindexter, S., & Kochanek, C. S. 2010, ApJ, 712, 668
- Raimundo et al. (2012) Raimundo, S. I., Fabian, A. C., Vasudevan, R. V., Gandhi, P., & Wu, J. 2012, MNRAS, 419, 2529
- Reis et al. (2014) Reis, R. C., Reynolds, M. T., Miller, J. M., & Walton, D. J. 2014, Nature, 507, 207
- Reynolds (2012) Reynolds, C. S. 2012, ApJL, 759, L15
- Reynolds (2013) Reynolds, C. S. 2013, SSRv, 81
- Risaliti et al. (2013) Risaliti, G., Harrison, F. A., Madsen, K. K., et al. 2013, Nature, 494, 449
- Ross & Fabian (2005) Ross, R. R., & Fabian, A. C. 2005, MNRAS, 358, 211
- Schmidt et al. (1998) Schmidt, R., Webster, R. L., & Lewis, G. F. 1998, MNRAS, 295, 488
- Sesana et al. (2014) Sesana, A., Barausse, E., Dotti, M., & Rossi, E. M. 2014, arXiv:1402.7088
- Sluse et al. (2011) Sluse, D., Schmidt, R., Courbin, F., et al. 2011, A&A, 528, A100
- Soltan (1982) Soltan, A., 1982, MNRAS, 200, 115
- Tanaka et al. (1995) Tanaka, Y., Nandra, K., Fabian, A. C., et al. 1995, Nature, 375, 659
- Thorne (1974) Thorne, K. S. 1974, ApJ, 191, 507
- Trakhtenbrot (2014) Trakhtenbrot, B. 2014, ApJL, 789, L9
- Ueda et al. (2014) Ueda, Y., Akiyama, M., Hasinger, G., Miyaji, T., & Watson, M. G. 2014, ApJ, 786, 104
- Uttley et al. (2014) Uttley, P., Cackett, E. M., Fabian, A. C., Kara, E., & Wilkins, D. R. 2014, arXiv:1405.6575
- Vasudevan & Fabian (2007) Vasudevan, R. V., & Fabian, A. C. 2007, MNRAS, 381, 1235
- Volonteri et al. (2013) Volonteri, M., Sikora, M., Lasota, J.-P., & Merloni, A. 2013, ApJ, 775, 94
- Walton et al. (2013) Walton, D. J., Nardini, E., Fabian, A. C., Gallo, L. C., & Reis, R. C. 2013, MNRAS, 428, 2901
- Walton et al. (2014) Walton, D. J., Risaliti, G., Harrison, F. A., et al. 2014, ApJ, 788, 76
- Wambsganss & Paczynski (1994) Wambsganss, J., & Paczynski, B. 1994, AJ, 108, 1156
- Wilkins & Fabian (2012) Wilkins, D. R., & Fabian, A. C. 2012, MNRAS, 424, 1284
- Wu et al. (2013) Wu, S., Lu, Y., Zhang, F., & Lu, Y. 2013, MNRAS, 436, 3271
- Yee (1988) Yee, H. K. C. 1988, AJ, 95, 1331
- Zoghbi et al. (2012) Zoghbi, A., Fabian, A. C., Reynolds, C. S., & Cackett, E. M. 2012, MNRAS, 422, 129