Study of Galaxies in the Lynx–Cancer Void. IV. Photometric Properties
Abstract
We present the results of a photometric study of 85 objects from the updated sample of galaxies residing in the nearby Lynx-Cancer void. We perform our photometry on and -band images of the Sloan Digital Sky Survey. We determine model-independent galaxy parameters such as the integrated magnitudes and colors, effective radii and the corresponding surface brightness values, optical radii and Holmberg radii. We analyze the radial surface brightness profiles to determine the central brightness values and scale lengths of the model disks. We analyze the colors of the outer parts of the galaxies and compare them with model evolutionary tracks computed using the PEGASE 2 software package. This allowed us to estimate the time elapsed since the onset of star formation, which turned out to be on the order of the cosmological time for the overwhelming majority of the galaxies studied. However, for 13 galaxies of the sample the time does not exceed Gyr, and for 7 of them Gyr. The latter are mostly unevolved objects dominated by low-luminosity galaxies with . We use the integrated magnitudes and colors to estimate the stellar masses of the galaxies. We estimate the parameter and the gas mass fractions for void galaxies with known H I-line fluxes. A small subgroup (about 10%) of the gas-richest void galaxies with has gas mass fractions that reach 94-99%. The outer regions of many of these galaxies show atypically blue colors. To test various statistical differences between void galaxies and galaxies from the samples selected using more general criteria, we compare some of the parameters of void galaxies with similar data for the sample of 195 galaxies from the Equatorial Survey (ES) based on a part of the HIPASS blind H I survey. The compared samples have similar properties in the common luminosity range . The faintest void galaxies differ appreciably from the ES survey galaxies. However, the ES survey also contains about 7% of the so-called ‘‘inchoate’’ galaxies with high ratios, most of which are located far from massive neighbors and are probably analogs of void galaxies.
Keywords: galaxies: photometry—galaxies: fundamental parameters—galaxies: evolution
1 INTRODUCTION
Voids in the large-scale distribution of galaxies were discovered more than 30 years ago (e.g., joeveer78 ; kirshner81 ). Observationally they are commonly defined as regions with no galaxies of normal and high luminosity: , which corresponds to the break in the galaxy luminosity function (e.g., montero09 ). Voids occupy more than half of the volume of the present-day Universe. Note that the number of galaxies in the voids does not exceed 20% of the total number of catalogued galaxies, and this fraction is indicative of a significantly lower mass density inside these structures. In numerical models of the evolution of matter in the hot Universe with dark matter (DM), voids arise as natural structures and, on the whole, resemble the observed voids rather closely. However, the number of galaxies observed in voids is several times smaller than the predicted number of gravitationally bound DM haloes. The cause of this phenomenon, which was formulated in different forms by de Lapparent deLapparent95 , Peebles Peebles01 , and Tikhonov and Klypin Tikhonov09 , remains unclear.
It is hoped that further improvement of models of the formation and evolution of galaxies will reduce the gap between the number of DM haloes and real galaxies. The above phenomenon may be caused, among other things, by the higher fraction of low surface brightness galaxies (LSBD) in the voids, because such objects are more difficult to detect and identify. More detailed and extensive studies of the properties of galaxies in the voids are needed to understand the situation with such objects. Most of the authors working in this direction (e.g., Rojas04 ; Rojas05 ; patiri06 ) studied large distant voids and, because of natural observational selection, dealt only with the brightest void galaxies (). No substantial differences have been found between these galaxies and similar galaxies in denser structures, except that the former have somewhat bluer colors. In their recent paper Hoyle et al. Hoyle12 studied the photometric properties of almost 90 000 galaxies in about 1000 voids by analyzing their SDSS images. They similarly found that dwarfs of all types in voids are systematically bluer compared to their analogs in denser environments.
One would expect, based on general considerations and simulations, that the effects of the environment on the evolution should be most significant for the least massive galaxies (e.g., kreckel11 ). The currently available results suggest that the following factors should influence the evolutionary status of low-mass galaxies in the voids.
-
(1) An appreciably delayed formation of gravitationally bound DM halos with masses typical of dwarf galaxies in low-density large-scale structures (voids) Einasto06 and slow evolution of (a part of) void galaxies.
-
(2) Voids are filled mostly with low-mass galaxies. Therefore, because of the well-known correlation between luminosity and surface brightness (e.g., cross02 ), their population contains a higher fraction of LSB galaxies. Numerical simulations of the interaction of low- and normal- (high-, HSB) surface brightness disk galaxies mihos97 in the case of their encounters without mergers show that the final response differs strongly for the two types of objects. HSB galaxies respond to such interactions by developing a bar and a mature burst of star formation, whereas the response in LSB galaxies is much weaker with the star-formation rate increasing only slightly. The number of collisions in voids during the lifetime of a galaxy is several times smaller than in the average-density regions, and therefore one would expect an appreciable fraction of void galaxies to have never been affected by ‘‘significant’’ interactions. However, these general considerations should be validated by numerical simulations taking into account many subtle details of the formation and evolution of galaxies.
-
(3) Kreckel et al. kreckel11 analyzed the results of such a simulation of the evolution of galaxies in voids and found evidence suggesting that these galaxies differ from the galaxies in denser regions, but this is only true for the lowest-mass objects in their modeled mass range (which corresponds to luminosities ranging from to ).
It follows from the above that one must search for the possible evolutionary peculiarities in the least massive void galaxies by studying sufficiently close objects.
The first deep sample of 79 galaxies (down to ) in the nearby Lynx-Cancer void was presented by Pustilnik and Teplyakova PaperI . The results of their study suggest that the effect of low-density environment indeed exists for such low-mass galaxies, and that it manifests itself in the slower rate of evolution. According to the conclusions of Pustilnik et al. PaperII , void galaxies have systematically lower metallicities (on the average, by 30%) compared to the galaxies in denser environments. Furthermore, a small but quite significant (about 10%) fraction of void galaxies have peculiar properties typical of evolutionarily young (unevolved) objects PaperIII ; Triplet . We should also mention the so-called Void Galaxy Survey (VGS, kreckel12 ) carried out to study the H I structure and optical properties of about 60 SDSS galaxies residing near the centers of large but relatively distant (approximately 80 Mpc) voids. Only for some of the closest voids of this sample, the luminosities of the galaxies studied are more or less close to the median luminosity of the sample in the Lynx-Cancer void. It is among such galaxies that Kreckel et al. kreckel12 found three very gas-rich objects.
In this paper we report the results of our photometric study of the galaxies in the Lynx-Cancer void based on their -band images from the SDSS DR7 (Sloan Digital Sky Survey Data Release 7) database DR7 . The aim of our photometric analysis is to determine the basic parameters of the sample galaxies in order to study the statistical properties of void galaxies and compare the results with those obtained for other samples of similar galaxies in denser environments or samples based on other criteria. The integrated magnitudes and color indices of the galaxies can be used to estimate their stellar masses. Furthermore, the colors of the outer regions of the galaxies, which usually bear no traces of recent or ongoing star formation, are compared to model evolutionary tracks and used as age indicators for the oldest (visible) stellar population. One of the aims of this study is to estimate these ages.
2 UPDATED GALAXY SAMPLE IN THE LYNX–CANCER VOID
A detailed description of the original sample of galaxies in the Lynx-Cancer void can be found in our earlier paper PaperI , where we present a list of 79 galaxies residing in this void—a simply-connected domain containing no galaxies of normal and high luminosity (here ). The void is described by a sphere with a radius of 8 Mpc together with the adjoining regions. The void galaxies satisfy the condition of sufficient separation (more than 2 Mpc) from galaxies brighter than . We discuss the completeness of the sample in the same paper. As of now, more than 20 new galaxies of the void have been found. Some of them were discovered as a result of a program of the search for new LSB dwarf galaxies in this void, and the remaining ones—as a result of new surveys (mostly the ALFALFA survey haynes11 ) and a detailed analysis of the data for the already known galaxies in this sky area.
We are preparing the updated sample of galaxies of the Lynx-Cancer void for publication. The new version includes 101 galaxies, 16 of which lie outside the sky area covered by SDSS fields. We limit our analysis to 85 galaxies listed in Table 1. We base our study on the updated sample in order to study the photometric properties of void galaxies with maximum completeness.
3 METHODS OF PHOTOMETRIC REDUCTION
The SDSS survey York offers high-quality calibrated images taken in the bands. Therefore primary reduction has to include only one extra step—thorough subtraction of the sky background. We performed this procedure in the ESO-MIDAS environment using the aip package as described in detail in the paper by Kniazev et al. LSB-SDSS . The object under study is masked and the sky background is approximated by a two-dimensional polynomial. The resulting sky background model is then subtracted from the image. The sky background in the masked region is interpolated from the surrounding region. Ring aperture photometry is then performed to measure the flux inside the masked region for the -band images with subtracted background. The inferred fluxes are then converted into integrated magnitudes of the galaxies. To convert the instrumental fluxes into magnitudes, we use a set of photometric coefficients for each field of the SDSS database.
We determine the following model-independent parameters for all galaxies: integrated -band magnitudes, integrated colors, and integrated magnitudes converted from the - and -band magnitudes by the formulas proposed by Lupton Lupton05 . After creation of the surface brightness profile, we estimate for each object the radii and containing 50% and 90% of the -band fluxes of the galaxy. In addition, we estimate the effective surface brightness inside the radius, the observed minor-to-major semiaxis ratio , the ‘‘optical’’ and Holmberg radii holmberg (at the and surface brightness levels respectively). We multiply all the effective radii by a factor of .
Fitting an exponential or Sersic Sersic law to the radial surface brightness profiles allowed us to determine the model parameters of the central -band surface brightness. We then compute the -band central brightness from and by Lupton’s formulas Lupton05 . We also estimate the , and -band () central surface brightness values corrected for the inclination of the galaxy disk to the line of sight and the foreground extinction in our Galaxy in accordance with SF11 . We compute the inclination correction by the formula , where is the angle between the disk plane and the line of sight. For objects with inclinations , we compute the corresponding correction by the formula Matthews99 , where we set the scale length ratio equal to Kruit81 . We compute both corrections assuming negligible internal extinction in the galaxies considered. We compute the angle by the standard formula , where and are the observed axial ratio and the axial ratio of the real disk respectively. We set for relatively bright late-type galaxies and for low-luminosity objects with in accordance with the results of Roychowdhury et al. Roych13 . We also estimate the (characteristic) disk scale length for the -band images and for the Sersic exponent .
3.1 Determination of the Ages
of the Old Stellar Population
We estimate the colors of the outer parts of the galaxies by performing additional photometry inside a set of small circular apertures (with the radii of about 4′′) at the periphery of the galaxies excluding small higher-luminosity areas. We then sum up the flux in these apertures and convert it into magnitudes and colors. For the objects with uncertain positions of the H II regions, we use the H images taken with the 6-m telescope of the Special Astrophysical Observatory. We estimate the time elapsed since the onset of an epoch or a ‘‘short episode’’ of star formation, which under certain assumptions can be used as an age estimate for the oldest visible stars, by comparing the colors of the peripheral regions of galaxies with model evolutionary tracks computed using the PEGASE2 software package pegase .
When selecting the peripheral areas to determine the colors of the oldest population, we choose the areas located far from the center but where the fluxes could still be measured with reasonable accuracy. As a result, the surface brightness levels of the considered peripheral areas vary substantially for galaxies with different surface brightness and/or characteristic size ranging from to with a median value of . We convert the values, actually measured in the radial surface brightness profiles, into parameters adopting the color index typical of void galaxies.
5mm \captionstylenormal
5mm 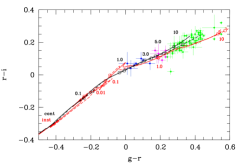
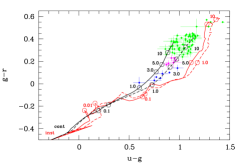
The PEGASE2 software package is designed for computing models of the photometric evolution of galaxies. The main parameters of the models are: the initial mass function , the star-formation law , and stellar metallicity . We use for our analysis the initial mass functions (IMF) of Salpeter Salpeter and Kroupa et al. kroupa , which best describe the observed distributions of stellar masses in the nearby galaxies. We use two extreme scenarios for the star-formation law: an instantaneous episode—a burst—of star formation () and star formation at a constant rate (). The tracks of all other non-exotic scenarios lie between these two extreme cases. For any fixed time since the onset of star formation, the scenario track produces the bluest colors, because the fraction of massive blue stars for this track decreases at a slower rate than the corresponding fraction for the scenario track. In the domains of the diagram where the and tracks run sufficiently close to each other (see Fig. 1), the time elapsed since the onset of star formation and, correspondingly, the ages of the oldest stars are about five times greater for the track than the corresponding quantities for the tracks. As a result, in the cases of uncertain estimates, the tracks yield robust upper limits for the estimated ages of the oldest stars, which therefore can be used as the upper estimates for the ages of the visible extended old population. We show all our inferred colors of the outer regions of the program galaxies in the and two-color diagrams, where we compare these colors with the model tracks described above (Figs. 1 and 2).
When comparing the observed colors of the galaxies with those of model tracks, we choose the stellar metallicity for the computed tracks from a discrete set of values offered by PEGASE2 adopting the one that is the closest to the measured gas metallicity for a particular galaxy. In most cases we use one of the following three metallicity values: , , or .
The filter transmission curves used to compute the PEGASE2 evolutionary tracks slightly differ from the transmission curves of the filters used in actual SDSS observations. We use the formulas from Tucker et al. Tucker06 to eliminate the resulting small biases.
3.2 Gas Mass Fraction
The total hydrogen mass for the galaxies of our sample with measured integrated 21-cm HI line fluxes can be estimated using the formula for the optically thin layer: Roberts69 , where and are the distance to the galaxy in Mpc and flux in Jy km s-1 respectively. One must also take into account the helium contribution ( of ) to estimate the total gas mass . The contribution of the mass of molecular gas in dwarf galaxies can be neglected in the first approximation. For about half of the galaxies, we adopt the data from the literature and determine the corresponding fluxes for the remaining galaxies from observations performed with the NRT radio telescope.
The photometry obtained as a result of this study can be used to estimate the total stellar masses. Given the gas mass and that of the stars, an evolutionary parameter—the gas mass fraction—can be determined. The total stellar mass is commonly estimated from the integrated photometry of a galaxy in one of the broadband filters using the corresponding parameter —the mass-to-luminosity ratio for the stellar population, which depends on the color of the stellar continuum. We use for our estimates of the mass-to-luminosity ratio and its dependence on the color indices as derived by Zibetti et al. Zibetti09 . More precisely, we use the ratio and -band luminosity, because this combination yields the most robust results in the optical part of the spectrum. In our opinion, the mass-to-luminosity ratio from Zibetti09 takes most adequately into account the complex history of star formation in low-mass galaxies including the recent episodes.
We use this stellar mass estimate to compute the baryonic mass of the galaxy and then the gas mass fraction , i.e., the ratio of the total gas mass to the total baryonic mass. To compare our results with those obtained for other samples, we also compute the model-independent parameter which is the ratio of the hydrogen mass to -band luminosity in solar units; this parameter is often used in less detailed studies. Here is determined from the magnitude computed using Lupton’s formulas Lupton05 from our independent and -band photometry. This parameter provides a coarse estimate of the gas mass fraction for galaxies with no color information available.
4 RESULTS
Table 1 lists the basic parameters for our sample of 85
galaxies of the Lynx-Cancer void. The columns in the table give:
(1) the name of the galaxy; (2) the name of the object in the
short IAU format; (3) type of the galaxy either adopted
from PaperI (for the objects from the
original
sample), or NED,111NASA/IPAC Extragalactic Database,
http://ned.ipac.caltech.edu or, if such information is
unavailable in NED, according to our own estimate;
(4) heliocentric radial velocity in km s-1;
(5) distance to the object in Mpc (estimated as
in PaperI , i.e., corrected for the large
negative peculiar velocity in the region considered); (6) Galactic
-band extinction adopted
from SF11 ; (7, 8) the total apparent
(uncorrected for Galactic extinction) magnitudes and
the absolute (extinction-corrected) magnitudes derived
from our independent photometry by Lupton’s
formulas Lupton05 and used in the
subsequent statistical analysis; (9) total apparent
magnitudes adopted from NED (for comparison with our magnitude
estimates); (10) hydrogen mass in the units of
(according to the published data and the results
of observations made with the NRT radio telescope); (11) hydrogen
mass to -band luminosity ratio in solar
units; (12) stellar mass in the units of
; (13) gas mass fraction ;
(14) oxygen abundance ; (15) the observed
axial ratio .
Model-independent parameters derived from photometry and SDSS image analysis are given in Tab. 2 and 3. In columns of Tab. 2 the following parameters are presented: (2),(3) the radii containing 50% and 90% of the -band flux of the galaxy; (4) effective -band surface brightness determined as the average surface brightness inside the radius; (5),(6) -band ‘‘optical’’ radius (at the isophote level) in arcsec () and kpc (); (7) -band magnitude inside the ‘‘optical’’ radius; (8),(9) radius at the isophote level
5mm \onelinecaptionsfalse\captionstylenormal \captionstylenormal
(the Holmberg radius) holmberg and the -band magnitude inside this radius; (10),(11) optical size computed as and in arcsec and kpc respectively. In columns of Tab. 3 the following parameters are oresented: (2) integrated -band magnitude; (3),(4),(5) Galactic extinction-corrected integrated colors , , ; (6),(7),(8) the colors of outer parts , , .
Fitting the photometric profiles to an exponential
disk or, in a more general case, to Serscic’s
law Sersic yields the model parameters that
are also listed in Table 4: (2),(3) the central and -band
surface
brightness; (4),(5) the central -band surface brightness values (computed
by Lupton’s formulas Lupton05 ) uncorrected
and corrected for Galactic extinction and inclination to the line
of sight; (6) the scale length in arcsec; (7) the Sersic index.
5mm \onelinecaptionsfalse\captionstylenormal
5 ANALYSIS AND DISCUSSION
5.1 Parameter Distributions
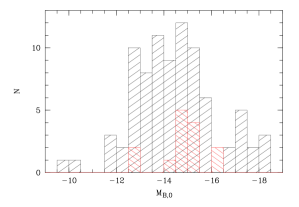
We construct the observed distributions of the most important quantities for the sample studied to understand the full range of their variation. Figure 3 (the sparse hatching) shows the distribution of absolute magnitudes for the void objects computed from our photometry and corrected for Galactic extinction. For comparison, we show the distribution of for the subsample of the so-called ‘‘inchoate’’ galaxies from the ES survey Garcia09 (red hatching in the same figure).
5mm \onelinecaptionsfalse\captionstylenormal
5mm \onelinecaptionsfalse\captionstylenormal
Garcia-Appadoo et al. Garcia09 selected these 14 galaxies from the full list of 195 Equatorial-Survey objects on the basis of their peculiar properties - blue colors and high ratios. The above authors overestimate the 21-cm line fluxes for some of these objects which leads to overestimated ratios. We have corrected these values by taking into account the new published data, and the recomputed ratios are no longer so outstanding. In particular, the ratio for the NE component of the H I 1225+01 (HIPEQ 1227+01) pair is now equal to instead of the original estimate of . In addition, to better understand the nature of the galaxies in this subsample, we searched their neighborhoods for the presence of massive galaxies. Of the 14 ‘‘inchoate’’ galaxies nine are separated by at least 1 Mpc from the closest massive galaxy, and for the six most gas-rich objects the distances to the closest massive galaxies lie in the range of 2–5 Mpc. Thus, the galaxies of this subsample, like our void galaxies, show evident signs of isolation.
5mm \onelinecaptionsfalse\captionstylenormal
5mm \onelinecaptionsfalse\captionstylenormal
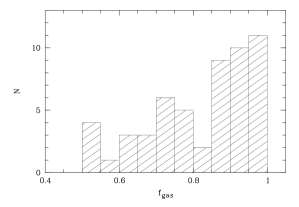
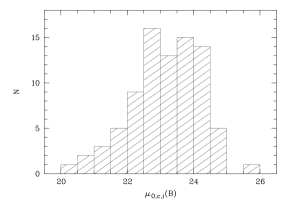
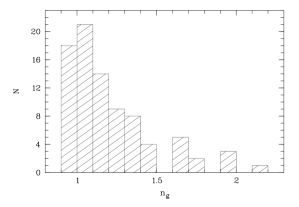
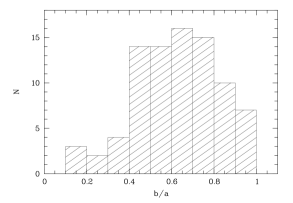
Figure 4 shows the distribution of the -band central surface brightness (corrected for Galactic extinction and inclination to the line of sight) for the studied subsample of the Lynx-Cancervoid galaxies. The fraction of galaxies with (LSB) in this subsample is equal to about 50%. Figure 6 shows the distribution of the Sersic index determined by modeling the radial -band brightness profile. The index is sufficiently close to for almost two thirds of the objects, i.e., they have close-to-exponential brightness profiles. The brightness profiles of the remaining galaxies with the indices in the range of 1.2 to 2.1 flatten out appreciably towards the center. The distribution of the observed axial ratios in Fig. 6 shows that about 50% of the sample objects are tilted significantly to the line of sight ( and, correspondingly, ). As we showed in our previous paper PaperI , because of the selectivity of the SDSS spectroscopic survey with respect to surface brightness many LSB galaxies in the void that are brighter than the formal SDSS cutoff threshold Petro could lack velocity measurements. Because of the tilt to the line of sight, their apparent brightness is overestimated, making it more likely for them to be included in the spectroscopic part of the SDSS survey.
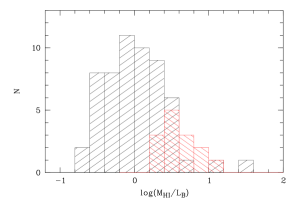
Figure 8 (the sparse hatching) shows the distribution of the hydrogen mass to luminosity ratio . The median value for 57 galaxies of our sample is . Here, like in Fig. 3, we show the corresponding distribution for the ‘‘inchoate’’ galaxies from Garcia09 (the red hatching). The median ratio for this sample is equal to about . Garcia-Appadoo et al. Garcia09 associate the term ‘‘inchoate’’ with the irregular shapes of these galaxies: the above authors assume that these systems are in the process of formation or at the beginning of their evolution. We show below that some of the galaxies in our sample also have peculiar properties and resemble ‘‘inchoate’’ objects from the ES sample (see Table 1). Furthermore, they are unusually blue () and the median value of their parameter is comparable with the corresponding parameter for the subsample of Garcia-Appadoo et al. Garcia09 .
Figure 8 shows the distribution of the gas mass fraction . The gas mass fraction for 59% of the void galaxies with available H I data lies in the range of 80–99%. Such a high concentration of gas-rich objects in our sample indicates, as we already pointed out in our earlier paper PaperII , that the void population evolves more slowly than the galaxies in denser environments.
5mm \onelinecaptionsfalse\captionstylenormal
5.2 Relations Between the Parameters
of Void Galaxies
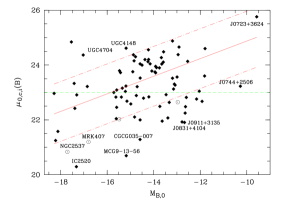
In Fig. 9 we compare the absolute magnitude and the central surface brightness for the sample of 85 galaxies of the Lynx-Cancer void. Both parameters are corrected for Galactic extinction. The central surface brightness values are corrected for the galaxies’ inclination to the line of sight. We estimate the central surface brightness values for galaxies with a substantial contribution from the central star-forming region and for galaxies with a ‘‘bulge’’ by extrapolating to the center of the underlying external disk profile. About half of the galaxies are classified as LSB, i.e., their corrected surface brightness is (lies above the green dashed line). Linear regression (the red solid line) is based on all the galaxies of the subsample except for four blue compact galaxies (BCG) with ongoing star formation. The standard deviation of individual galaxies from the general trend is rather large: (the red dash-dotted lines). The open circles show the positions of the four BCGs. These rare low-mass galaxies have a higher central surface brightness and differ appreciably from the more typical late-type dwarf galaxies.
5mm \onelinecaptionsfalse\captionstylenormal
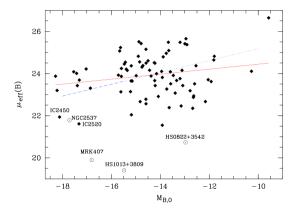
Figure 10 shows the relationship between the absolute magnitude and the effective surface brightness . Both parameters are corrected for Galactic extinction. The red solid line shows the linear regression based on 81 void galaxies except for the four BCGs (its slope is equal to ). The trend cannot be inferred reliably because of the large scatter of data points in the central part of the range. A similar line (shown by the blue dashes) based on the data for an extensive sample of galaxies (about 45 000 objects) from Cross and Driver cross02 and extrapolated into the domain of low luminosities (the blue dotted line) runs close to the center of the distribution for void galaxies but has a significantly higher slope (). This difference must be due to the higher dwarf fraction in the sample of void galaxies and greater diversity of their properties. Furthermore, the scatter around the regression line for the sample of Cross and Driver cross02 is smaller than for void galaxies: and respectively.
Figure 11 shows the relation between the effective surface brightness and luminosity similar to the relation shown in the previous figure. Like in the previous figure, linear regression (the red solid line) is based on all galaxies except for the four BCGs. To compare our relations with similar relations based on the sample of 195 galaxies of the equatorial survey (ES) Garcia09 selected by the 21-cm line emission recorded in the blind HIPASS H I survey, we show the linear regression for this sample in Fig. 11 by the blue dashed line. We extend this line to the domain of low luminosities, where we show it as a blue dotted line for display purposes. The open triangles indicate the 14 objects from the subsample of the so-called ‘‘inchoate’’ galaxies of Garcia-Appadoo et al. Garcia09 , which have blue colors and higher-than-usual hydrogen mass-to-luminosity ratios ( and ).
5mm \onelinecaptionsfalse\captionstylenormal
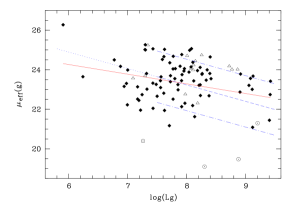
The slope of our regression for void galaxies () is about 2.5 times lower than the corresponding slope for the ES-sample (). Note that the sample of Garcia-Appadoo et al. Garcia09 contains no objects with . The slope of the regression based on the ES sample is rather close to the slope for the sample from cross02 —namely, if considering the correlation with the luminosity instead of the absolute magnitude. The scatter of the parameter for void galaxies is, like the corresponding scatter for the sample of the ES survey, quite significant, reaching 3 or more magnitudes at a given luminosity.
5mm \onelinecaptionsfalse\captionstylenormal
The galaxies at the extremes of the range make the decrease of the surface brightness with decreasing luminosity in Figs. 10 and 11 more or less apparent. However, the rather large scatter of for the void galaxies at the center of the luminosity range indicates that voids are characterized not only by the general trend for the increase of the fraction of LSB galaxies but also by the presence of galaxies with a sufficiently high surface brightness which must be due to the enhanced star formation in the last several billion years. The large difference between the slopes of the regression for the galaxies of the Lynx-Cancer void and the ES sample may be due to the fact that the latter contains a substantial fraction of massive galaxies with enhanced light concentration at the center—a bulge or traces of a recent burst of star formation. This results in a shift of the average effective surface brightness at high luminosities in the ES sample and a larger regression slope.
5mm \onelinecaptionsfalse\captionstylenormal
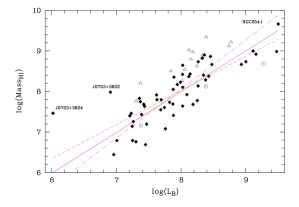
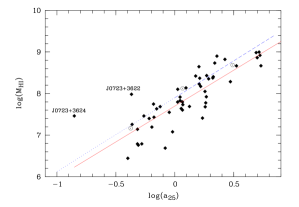
Figure 12 shows the relation between the optical radius (kpc) and hydrogen mass of the galaxy (in solar units). In addition to the linear regression based on 85 galaxies of our sample (the red solid line, ), we also show a similar relation from Garcia09 (the blue dashed line). They can be seen to agree well with each other over the common range of optical radii. Our data allow this relation to be extended to the domain of objects with kpc. The regression slope, which is close to , reflects the simple physical fact that in the studied galaxies hydrogen is distributed throughout a rather flat disk and the characteristic radius of the H I disk closely correlates with that of the optical disk over a broad range of effective sizes. At the same time, the two objects (J0723+3624 and J0723+3622) with the highest hydrogen mass to -band luminosity ratios deviate strongly from the main trend.
Figure 13 shows the relation between the hydrogen mass and -band luminosity (in solar units) for 54 void galaxies with known H I masses. The red dashed line shows the linear regression based on the galaxies of our sample (diamonds, ). The open triangles show the ‘‘inchoate’’ galaxies from Garcia09 for comparison. The blue dotted line, where , separates the galaxies with a high gas fraction from the more typical galaxies with normal gas content. We use the same data to determine the dependence of the parameter on , whose regression slope is equal to . This slope is, within the rather large quoted errors, close to the slope of a similar dependence found by Pustilnik et al. Pustilnik02 for BCGs in the Local Supercluster and in the voids.
A closer look at the figure discussed here suggests that the increase of with decreasing is due mostly to the galaxies at the extremes of the range, including the two most gas-rich galaxies of the J0723+36 triplet. We also show other regression versions in the plot. The second regression is computed without the triplet members mentioned above: it is shown by the red solid line with the slope of (52 objects). The third regression is based on the galaxies within the narrow luminosity range of – and shown by the red dash-dotted line with a slope of (45 objects). A comparison of the slope difference with its ‘‘combined error’’ indicates that the slopes differ at the level of –: , . We can thus conclude that the nature of the relation between the two global parameters of low-mass void galaxies over a wide luminosity range is so far not entirely clear. Extensive samples are needed, especially for the domain. Extending the analysis to other galaxies of this void and to low-mass galaxies from other nearby voids will increase the total number of galaxies involved by a factor of 2–3 and provide a better understanding of the discussed relation.
5mm \onelinecaptionsfalse\captionstylenormal
5mm \onelinecaptionsfalse\captionstylenormal
5mm \onelinecaptionsfalse\captionstylenormal
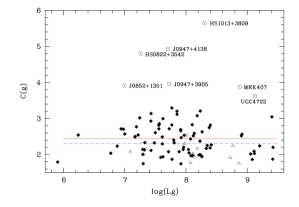
As is evident from Fig. 14, the -band concentration index (where and are the radii containing 90% and half of the -band flux of the galaxy) does not depend on luminosity . The mean concentration index averaged over the galaxies of our sample is (the red solid line) which is close to the value for purely exponential disks. When computing our mean value, we excluded, like in the above cases, the BCGs, very compact objects (J0947+4138, J0947+3905, and J0852+1351), and the perturbed disk galaxy UGC 4722 with a tidal tale and an intense burst of star formation (all these objects are shown by open circles). We also show the mean concentration for the galaxies from Garcia-Appadoo et al. Garcia09 (the blue dashed line) and the positions of their ‘‘inchoate’’ galaxies (the open triangles).
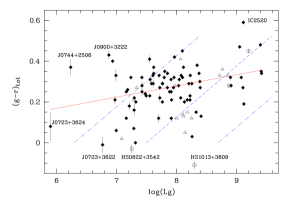
Figure 15 shows the relationship between the -band luminosity logarithm and the integrated color for void galaxies. The red solid line shows the linear regression for this sample (). For comparison, we show by the blue dashed line the linear regression for the galaxies of the ES survey () and the positions of the ‘‘inchoate’’ galaxies from Garcia09 (the open triangles). Whereas the galaxies of the ES sample exhibit a strong trend, the colors (like the parameter in Fig. 11) on the average vary only slightly with decreasing luminosity: from to about , albeit with a large scatter. To understand the nature of this scatter better, galaxies with extreme parameters should be studied in more detail.
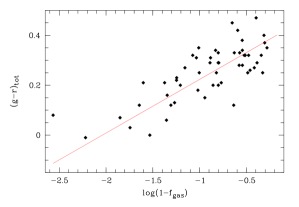
Figure 16 shows the relationship between the stellar mass fraction () and integrated color . The red solid line shows the linear regression between these parameters (). As expected, in this case the relation shows up more conspicuously than in the previous figure, because the coefficient used to estimate the stellar mass from luminosity depends on the color (which correlates with )—see Section 3.2. The bluer the color, the smaller the stellar mass, and, for a fixed gas mass, the smaller the stellar mass fraction.
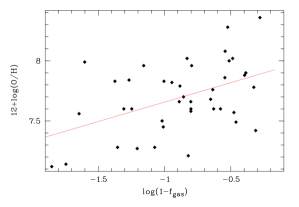
Figure 17 shows the relationship between the stellar mass fraction () and the oxygen abundance in the interstellar medium (similar to metallicity), , for the void galaxies for which this parameter has been measured. Like in the previous figures, the red solid line shows the linear regression (). The apparent trend of the decrease of metallicity with decreasing stellar mass fraction is consistent with what is to be expected in the so-called ‘‘closed box’’ model of galaxy evolution (i.e., evolution without exchange with the surrounding medium). However, the scatter of the parameter is so large that the ‘‘closed box’’ approximation is often invalid in void galaxies, including LSBD galaxies.
5mm \onelinecaptionsfalse\captionstylenormal
5.3 Two-Color Diagrams and Age Estimates
0mm \onelinecaptionstrue\captionstylenormal Table 5. Parameters of peculiar galaxies in the void Parameter J0723+3622 J0723+3624 J0737+47 J0812+48 J0926+33 J0929+25 S 0822+3545 U 3966 , Gyr 12 22.5 23 46 33.5 35 13 2.53 0.997 0.997 0.96 0.94 0.99 0.95 0.97 0.98 12+ 7.28 7.27 7.12 7.2: 7.56 11.79 9.57 12.54 13.08 12.91 12.95 13.11 14.58
In Figs. 1 and 2 we compare the colors of the outer regions of 81 void galaxies with PEGASE2 models for two extreme cases of the star-formation (SF) law: instantaneous () SF and continuous () SF with a constant rate. We adopt two initial stellar mass functions (IMF): the standard Salpeter IMF and the IMF of Kroupa. For the sake of illustration we show the tracks for the metallicity of , which lies approximately in the middle of the range of known metallicities of void galaxies. The contribution of nebular emission may be significant for the four BCGs in our sample. We excluded these objects from further analysis because the estimates of their stellar population colors are uncertain.
The colors of the outer regions of 77 of the 81 void galaxies studied here agree rather well with the PEGASE2 evolutionary tracks for the case of continuous star formation. The time elapsed since the onset of the star-formation (or in other terms, the age of a galaxy) spans a wide range, approximately from 1 to 14 Gyr. Most of these galaxies better fit the tracks computed with the Kroupa IMF. The colors of the outer parts of the majority of the objects correspond to typical galactic ages: – Gyr. However, the colors of the outer regions of seven objects correspond to the times as small as about – Gyr. The colors of six other galaxies correspond to intermediate times – Gyr. We discuss these galaxies and their peculiarities in more detail in the next section.
Only for four galaxies—J0744+2506, IC 2450, J0928+2845, and CGCG 035-007—their rather red (–) colors, unlike those of the remaining 77 galaxies, can be interpreted as a result of a rather short (‘‘instantaneous’’) and very old (about 10 Gyr) star formation episode, typical of elliptical galaxies. However, their morphology is inconsistent with such a hypothesis. The presence of emission regions either near the center, like in J0744+2506 and IC 2450, or shifted towards the edge, like in J0928+284 and CGCG 035-007, is indicative of recent star formation caused either by external perturbation or by the infall of fresh gas. These galaxies deserve a more thorough investigation as objects whose outer regions have colors atypical of the sample studied. In particular, it is important to understand what fraction of the fainter of such objects remains undiscovered because of observational selection if the star formation in them has not been triggered by any external factors over the past several tens of Myr.
5.4 Peculiar Galaxies of the Void
The peculiar properties of some galaxies with non-cosmological times elapsed since the onset of the main star formation episode (SAO 0822+3542, UGC 5340 DDO 68, J0926+3343, J0723+3622, J0723+3624, and J0737+4724) were already pointed out in the papers dedicated to the individual galaxies of this void Pustilnik03 ; DDO68 ; DDO68_sdss ; J0926 ; PaperIII ; Triplet .
Here we give for these galaxies an independent corroboration of the blue colors of their peripheral regions which corresponds to short times elapsed since the onset of continuous star formation: 3.5 Gyr. For two other galaxies—UGC 3966, UGC 4117—such data have been obtained for the first time. The colors of the outer regions of UGC 3672, UGC 3860, J0812+4836, J0929+2502, UGC 5272 and its companionUGC 5272b also correspond to non-cosmological times in the – Gyr.
Table 5 summarizes the evolutionary parameters for eight galaxies which can be classified as unevolved based on the combination of their properties. Their gas mass fractions are equal to 94–99.7%, and their metallicities are 2-5 times lower than those of typical irregular dwarf galaxies of the same luminosity but residing in environments with intermediate or high density of galaxies (see Pustilnik03 ; SBS0335BTA ; DDO68 ; DDO68_sdss ; J0926 ), whereas the colors of the visible old stellar population in these objects correspond to the epoch of the onset of star formation – Gyr. We place the object J0723+3624 with in the same group of galaxies. The UGC 4117 galaxy has blue peripheral colors corresponding to Gyr but does not fit into the list of peculiar galaxies of the void because its metallicity does not differ very much from that expected for its luminosity (). The same is true for the galaxies UGC 3672, UGC 3860, UGC 5272, and UGC 5272b with peripheral ages ranging from to Gyr. New Hubble Space Telescope data for UGC 5340 (DDO 68) Tikhonov14 confirm the suggestions of Pustilnik et al. DDO68 and Ekta et al. ekta08 that this galaxy is made up of two merging components with very different properties and that this fact should be taken into account when associating the object with the group of peculiar galaxies. The more massive central component with has an old stellar population with the metallicity five times lower than solar and hence is a rather typical late-type galaxy. The stars in the much less massive component (UGC 5340b), extending along the eastern edge of the more massive component, have metallicities no greater than which is consistent with the gas metallicity estimated for the H II regions of the galaxy. The ages of most or all of its stars do not exceed Gyr. However, thus far the mass or luminosity of the less massive component cannot be estimated.
A closer analysis of the properties of the most peculiar galaxies mentioned above suggests that their fraction is much higher among less luminous galaxies. However, this may be an accidental result due to the statistically small number of bright void galaxies. The hypothesis about a relation between the luminosity and the fraction of unevolved galaxies in the void can be tested using the statistical criterion ‘‘22 contingency table’’ Bolshev83 ), which is widely used in biology and applied studies. A detailed description of this criterion can be found in the paper by Pustilnik et al. Pustilnik95 , who used it for astronomical applications.
The idea of the method consists of analyzing the numbers in a 22 contingency table, which correspond to different combinations of two properties of the elements of the sample. In our case we adopt the property of being a low-luminosity galaxy with , where is the threshold value based on certain considerations. Thus, the property breaks the sample into the and non- subsamples. Similarly, the second property is that of being an unevolved galaxy according to the above criteria. Correspondingly, non- means that the object is a galaxy with a more standard visible stellar population. To test the zero hypothesis that the two properties in the sample considered are independent of each other, we must compose a 22 table in the following form:
Property non- Total non- Total
Here , , , and are the numbers of galaxies in the sample having the property combinations (, ), (non-, ), (, non-), and (non-, non-) respectively. As is shown in the book Bolshev83 (pp. 77-78), if the properties and are independent of each other, the probability of obtaining the contingency table with such numbers is described by a hypergeometric distribution, which at can be well approximated by the so-called incomplete beta function , where the parameters , , and can be expressed in terms of the numbers in the 22 contingency table by the formulas (27)-(30) on p. 74 of the book Bolshev83 (see also Appendix to Pustilnik95 ).
If there is no real correlation in the sample of void galaxies between the properties of low luminosity and ‘‘small’’ age, then in the case of the observed distribution of absolute magnitudes and whatever threshold is adopted, the numbers in the contingency table should correspond to a relatively low probability of rejecting the null hypothesis.
To account more fully for all the available information on the unevolved galaxies of the Lynx-Cancer void sample, we considered the object J0723+3624 with the absolute magnitude to be an unevolved object when analyzing the 22 contingency table. Despite the failure to measure the peripheral colors of this very small galaxy, which is a member of the unusual triplet in the central part of the void, the record high gas mass fraction of this object (0.997) and its blue integrated color result in age estimates of less than – Gyr in any reasonable evolutionary scenario (Fig. 7 in Triplet ). In view of the above, the 22 contingency table for is:
Property non- Total 6 12 18 non- 2 65 67 Total 8 77 85
The probability of the table with these values computed by the appropriate formulas for the incomplete beta function yields a statistically significant result: the probability of rejecting the null hypothesis is . This result should be interpreted as the existence of a significant statistical relation between the two properties in the sense that the fraction of unevolved galaxies is significantly higher in the group with the absolute magnitudes fainter than (a simple comparison of the fractions 6/18 and 2/67 indicates a difference of more than one order of magnitude). For this computation we included the unevolved component UGC 5340b in the sample, assuming that its is brighter than . Otherwise the significance level would be even higher.
The discovery of such a relation has two important implications. The first one is associated with the understanding of the physics of the processes resulting in unevolved galaxies appearing only among sufficiently low-mass objects. The second implication is a methodological one. The correlation found indicates that to search effectively for such objects in the voids, one must study galaxies with absolute magnitudes fainter than or near the ‘‘threshold.’’
Let us return to the situation with the blue colors of the peripheral regions of some galaxies, where the parameter is only slightly lower than expected for their luminosity (UGC 3672, 3860, 4117, 5272, and 5272b). These objects do not resemble unevolved galaxies, but their unusual colors require further discussion. They can be explained by a relatively recent perturbation (on a time scale of 2–6 Gyr) which resulted in an increased rate of star formation, the traces of which are now also visible in their outer regions. The optical morphology of the UGC 3672, UGC 3860, and UGC 4117 galaxies and that of the pair UGC 5272/5272b is indeed indicative of a significant perturbation and/or ongoing interaction. Further H I mapping of these objects should provide more compelling evidence for their perturbed state.
6 CONCLUSIONS
To summarize our study of void galaxies including their statistical analysis and a comparison with other data and samples, we formulate the following results and conclusions.
-
(1) We determined the photometric parameters in the bands (integrated magnitudes and colors, effective radii and the corresponding surface brightness values, the optical and Holmberg radii) for 85 galaxies of the Lynx-Cancer void based on their images adopted from the SDSS database. We analyzed the radial surface brightness profiles to determine the central surface brightness levels and scale lengths of the model disks.
-
(2) We compared the color indices of the outer regions of the galaxies outside the regions of recent star formation with the PEGASE2 evolutionary tracks and estimated the time elapsed since the onset of the star-formation. For about 85% of the galaxies, these time scales lie in the range of – Gyr, which is typical of galaxies in denser environments. The colors of 13 galaxies imply much smaller . The corresponding times for seven galaxies lie in the range of – Gyr, and those of the six remaining galaxies range approximately from to Gyr.
-
(3) Most of the galaxies with unusual colors of outer regions have very low gas metallicities ( which are 2-5 times lower than expected for their luminosity) and the highest values of the empirical gas content parameter (HI). We estimated the stellar masses of the galaxies of this group and found their gas mass fractions to be in the range of 94-99% which is the highest value of this parameter ever determined. By their properties these galaxies are unevolved.
-
(4) A comparison of the statistical relations between the observed properties of the galaxies in the Lynx-Cancer void and galaxies from the Equatorial Survey (ES) initially selected by their H I line emission shows the similarity of the two samples throughout the common luminosity range. However, void galaxies contain a significant fraction of objects that do not follow the common trends and relations. A small group of the so-called ‘‘inchoate’’ galaxies in the ES survey exhibits unusual properties. More detailed studies will probably show what part of them are analogs of unusual galaxies in the voids.
-
(5) The group of unevolved galaxies accounts for about 15% of all the low surface brightness dwarf galaxies in the void and is represented substantially more often among low luminosity galaxies (), where their fraction amounts to about 30%. This fact confirms that the environment has a stronger effect on less massive galaxies and provides a clue to an efficient search for such unusual galaxies.
Acknowledgements.
We are grateful to D. I. Makarov for his numerous useful critical comments and suggestions, which helped improve the paper substantially. Yu. A. Perepelitsyna and S. A. Pustilnik acknowledge the support of the Russian Foundation for Basic Research (grants No. 11-02-00261, 13-02-90407, and13-02-90734) and partial support of the Federal target programme Research and PedagogicalCadre for Innovative Russia (proposalNo. 2012-1.5-12-000-1011-004, agreement number 8523). A. Yu. Kniazev acknowledges the support of the National Research Foundation (NRF) of South Africa. We are grateful to the SDSS consortium for the spectroscopic, photometric, and auxiliary information on the studied galaxies available from the SDSS database DR7 .References
- (1) M. Jöeveer, J. Einasto, and E. Tago, Monthly Notices Roy. Astronom. Soc. 185, 357 (1978).
- (2) R. P. Kirshner, A. Oemler Jr., P. L. Schechter, and S. A. Shectman, Astrophys. J. 248, L57 (1981).
- (3) A. D. Montero-Dorta and F. Prada, Monthly Notices Roy. Astronom. Soc. 399, 1106 (2009).
- (4) V. de Lapparent, in Proc. Les Houches Summer School, Session LX, Cosmology and Large Scale Structure, Ed. by R. Schaeffer, J. Silk, M. Spiro, and J. Zinn-Justin (Elsevier Sci. Publ. Co., Amsterdam, 1996), p. 107.
- (5) P. J. E. Peebles, Astrophys. J. 557, 459 (2001).
- (6) A. V. Tikhonov and A. A. Klypin, Monthly Notices Roy. Astronom. Soc. 395, 1915 (2009).
- (7) R. R. Rojas, M. S. Vogeley, F. Hoyle, and J. Brinkmann, Astrophys. J. 617, 50 (2004).
- (8) R. R. Rojas, M. S. Vogeley, F. Hoyle, and J. Brinkmann, Astrophys. J. 624, 571 (2005).
- (9) S. G. Patiri, F. Prada, J. Holtzman, et al., Monthly Notices Roy. Astronom. Soc. 372, 1710 (2006).
- (10) F. Hoyle, M. S. Vogeley, and D. Pan, Monthly Notices Roy. Astronom. Soc. 426, 3041 (2012).
- (11) K. Kreckel, M. R. Joung, and R. Cen, Astrophys. J. 735, 132 (2011).
-
(12)
J. E. Einasto,
Colloquim on Cosmic Voids,
http://www.astro.rug.nl/weygaert/
/knawvoid.program.php - (13) N. Cross and S. P. Driver, Monthly Notices Roy. Astronom. Soc. 329, 579 (2002).
- (14) J. C. Mihos, S. S. McGaugh, and W. J. G. de Block, Astrophys. J. 477, L79 (1997).
- (15) S. A. Pustilnik and A. L. Tepliakova, Monthly Notices Roy. Astronom. Soc. 415, 1188 (2011).
- (16) S. A. Pustilnik, A. L. Tepliakova, and A. Y. Kniazev, Astrophysical Bulletin 66, 255 (2011).
- (17) S. A. Pustilnik, J.-M. Martin, A. L. Tepliakova, and A. Y. Kniazev, Monthly Notices Roy. Astronom. Soc. 417, 1335 (2011).
- (18) J. N. Chengalur and S. A. Pustilnik, Monthly Notices Roy. Astronom. Soc. 428, 1579 (2013).
- (19) K. Kreckel, E. Platen, M. A. Aragon-Calvo, et al., Astronom. J. 144, 16 (2012).
- (20) K. N. Abazajian, J. K. Adelman-McCarthy, M. A.Agüeros, et al., Astrophys. J. Suppl. 182, 543 (2009).
-
(21)
M. Fioc, B. Rocca-Volmerange,
arXiv:astro-ph/9912179 (1999). - (22) D. A. Garcia-Appadoo, A. A. West, J. J. Dalcanton, et al., Monthly Notices Roy. Astronom. Soc. 394, 340 (2009).
- (23) M. J. Meyer, M. A. Zwaan, R. L. Webster, et al., Monthly Notices Roy. Astronom. Soc. 350, 1195 (2004).
- (24) M. P. Haynes, R. Giovanelli, A. M. Martin, et al., Astrophys. J. 142, 170 (2011).
- (25) D. G. York, J. Adelman, J. E. Anderson, et al., Astronom. J. 120, 1579 (2000).
- (26) A. Y. Kniazev, E. K. Grebel, S. A. Pustilnik, et al., Astronom. J. 127, 704 (2004).
-
(27)
R. Lupton,
http://www.sdss.org/dr7/
/algorithms/sdssUBVRITransform.html#
#Lupton2005 - (28) E. Holmberg, Lund Medd. Astron. Obs. Ser. 136, 1 (1958).
- (29) J. L. Sersic, Boletin de la Asociacion Argentina de Astronomia 6, 99 (1963).
- (30) E. F. Schlafly and D. P. Finkbeiner, Astrophys. J. 737, 103 (2011).
- (31) L. D. Matthews, J. S. Gallagher, W. van Driel, Astronom. J. 118, 2751 (1999).
- (32) P. C. van der Kruit and L. Searle, Astronom. and Astrophys. 95, 105 (1981).
- (33) S. Roychowdhury, J. N. Chengalur, I. D. Karachentsev, and E. I. Kaisina, Monthly Notices Roy. Astronom. Soc. 436, 104 (2013).
- (34) E. E. Salpeter, Astrophys. J. 121, 161 (1955).
- (35) P. Kroupa, C. A. Tout, and G. Gilmore, Monthly Notices Roy. Astronom. Soc. 262, 545 (1993).
- (36) D. L. Tucker, S. Kent, M. W. Richmond, et al., Astronomische Nachrichten 327, 821 (2006).
- (37) M. S. Roberts, Astronom. J. 74, 859 (1969).
- (38) S. Zibetti, S. Charlot, and H.-W. Rix, Monthly Notices Roy. Astronom. Soc. 400, 1181 (2009).
- (39) V. Petrosian, Astrophys. J. 209, 1 (1976).
- (40) S. A. Pustilnik, J.-M. Martin, W. K. Huchtmeier, et al., Astronom. and Astrophys. 389, 405 (2002).
- (41) S. A. Pustilnik, A. Y. Kniazev, A. G. Pramsky, et al., Astronom. and Astrophys. 409, 917 (2003).
- (42) S. A. Pustilnik, A. Y. Kniazev, and A. G. Pramsky, Astronom. and Astrophys. 443, 91 (2005).
- (43) S. A. Pustilnik, A. L. Tepliakova, and A. Y. Kniazev, Astronomy Letters 34, 457 (2008).
- (44) S. A. Pustilnik, A. L. Tepliakova, A. Y. Kniazev, and A. N. Burenkov, Monthly Notices Roy. Astronom. Soc. 401, 333 (2010).
- (45) S. A. Pustilnik, A. G. Pramskij, and A. Y. Kniazev, Astronom. and Astrophys. 425, 51 (2004).
- (46) N. A. Tikhonov, O. A. Galazutdinova, and V. S. Lebedev, Astronomy Letters 40, 1 (2014).
- (47) Ekta, J. N. Chengalur, and S. A. Pustilnik, Monthly Notices Roy. Astronom. Soc. 391, 881 (2008).
- (48) L. N. Bolshev and N. V. Smirnov, Tables of Mathematical Statistics (Nauka, Moscow, 1983) [in Russian].
- (49) S. A. Pustilnik, A. V. Ugryumov, V. A. Lipovetsky, et al., Astrophys. J. 443, 499 (1995).
0mm \onelinecaptionstrue\captionstyleflushleft
Table 1. Basic parameters of the galaxies in the Lynx?Cancer void.
| Name or | Name in brief | Type | (HI) | (HI)/ | 12+log(O/H) | b/a | |||||||||
| prefix | IAU format | km/s | Mpc | mag | mag | mag | mag | ||||||||
| (1) | (2) | (3) | (4) | (5) | (6) | (7) | (8) | (9) | (10) | (11) | (12) | (13) | (14) | (15) | |
| 1 | HIPASSJ0626+24 | J0626+2439 | Scd | 1473 | 23.04 | 1.79 | 17.98 | -15.62 | 17.60 | – | – | 5.53 | – | – | 0.59 |
| 2 | UGC3600 | J0655+3905 | Im | 412 | 9.30 | 0.29 | 15.92 | -14.22 | 16.18 | 11.23 | 1.48 | 1.91 | 0.89 | 7.66 | 0.27 |
| 3 | UGC3672 | J0706+3019 | Im | 994 | 16.93 | 0.32 | 16.04 | -15.43 | 15.40 | 79.50 | 3.45 | 2.60 | 0.98 | 7.99 | 0.55 |
| 4 | SDSS | J0713+2926 | Im | 950 | 16.26 | 0.31 | 16.66 | -14.71 | 16.79 | – | – | 2.66 | – | – | 0.63 |
| 5 | SDSS | J0723+3621 | Sm | 917 | 16.00 | 0.23 | 17.01 | -14.25 | 17.01 | 22.60 | 2.91 | 2.76 | 0.92 | 7.45 | 0.31 |
| 6 | SDSS | J0723+3622 | dI | 970 | 16.00 | 0.23 | 19.46 | -11.79 | 19.31 | 9.61 | 11.84 | 0.07 | 0.99 | – | 0.71 |
| 7 | SDSS | J0723+3624 | dI | 938 | 16.00 | 0.23 | 21.68 | -9.57 | 21.56 | 2.90 | 27.62 | 0.01 | 0.99 | – | 0.47 |
| 8 | UGC3860 | J0728+4046 | Im | 354 | 7.81 | 0.25 | 15.21 | -14.50 | 14.96 | 16.92 | 1.73 | 2.13 | 0.91 | 7.83 | 0.56 |
| 9 | UGC3876 | J0729+2754 | SAd | 854 | 15.01 | 0.19 | 13.77 | -17.31 | 13.70 | 99.48 | 0.77 | 78.17 | 0.63 | 7.88 | 0.58 |
| 10 | SDSS | J0730+4109 | dI | 874 | 15.70 | 0.27 | 16.67 | -14.58 | 16.67 | 4.36 | 0.41 | 2.36 | 0.71 | 8.02 | 0.59 |
| 11 | SDSS | J0737+4724 | LSB | 476 | 10.42 | 0.47 | 18.02 | -12.54 | 18.06 | 2.51 | 1.56 | 0.11 | 0.97 | 7.28 | 0.47 |
| 12 | UGC3966 | J0741+4006 | Im | 361 | 8.64 | 0.22 | 15.32 | -14.58 | 14.44 | 44.26 | 4.18 | 1.22 | 0.98 | 7.56 | 0.86 |
| 13 | DDO47 | J0741+1648 | IBsm | 272 | 8.04 | 0.14 | 14.89 | -14.78 | 13.62 | – | – | 3.59 | – | – | 0.44 |
| 14 | KK65 | J0742+1633 | dIrr | 279 | 8.01 | 0.14 | 15.51 | -14.15 | 15.34 | – | – | 2.45 | – | – | 0.37 |
| 15 | SDSS | J0744+2508 | Ir | 749 | 12.95 | 0.18 | 18.11 | -12.63 | 18.35 | 1.38 | 0.79 | 0.30 | 0.86 | 7.21 | 0.84 |
| 16 | SDSS | J0744+2506 | Ir | 669 | 12.95 | 0.18 | 20.47 | -10.28 | 20.30 | – | – | 0.07 | – | – | 0.83 |
| 17 | MCG9-13-52 | J0746+5117 | Sm | 445 | 10.10 | 0.27 | 16.54 | -13.75 | 16.78 | 6.25 | 1.27 | 1.32 | 0.86 | 7.66 | 0.74 |
| 18 | MCG9-13-56 | J0747+5111 | Sm | 439 | 10.00 | 0.30 | 15.12 | -15.18 | 15.48 | 13.69 | 0.75 | 2.46 | 0.88 | 7.70 | 0.68 |
| 19 | UGC4115 | J0757+1423 | IAm | 341 | 7.73 | 0.12 | 14.81 | -14.75 | 15.23 | 8.37 | 0.68 | 3.69 | 0.75 | 7.60 | 0.60 |
| 20 | UGC4117 | J0757+3556 | IBm | 773 | 14.12 | 0.20 | 15.36 | -15.59 | 15.34 | 23.73 | 0.89 | 3.57 | 0.90 | 7.82 | 0.75 |
| 21 | UGC4148 | J0800+4211 | Scd | 716 | 13.55 | 0.18 | 15.66 | -15.18 | 15.63 | 54.15 | 2.94 | 2.95 | 0.96 | 7.83 | 0.42 |
| 22 | NGC2500 | J0801+5044 | SBcd | 504 | 10.88 | 0.17 | 12.14 | -18.21 | 12.23 | 96.60 | 0.32 | 126.82 | 0.50 | 8.36 | 1.00 |
| 23 | MCG7-17-19 | J0809+4135 | Sc | 704 | 13.37 | 0.22 | 15.46 | -15.39 | 16.65 | 25.31 | 1.14 | 5.74 | 0.85 | 7.96 | 0.60 |
| 24 | SDSS | J0810+1837 | Sm | 1483 | 23.05 | 0.16 | 18.39 | -13.59 | 18.29 | 6.27 | 1.48 | 1.15 | 0.88 | 7.79 | 0.46 |
| 25 | SDSS | J0812+4836 | dIr | 521 | 11.05 | 0.22 | 17.36 | -13.08 | 17.23 | 4.85 | 1.83 | 0.37 | 0.95 | 7.27 | 0.52 |
| 26 | NGC2537 | J0813+4559 | BCG | 445 | 9.86 | 0.23 | 12.49 | -17.71 | 12.27 | 48.44 | 0.26 | 120.20 | 0.35 | 8.37 | 0.94 |
| 27 | IC2233 | J0813+4544 | Sd | 553 | 10.70 | 0.22 | 13.34 | -17.03 | 13.05 | 54.30 | 0.54 | 25.25 | 0.74 | 8.08 | 0.11 |
| 28 | NGC2541 | J0814+4903 | SABc | 548 | 12.00 | 0.22 | 12.34 | -18.28 | 12.25 | 460.82 | 1.45 | 95.03 | 0.87 | 8.02 | 0.60 |
| 29 | NGC2552 | J0819+5000 | SAm | 524 | 11.11 | 0.20 | 13.01 | -17.42 | 12.92 | 83.01 | 0.58 | 41.66 | 0.73 | 8.28 | 0.68 |
| 30 | KUG0821+321 | J0825+3201 | Ir | 648 | 12.25 | 0.20 | 16.91 | -13.73 | 16.10 | 3.54 | 0.73 | 1.27 | 0.79 | 7.60 | 0.67 |
| 31 | HS0822+3542 | J0825+3532 | BCG | 720 | 13.49 | 0.20 | 17.88 | -12.97 | 17.92 | 1.46 | 0.61 | 0.04 | 0.98 | 7.44 | 0.78 |
| 32 | SAO0822+3545 | J0826+3535 | Im | 740 | 13.49 | 0.20 | 17.74 | -13.11 | 17.56 | 4.30 | 1.57 | 0.16 | 0.97 | – | 0.80 |
| 33 | UGC4426 | J0828+4151 | Im | 397 | 10.30 | 0.16 | 15.35 | -14.87 | 15.13 | 27.05 | 1.96 | 6.18 | 0.85 | 7.58 | 0.63 |
0mm \onelinecaptionstrue\captionstyleflushleft
Table 1. Basic parameters of the galaxies in the Lynx?Cancer void. (Condt.)
| Name or | Name in brief | Type | (HI) | (HI)/ | 12+log(O/H) | b/a | |||||||||
| prefix | IAU format | km/s | Mpc | mag | mag | mag | mag | ||||||||
| (1) | (2) | (3) | (4) | (5) | (6) | (7) | (8) | (9) | (10) | (11) | (12) | (13) | (14) | (15) | |
| 34 | SDSS | J0831+4104 | LSB | 582 | 11.64 | 0.16 | 17.71 | -12.78 | 17.71 | 0.58 | 0.29 | 0.59 | 0.57 | – | 0.90 |
| 35 | SDSS | J0843+4025 | Im | 614 | 12.05 | 0.14 | 17.90 | -12.65 | 17.83 | 0.62 | 0.35 | 0.41 | 0.67 | 7.49 | 0.70 |
| 36 | SDSS | J0845+1519 | dI | 1642 | 24.99 | 0.09 | 18.61 | -13.47 | 18.60 | – | – | 2.14 | – | – | 0.79 |
| 37 | SDSS | J0852+1350 | Im | 1511 | 23.08 | 0.16 | 17.40 | -14.58 | 17.43 | 26.40 | 2.50 | 2.98 | 0.92 | 7.28 | 0.76 |
| 38 | SDSS | J0852+1351 | dI | 1541 | 23.08 | 0.16 | 19.82 | -12.16 | 19.73 | – | – | 0.22 | – | – | 0.64 |
| 39 | UGC4704 | J0859+3912 | Sdm | 596 | 11.74 | 0.13 | 14.82 | -15.66 | 15.51 | 72.86 | 2.56 | 6.73 | 0.94 | 7.96 | 0.13 |
| 40 | SDSS | J0859+3923 | dI | 588 | 11.63 | 0.11 | 17.25 | -13.19 | 16.98 | 1.56 | 0.53 | 0.96 | 0.69 | 7.57 | 0.93 |
| 41 | SDSS | J0900+3222 | dI | 740 | 13.45 | 0.14 | 18.97 | -11.81 | 18.86 | – | – | 0.42 | – | – | 0.64 |
| 42 | UGC4722 | J0900+2536 | Sdm | 1794 | 27.89 | 0.17 | 14.86 | -17.54 | 15.16 | – | – | 22.59 | – | 7.66 | 0.18 |
| 43 | SDSS | J0900+4908 | Sdm | 1600 | 25.78 | 0.09 | 18.49 | -13.65 | 18.63 | – | – | 1.45 | – | – | 0.72 |
| 44 | SDSS | J0908+0657 | Sdm | 1571 | 23.45 | 0.19 | 17.06 | -14.98 | 17.00 | 4.80 | 0.31 | 5.50 | 0.54 | – | 0.57 |
| 45 | SDSS | J0908+0517 | dI | 598 | 10.01 | 0.20 | 17.21 | -12.99 | 16.96 | 2.70 | 1.10 | 0.02 | 0.95 | 7.60 | 0.99 |
| 46 | SDSS | J0911+3135 | dI | 750 | 13.52 | 0.07 | 18.05 | -12.68 | 17.97 | 1.81 | 0.99 | 0.24 | 0.91 | 7.50 | 0.87 |
| 47 | IC2450 | J0917+2525 | S0 | 1644 | 25.47 | 0.14 | 14.06 | -18.11 | 13.84 | – | – | 185.06 | – | – | 0.61 |
| 48 | SDSS | J0926+3343 | LSB | 536 | 10.63 | 0.08 | 17.30 | -12.91 | 17.34 | 6.77 | 2.98 | 0.13 | 0.99 | 7.12 | 0.25 |
| 49 | SDSS | J0928+2845 | dI | 1229 | 19.90 | 0.09 | 16.76 | -14.82 | 16.70 | 23.37 | 1.77 | 8.32 | 0.79 | 7.68 | 0.49 |
| 50 | SDSS | J0929+2502 | dI | 1661 | 25.66 | 0.14 | 19.24 | -12.95 | 19.03 | 5.59 | 2.38 | 0.33 | 0.96 | 7.20 | 0.89 |
| 51 | SDSS | J0929+1155 | dI | 1614 | 24.29 | 0.11 | 17.20 | -14.84 | 17.36 | – | – | 2.76 | – | – | 0.40 |
| 52 | SDSS | J0931+2717 | Sm | 1505 | 23.60 | 0.08 | 18.00 | -13.94 | 17.98 | – | – | 1.06 | – | 7.55 | 0.52 |
| 53 | CGCG035-007 | J0934+0625 | Sc | 574 | 9.23 | 0.18 | 15.42 | -14.59 | 15.22 | 12.67 | 1.19 | 5.22 | 0.76 | – | 0.78 |
| 54 | KUG0934+277 | J0937+2733 | Im | 1594 | 25.16 | 0.08 | 16.50 | -15.59 | 16.53 | – | – | 7.35 | – | – | 0.74 |
| 55 | SDSS | J0940+4459 | dI | 1246 | 20.71 | 0.06 | 18.01 | -13.63 | 17.96 | – | – | 1.60 | – | 7.40 | 0.72 |
| 56 | KISSB23 | J0940+2935 | Sd | 505 | 10.21 | 0.10 | 16.07 | -14.08 | 16.32 | 5.41 | 0.81 | 1.29 | 0.85 | 7.60 | 0.49 |
| 57 | SDSS | J0942+0937 | dI | 1461 | 22.00 | 0.11 | 18.15 | -13.67 | 21.40 | – | – | 2.31 | – | – | 0.81 |
| 58 | UGC5186 | J0942+3315 | Im | 551 | 10.77 | 0.06 | 15.99 | -14.23 | 16.27 | 2.57 | 0.34 | 2.08 | 0.62 | – | 0.40 |
| 59 | SDSS | J0943+4134 | dI | 1403 | 22.77 | 0.06 | 17.64 | -14.21 | 17.63 | 4.89 | 0.65 | 2.47 | 0.73 | – | 0.56 |
| 60 | SDSS | J0944+1000 | dI | 1477 | 22.22 | 0.12 | 16.96 | -14.90 | 16.95 | – | – | 3.88 | – | – | 0.90 |
| 61 | IC559 | J0944+0936 | Sc | 541 | 9.40 | 0.12 | 14.77 | -15.22 | 14.98 | – | – | 6.33 | – | – | 0.87 |
| 62 | UGC5209 | J0945+3214 | Im | 538 | 10.55 | 0.08 | 16.32 | -13.88 | 16.06 | 4.02 | 0.72 | 1.87 | 0.74 | – | 0.75 |
| 63 | SDSS | J0947+4138 | dI | 1389 | 22.56 | 0.07 | 17.92 | -13.92 | 17.61 | 1.20 | 0.21 | 0.46 | 0.78 | 7.76 | 0.54 |
| 64 | MRK407 | J0947+3905 | comp | 1589 | 25.21 | 0.07 | 15.28 | -16.80 | 15.27 | – | – | 17.66 | – | – | 0.74 |
| 65 | UZCJ09475+390 | J0947+3908 | dI | 1553 | 24.73 | 0.07 | 16.85 | -15.19 | 17.00 | – | – | 3.15 | – | 7.50 | 0.63 |
| 66 | SDSS | J0947+3905 | dI | 1479 | 23.70 | 0.07 | 18.03 | -13.92 | 18.12 | – | – | 1.41 | – | – | 0.63 |
0mm \onelinecaptionstrue\captionstyleflushleft
Table 1. Basic parameters of the galaxies in the Lynx?Cancer void. (Condt.)
| Name or | Name in brief | Type | (HI) | (HI)/ | 12+log(O/H) | b/a | |||||||||
| prefix | IAU format | km/s | Mpc | mag | mag | mag | mag | ||||||||
| (1) | (2) | (3) | (4) | (5) | (6) | (7) | (8) | (9) | (10) | (11) | (12) | (13) | (14) | (15) | |
| 67 | UGC5272b | J0950+3127 | Im | 539 | 10.27 | 0.10 | 17.56 | -12.60 | 17.68 | 2.89 | 1.70 | 0.19 | 0.95 | 7.60 | 0.67 |
| 68 | UGC5272 | J0950+3129 | Im | 520 | 10.30 | 0.10 | 14.45 | -15.71 | 14.46 | 46.33 | 1.55 | 3.41 | 0.95 | 7.84 | 0.42 |
| 69 | UGC5288 | J0951+0749 | Sdm | 556 | 9.47 | 0.15 | 14.42 | -15.61 | 14.62 | – | – | 9.69 | – | – | 0.92 |
| 70 | SDSS | J0951+3842 | dI | 1435 | 23.07 | 0.08 | 17.46 | -14.44 | 17.42 | – | – | 1.77 | – | 7.85 | 0.89 |
| 71 | SDSS | J0954+3620 | dI | 503 | 10.22 | 0.04 | 18.05 | -12.04 | 17.93 | 0.62 | 0.60 | 0.16 | 0.84 | – | 0.62 |
| 72 | IC2520 | J0956+2713 | S | 1243 | 19.93 | 0.09 | 14.27 | -17.32 | 14.70 | – | – | 141.81 | – | – | 0.87 |
| 73 | SDSS | J0956+2716 | dI | 1074 | 17.63 | 0.09 | 18.13 | -13.19 | 18.39 | – | – | 0.75 | – | – | 0.54 |
| 74 | UGC5340 | J0956+2849 | BC/Im | 502 | 9.86 | 0.08 | 14.70 | -15.35 | 14.60 | 66.35 | 3.10 | 1.50 | 0.98 | 7.14 | 0.44 |
| 75 | SDSS | J0957+2745 | dI | 1184 | 19.14 | 0.08 | 18.16 | -13.33 | 18.08 | – | – | 0.63 | – | – | 0.60 |
| 76 | UGC5354 | J0958+4744 | Sm | 1168 | 19.68 | 0.07 | 14.15 | -17.39 | 14.60 | – | – | 33.42 | – | – | 0.56 |
| 77 | PC0956+4751 | J0959+4736 | dI | 1093 | 18.66 | 0.07 | 17.05 | -14.37 | 17.14 | 14.87 | 1.70 | 1.91 | 0.91 | – | 0.45 |
| 78 | SDSS | J1000+3032 | dI | 501 | 9.90 | 0.08 | 18.14 | -11.92 | 18.06 | 0.28 | 0.30 | 0.32 | 0.53 | 7.42 | 0.79 |
| 79 | KUG0959+299 | J1002+2943 | dI | 766 | 13.48 | 0.10 | 17.36 | -13.39 | 17.32 | – | – | 0.58 | – | – | 0.77 |
| 80 | UGC5427 | J1004+2921 | SABd | 498 | 9.79 | 0.10 | 14.91 | -15.15 | 14.89 | 5.98 | 0.34 | 5.20 | 0.60 | 7.90 | 0.64 |
| 81 | UGC5464 | J1008+2932 | Sm | 1003 | 16.90 | 0.10 | 15.77 | -15.47 | 15.62 | 19.29 | 0.81 | 9.58 | 0.73 | 7.86 | 0.46 |
| 82 | SDSS | J1010+4617 | dI | 1092 | 18.58 | 0.03 | 18.23 | -13.15 | 18.20 | 0.49 | 0.17 | 0.57 | 0.53 | 7.78 | 0.45 |
| 83 | UGC5540 | J1016+3746 | Sc | 1162 | 19.16 | 0.07 | 14.63 | -16.85 | 14.60 | 46.55 | 0.54 | 26.89 | 0.70 | 8.00 | 0.36 |
| 84 | HS1013+3809 | J1016+3754 | BCG | 1173 | 19.30 | 0.07 | 16.02 | -15.48 | 15.99 | 13.28 | 0.55 | 0.33 | 0.98 | 7.59 | 0.65 |
| 85 | SDSS | J1019+2923 | dI | 874 | 15.25 | 0.14 | 17.48 | -13.57 | 17.43 | 8.23 | 1.97 | 0.60 | 0.95 | – | 0.41 |
0mm \onelinecaptionstrue\captionstyleflushleft
Table 2. Photometric paramerets I.
| Name | Opt.size | Opt.size | ||||||||||
| ′′ | ′′ | ′′ | kpc | mag | ′′ | mag | ′′ | kpc | ||||
| (1) | (2) | (3) | (4) | (5) | (6) | (7) | (8) | (9) | (10) | (11) | ||
| 1 | HIPASSJ0626+24 | 9.9 | 18.5 | 24.7 | 13.7 | 1.5 | 17.9 | 20.6 | 17.6 | 13.7 x 8.1 | 1.5 x 0.9 | |
| 2 | UGC3600 | 26.9 | 75.9 | 24.0 | 40.0 | 1.8 | 16.1 | 74.4 | 15.7 | 40.0 x 10.8 | 1.8 x 0.5 | |
| 3 | UGC3672 | 18.2 | 43.3 | 24.1 | 27.7 | 2.3 | 16.1 | 47.0 | 15.8 | 27.7 x 15.2 | 2.3 x 1.2 | |
| 4 | J0713+2926 | 11.8 | 25.4 | 23.9 | 20.7 | 1.6 | 16.6 | 27.0 | 16.4 | 20.7 x 13.1 | 1.6 x 1.0 | |
| 5 | J0723+3621 | 15.3 | 35.6 | 24.1 | 24.9 | 1.9 | 17.0 | 39.2 | 16.7 | 24.9 x 7.8 | 1.9 x 0.6 | |
| 6 | J0723+3622 | 3.8 | 7.7 | 24.5 | 5.5 | 0.4 | 19.7 | 9.1 | 19.3 | 5.5 x 3.9 | 0.4 x 0.3 | |
| 7 | J0723+3624 | 3.9 | 6.9 | 26.3 | 1.8 | 0.1 | 22.7 | 5.5 | 21.3 | 1.8 x 0.9 | 0.1 x 0.1 | |
| 8 | UGC3860 | 27.1 | 56.3 | 24.2 | 42.5 | 1.6 | 15.1 | 56.1 | 15.0 | 42.5 x 24.0 | 1.6 x 0.9 | |
| 9 | UGC3876 | 34.0 | 68.6 | 23.2 | 71.2 | 5.2 | 13.5 | 91.3 | 13.4 | 71.2 x 41.5 | 5.2 x 3.0 | |
| 10 | J0730+4109 | 5.3 | 14.1 | 22.1 | 14.9 | 1.1 | 16.4 | 21.3 | 16.4 | 14.9 x 8.8 | 1.1 x 0.7 | |
| 11 | J0737+4724 | 7.3 | 18.7 | 24.0 | 12.0 | 0.6 | 18.1 | 19.6 | 17.9 | 12.0 x 5.7 | 0.6 x 0.3 | |
| 12 | UGC3966 | 26.8 | 46.7 | 24.8 | 38.2 | 1.6 | 15.4 | 52.3 | 15.1 | 38.2 x 33.0 | 1.6 x 1.4 | |
| 13 | DDO47 | 52.0 | 106.4 | 25.0 | 60.2 | 2.3 | 15.1 | 103.5 | 14.7 | 60.2 x 26.5 | 2.4 x 1.0 | |
| 14 | KK65 | 22.1 | 53.1 | 23.6 | 41.5 | 1.6 | 15.4 | 63.9 | 15.2 | 41.5 x 15.2 | 1.6 x 0.6 | |
| 15 | J0744+2508 | 2.7 | 6.8 | 22.5 | 7.7 | 0.5 | 17.9 | 10.0 | 17.8 | 7.7 x 6.5 | 0.5 x 0.4 | |
| 16 | J0744+2506 | 1.6 | 4.0 | 23.6 | 3.2 | 0.2 | 20.4 | 4.7 | 20.2 | 3.2 x 2.6 | 0.2 x 0.2 | |
| 17 | MCG9-13-52 | 15.1 | 29.1 | 24.5 | 21.6 | 1.1 | 16.5 | 32.3 | 16.3 | 21.6 x 16.0 | 1.1 x 0.8 | |
| 18 | MCG9-13-56 | 7.9 | 20.5 | 21.6 | 25.6 | 1.2 | 14.9 | 32.8 | 14.8 | 25.6 x 17.4 | 1.2 x 0.8 | |
| 19 | UGC4115 | 27.6 | 59.0 | 23.9 | 49.4 | 1.8 | 14.6 | 72.1 | 14.4 | 49.4 x 29.5 | 1.9 x 1.1 | |
| 20 | UGC4117 | 15.7 | 34.0 | 23.5 | 30.6 | 2.1 | 15.2 | 41.6 | 15.1 | 30.6 x 22.9 | 2.1 x 1.6 | |
| 21 | UGC4148 | 22.9 | 70.6 | 24.0 | 33.2 | 2.2 | 15.9 | 65.6 | 15.5 | 33.2 x 13.9 | 2.2 x 0.9 | |
| 22 | NGC2500 | 43.9 | 82.1 | 22.7 | 92.8 | 4.9 | 11.9 | 117.0 | 11.8 | 92.8 x 92.5 | 4.9 x 4.9 | |
| 23 | MCG71719 | 19.6 | 38.0 | 23.8 | 32.7 | 2.1 | 15.3 | 44.8 | 15.2 | 32.7 x 19.4 | 2.1 x 1.3 | |
| 24 | J0810+1837 | 5.5 | 15.6 | 23.6 | 10.4 | 1.2 | 18.3 | 15.5 | 18.2 | 10.4 x 4.8 | 1.2 x 0.5 | |
| 25 | J0812+4836 | 6.1 | 14.3 | 23.0 | 14.0 | 0.8 | 17.2 | 20.0 | 17.1 | 14.0 x 7.3 | 0.8 x 0.4 | |
| 26 | NGC2537 | 20.0 | 44.8 | 21.3 | 64.6 | 3.1 | 12.1 | 78.1 | 12.1 | 64.6 x 60.8 | 3.1 x 2.9 | |
| 27 | IC2233 | 125.0 | 320.3 | 23.8 | 212.7 | 11.0 | 13.4 | 380.5 | 13.0 | 212.7 x 22.1 | 11.0 x 1.1 | |
| 28 | NGC2541 | 70.5 | 155.0 | 23.4 | 143.2 | 8.3 | 12.1 | 186.7 | 12.1 | 143.2 x 85.9 | 8.3 x 5.0 | |
| 29 | NGC2552 | 51.8 | 96.5 | 23.6 | 97.9 | 5.3 | 12.8 | 123.2 | 12.7 | 97.9 x 66.2 | 5.3 x 3.6 | |
| 30 | KUG0821+321 | 6.1 | 15.3 | 22.8 | 15.1 | 0.9 | 16.7 | 20.5 | 16.6 | 15.1 x 10.1 | 0.9 x 0.6 | |
| 31 | HS0822+3542 | 1.1 | 5.4 | 20.4 | 6.4 | 0.4 | 17.7 | 9.7 | 17.7 | 6.4 x 5.0 | 0.4 x 0.3 | |
| 32 | SAO0822+3545 | 5.8 | 12.3 | 23.8 | 10.7 | 0.7 | 17.7 | 15.1 | 17.5 | 10.7 x 8.6 | 0.7 x 0.6 | |
| 33 | UGC4426 | 36.5 | 72.0 | 25.1 | 37.3 | 1.9 | 15.8 | 69.4 | 15.1 | 37.3 x 23.4 | 1.9 x 1.2 | |
| 34 | J0831+4104 | 3.5 | 10.6 | 22.7 | 8.7 | 0.5 | 17.5 | 13.0 | 17.4 | 8.7 x 7.8 | 0.5 x 0.4 | |
| 35 | J0843+4025 | 3.2 | 8.8 | 22.4 | 9.0 | 0.5 | 17.7 | 12.9 | 17.6 | 9.0 x 6.3 | 0.5 x 0.4 | |
| 36 | J0845+1519 | 3.5 | 9.8 | 23.4 | 7.0 | 0.8 | 18.5 | 11.5 | 18.3 | 7.0 x 5.5 | 0.8 x 0.7 | |
| 37 | J0852+1350 | 8.1 | 17.8 | 24.1 | 13.4 | 1.5 | 17.4 | 20.6 | 17.1 | 13.4 x 10.3 | 1.5 x 1.1 | |
| 38 | J0852+1351 | 1.2 | 4.9 | 22.2 | 4.4 | 0.5 | 19.6 | 6.4 | 19.5 | 4.4 x 2.8 | 0.5 x 0.3 | |
| 39 | UGC4704 | 83.8 | 235.9 | 24.6 | 87.8 | 5.0 | 15.1 | 200.5 | 14.6 | 87.8 x 11.4 | 5.0 x 0.7 | |
| 40 | J0859+3923 | 5.6 | 16.5 | 23.3 | 11.3 | 0.6 | 17.2 | 19.5 | 17.0 | 11.3 x 10.5 | 0.6 x 0.6 | |
| 41 | J0900+3222 | 4.6 | 10.2 | 24.2 | 7.2 | 0.5 | 18.9 | 11.1 | 18.7 | 7.2 x 4.6 | 0.5 x 0.3 | |
| 42 | UGC4722 | 45.0 | 163.1 | 23.7 | 76.1 | 10.3 | 14.9 | 122.8 | 14.7 | 76.1 x 13.3 | 10.3 x 1.8 | |
| 43 | J0900+4908 | 6.6 | 15.2 | 24.7 | 8.1 | 1.0 | 18.7 | 14.0 | 18.3 | 8.1 x 5.8 | 1.0 x 0.7 | |
| 44 | J0908+0657 | 8.3 | 21.0 | 23.4 | 15.9 | 1.8 | 16.9 | 24.3 | 16.8 | 15.9 x 9.0 | 1.8 x 1.0 | |
| 45 | J0908+0517 | 11.9 | 20.8 | 25.0 | 13.7 | 0.7 | 17.5 | 22.8 | 17.0 | 13.7 x 13.5 | 0.7 x 0.7 | |
| 46 | J0911+3135 | 2.1 | 5.3 | 22.0 | 6.6 | 0.4 | 17.8 | 9.1 | 17.8 | 6.6 x 5.8 | 0.4 x 0.4 | |
| 47 | IC2450 | 13.0 | 39.7 | 21.4 | 45.0 | 5.6 | 13.8 | 62.6 | 13.7 | 45.0 x 27.2 | 5.6 x 3.4 | |
| 48 | J0926+3343 | 22.1 | 47.5 | 25.0 | 21.5 | 1.1 | 17.8 | 47.9 | 17.2 | 21.5 x 5.4 | 1.1 x 0.3 | |
| 49 | J0928+2845 | 5.8 | 16.5 | 22.2 | 16.8 | 1.6 | 16.5 | 24.7 | 16.4 | 16.8 x 8.3 | 1.6 x 0.8 |
0mm \onelinecaptionstrue\captionstyleflushleft
Table 2. Photometric paramerets I. (Condt.)
| Name | Opt.size | Opt.size | ||||||||||
| ′′ | ′′ | ′′ | kpc | mag | ′′ | mag | ′′ | kpc | ||||
| (1) | (2) | (3) | (4) | (5) | (6) | (7) | (8) | (9) | (10) | (11) | ||
| 50 | J0929+2502 | 5.5 | 11.0 | 25.3 | 5.3 | 0.7 | 19.7 | 10.0 | 19.1 | 5.3 x 4.7 | 0.7 x 0.6 | |
| 51 | J0929+1155 | 12.6 | 30.6 | 24.1 | 19.5 | 2.3 | 17.3 | 31.4 | 17.0 | 19.5 x 7.8 | 2.3 x 0.9 | |
| 52 | J0931+2717 | 6.2 | 16.8 | 23.7 | 11.0 | 1.3 | 18.0 | 18.2 | 17.8 | 11.0 x 5.8 | 1.3 x 0.7 | |
| 53 | CGCG035-007 | 9.1 | 23.0 | 22.3 | 23.6 | 1.1 | 15.1 | 34.3 | 15.1 | 23.6 x 18.3 | 1.1 x 0.8 | |
| 54 | KUG0934+277 | 11.1 | 24.1 | 23.8 | 20.4 | 2.5 | 16.4 | 29.6 | 16.2 | 20.4 x 15.2 | 2.5 x 1.9 | |
| 55 | J0940+4459 | 2.4 | 7.1 | 21.9 | 7.8 | 0.8 | 17.8 | 10.7 | 17.7 | 7.8 x 5.7 | 0.8 x 0.6 | |
| 56 | KISSB23 | 9.0 | 29.7 | 22.5 | 23.6 | 1.2 | 16.0 | 36.4 | 15.8 | 23.6 x 11.5 | 1.2 x 0.6 | |
| 57 | J0942+0937 | 8.8 | 17.0 | 25.0 | 9.7 | 1.0 | 18.4 | 16.8 | 17.9 | 9.7 x 7.9 | 1.0 x 0.8 | |
| 58 | UGC5186 | 14.6 | 46.6 | 23.2 | 30.2 | 1.6 | 15.8 | 50.2 | 15.6 | 30.2 x 12.1 | 1.6 x 0.6 | |
| 59 | J0943+4134 | 5.2 | 16.1 | 23.0 | 12.1 | 1.3 | 17.5 | 16.3 | 17.4 | 12.1 x 6.8 | 1.3 x 0.8 | |
| 60 | J0944+1000 | 10.6 | 20.9 | 24.4 | 16.4 | 1.8 | 16.9 | 24.3 | 16.7 | 16.4 x 14.8 | 1.8 x 1.6 | |
| 61 | IC559 | 13.6 | 43.6 | 22.7 | 35.7 | 1.6 | 14.3 | 58.0 | 14.2 | 35.7 x 31.2 | 1.6 x 1.4 | |
| 62 | UGC5209 | 15.4 | 31.9 | 24.4 | 22.7 | 1.2 | 16.3 | 29.8 | 16.1 | 22.7 x 17.1 | 1.2 x 0.9 | |
| 63 | J0947+4138 | 2.0 | 9.6 | 21.2 | 8.7 | 1.0 | 17.8 | 12.9 | 17.7 | 8.7 x 4.7 | 1.0 x 0.5 | |
| 64 | MRK407 | 2.6 | 10.2 | 19.5 | 15.8 | 1.9 | 15.0 | 23.7 | 15.0 | 15.8 x 11.7 | 1.9 x 1.4 | |
| 65 | J0947+3908 | 7.8 | 15.6 | 23.2 | 16.5 | 2.0 | 16.6 | 21.5 | 16.6 | 16.5 x 10.3 | 2.0 x 1.2 | |
| 66 | J0947+3905 | 4.9 | 19.2 | 23.4 | 8.5 | 1.0 | 18.1 | 15.9 | 17.9 | 8.5 x 5.4 | 1.0 x 0.6 | |
| 67 | UGC5272b | 5.1 | 12.8 | 23.1 | 11.0 | 0.5 | 17.5 | 15.8 | 17.4 | 11.0 x 7.3 | 0.5 x 0.4 | |
| 68 | UGC5272 | 32.5 | 73.8 | 23.5 | 66.7 | 3.3 | 14.4 | 86.2 | 14.2 | 66.7 x 28.1 | 3.3 x 1.4 | |
| 69 | UGC5288 | 15.5 | 42.6 | 22.7 | 38.6 | 1.8 | 14.2 | 57.6 | 14.1 | 38.6 x 35.4 | 1.8 x 1.6 | |
| 70 | J0951+3842 | 6.2 | 15.4 | 23.8 | 11.2 | 1.3 | 17.4 | 16.7 | 17.2 | 11.2 x 10.0 | 1.3 x 1.1 | |
| 71 | J0954+3620 | 4.6 | 12.5 | 23.3 | 9.7 | 0.5 | 18.0 | 14.8 | 17.8 | 9.7 x 6.0 | 0.5 x 0.3 | |
| 72 | IC2520 | 8.5 | 17.3 | 21.1 | 25.7 | 2.5 | 13.8 | 31.4 | 13.8 | 25.7 x 22.3 | 2.5 x 2.2 | |
| 73 | J0956+2716 | 10.8 | 22.9 | 25.1 | 11.4 | 1.0 | 18.5 | 22.0 | 18.0 | 11.4 x 6.1 | 1.0 x 0.5 | |
| 74 | UGC5340 | 31.3 | 82.4 | 23.8 | 55.6 | 2.7 | 14.8 | 80.7 | 14.6 | 55.6 x 24.7 | 2.7 x 1.2 | |
| 75 | J0957+2745 | 4.4 | 10.2 | 23.3 | 9.3 | 0.9 | 18.0 | 13.3 | 17.9 | 9.3 x 5.6 | 0.9 x 0.5 | |
| 76 | UGC5354 | 25.6 | 53.6 | 23.0 | 53.8 | 5.1 | 13.9 | 74.4 | 13.9 | 53.8 x 30.4 | 5.1 x 2.9 | |
| 77 | PC0956+4751 | 9.3 | 25.1 | 23.4 | 18.3 | 1.7 | 17.0 | 29.0 | 16.8 | 18.3 x 8.3 | 1.7 x 0.8 | |
| 78 | J1000+3032 | 3.8 | 10.3 | 23.2 | 8.3 | 0.4 | 18.0 | 12.4 | 17.8 | 8.3 x 6.5 | 0.4 x 0.3 | |
| 79 | KUG0959+299 | 4.3 | 11.1 | 22.7 | 10.7 | 0.7 | 17.2 | 14.8 | 17.1 | 10.7 x 8.3 | 0.7 x 0.5 | |
| 80 | UGC5427 | 18.8 | 37.5 | 23.2 | 38.5 | 1.8 | 14.7 | 49.9 | 14.6 | 38.5 x 24.6 | 1.8 x 1.2 | |
| 81 | UGC5464 | 21.6 | 48.6 | 24.0 | 36.1 | 3.0 | 15.7 | 54.8 | 15.5 | 36.1 x 16.6 | 3.0 x 1.4 | |
| 82 | J1010+4617 | 2.8 | 8.9 | 22.0 | 9.2 | 0.8 | 18.0 | 12.9 | 18.0 | 9.2 x 4.1 | 0.8 x 0.4 | |
| 83 | UGC5540 | 24.5 | 61.8 | 22.9 | 57.8 | 5.4 | 14.4 | 81.1 | 14.3 | 57.8 x 20.6 | 5.4 x 1.9 | |
| 84 | HS1013+3809 | 1.6 | 8.9 | 19.1 | 12.4 | 1.2 | 15.9 | 18.1 | 15.9 | 12.4 x 8.1 | 1.2 x 0.8 | |
| 85 | J1019+2923 | 6.8 | 18.4 | 23.1 | 15.0 | 1.1 | 17.4 | 22.4 | 17.2 | 15.0 x 6.1 | 1.1 x 0.5 |
0mm \onelinecaptionstrue\captionstyleflushleft
Table 3. Photometric paramerets II.
| Name | ||||||||
| mag | mag | mag | mag | mag | mag | mag | ||
| (1) | (2) | (3) | (4) | (5) | (6) | (7) | (8) | |
| 1 | HIPASSJ0626+24 | 17.530.02 | 0.880.03 | 0.290.01 | 0.150.01 | 0.930.06 | 0.310.02 | 0.160.02 |
| 2 | UGC3600 | 15.570.01 | 1.010.01 | 0.290.01 | 0.120.01 | 1.090.02 | 0.290.01 | 0.150.01 |
| 3 | UGC3672 | 15.720.01 | 1.030.01 | 0.210.01 | -0.010.01 | 0.960.04 | 0.210.02 | 0.090.02 |
| 4 | J0713+2926 | 16.320.01 | 1.010.01 | 0.270.01 | 0.130.01 | 1.000.03 | 0.320.01 | 0.150.02 |
| 5 | J0723+3621 | 16.650.01 | 1.170.02 | 0.350.01 | 0.180.01 | 0.990.03 | 0.310.02 | 0.170.02 |
| 6 | J0723+3622 | 19.240.02 | 0.620.05 | -0.010.04 | 0.210.05 | 0.600.06 | 0.010.05 | 0.070.07 |
| 7 | J0723+3624 | 21.410.04 | 0.110.09 | 0.080.07 | 0.050.08 | – | – | – |
| 8 | UGC3860 | 14.890.01 | 0.900.01 | 0.250.01 | 0.140.01 | 0.950.02 | 0.230.01 | 0.110.01 |
| 9 | UGC3876 | 13.390.01 | 1.110.01 | 0.470.01 | 0.270.01 | 1.130.01 | 0.380.01 | 0.250.01 |
| 10 | J0730+4109 | 16.340.01 | 0.940.01 | 0.250.01 | 0.150.01 | 1.150.03 | 0.430.02 | 0.240.02 |
| 11 | J0737+4724 | 17.740.01 | 1.000.03 | 0.060.01 | 0.020.02 | 0.830.06 | 0.090.03 | 0.100.04 |
| 12 | UGC3966 | 15.040.01 | 0.880.01 | 0.120.01 | 0.090.01 | 0.900.01 | 0.100.01 | 0.090.01 |
| 13 | DDO47 | 14.550.01 | 0.960.01 | 0.310.01 | 0.150.01 | 1.130.02 | 0.350.01 | 0.180.01 |
| 14 | KK65 | 15.170.01 | 1.080.01 | 0.320.01 | 0.200.01 | 1.180.03 | 0.430.01 | 0.230.01 |
| 15 | J0744+2508 | 17.790.01 | 0.900.03 | 0.250.01 | 0.060.02 | 1.040.04 | 0.310.02 | 0.160.02 |
| 16 | J0744+2506 | 20.110.02 | 1.030.09 | 0.370.04 | 0.150.05 | 1.170.16 | 0.510.07 | 0.290.08 |
| 17 | MCG9-13-52 | 16.200.01 | 0.780.01 | 0.290.01 | 0.160.01 | 1.040.04 | 0.310.02 | 0.190.02 |
| 18 | MCG9-13-56 | 14.810.01 | 0.670.01 | 0.200.01 | 0.050.01 | 1.130.03 | 0.450.01 | 0.240.01 |
| 19 | UGC4115 | 14.490.01 | 0.820.01 | 0.280.01 | 0.200.01 | 0.900.03 | 0.310.01 | 0.200.02 |
| 20 | UGC4117 | 15.070.01 | 0.890.01 | 0.150.01 | 0.100.01 | 0.810.02 | 0.050.01 | 0.060.02 |
| 21 | UGC4148 | 15.350.01 | 0.860.01 | 0.210.01 | 0.090.01 | 0.870.03 | 0.260.02 | 0.020.02 |
| 22 | NGC2500 | 11.790.01 | 0.920.01 | 0.350.01 | 0.230.01 | 1.070.01 | 0.440.01 | 0.220.01 |
| 23 | MCG71719 | 15.130.01 | 0.880.01 | 0.290.01 | 0.150.01 | 1.100.02 | 0.390.01 | 0.230.01 |
| 24 | J0810+1837 | 18.050.01 | 0.890.04 | 0.310.02 | 0.140.03 | 0.970.08 | 0.400.04 | 0.250.05 |
| 25 | J0812+4836 | 17.050.01 | 0.960.02 | 0.200.01 | 0.060.01 | 0.920.05 | 0.230.03 | 0.150.03 |
| 26 | NGC2537 | 12.110.01 | 1.010.01 | 0.450.01 | 0.250.01 | – | – | – |
| 27 | IC2233 | 13.010.01 | 0.900.01 | 0.280.01 | 0.150.01 | 1.110.01 | 0.310.01 | 0.190.01 |
| 28 | NGC2541 | 11.990.01 | 0.840.01 | 0.340.01 | 0.140.01 | 0.950.01 | 0.310.01 | 0.150.01 |
| 29 | NGC2552 | 12.670.01 | 0.920.01 | 0.320.01 | 0.150.01 | 1.120.02 | 0.340.01 | 0.180.01 |
| 30 | KUG0821+321 | 16.560.01 | 0.860.01 | 0.330.01 | 0.110.01 | 1.130.05 | 0.420.02 | 0.260.02 |
| 31 | HS0822+3542 | 17.650.01 | 0.650.02 | -0.030.02 | -0.370.03 | – | – | – |
| 32 | SAO0822+3545 | 17.500.01 | 0.770.02 | 0.000.01 | 0.010.02 | 0.750.07 | 0.030.04 | 0.040.05 |
| 33 | UGC4426 | 15.010.01 | 1.240.01 | 0.330.01 | 0.270.01 | 1.090.04 | 0.300.02 | 0.190.02 |
| 34 | J0831+4104 | 17.370.01 | 0.930.02 | 0.320.01 | 0.150.01 | 1.150.05 | 0.430.02 | 0.240.02 |
| 35 | J0843+4025 | 17.580.01 | 0.980.03 | 0.260.01 | 0.140.01 | 1.000.06 | 0.300.03 | 0.160.03 |
| 36 | J0845+1519 | 18.250.01 | 1.210.04 | 0.410.02 | 0.250.02 | 0.920.08 | 0.380.03 | 0.250.03 |
| 37 | J0852+1350 | 17.060.01 | 0.850.02 | 0.320.01 | 0.140.01 | 1.110.07 | 0.420.03 | 0.220.03 |
| 38 | J0852+1351 | 19.480.02 | 0.790.06 | 0.330.03 | 0.020.03 | 0.910.11 | 0.330.05 | 0.200.06 |
| 39 | UGC4704 | 14.500.01 | 0.890.01 | 0.270.01 | 0.140.01 | 1.030.01 | 0.350.01 | 0.240.01 |
| 40 | J0859+3923 | 16.910.01 | 1.100.02 | 0.320.01 | 0.180.01 | 1.160.05 | 0.420.02 | 0.250.03 |
| 41 | J0900+3222 | 18.600.01 | 1.200.04 | 0.430.02 | 0.200.02 | 1.130.07 | 0.430.03 | 0.220.03 |
| 42 | UGC4722 | 14.560.01 | 0.920.01 | 0.190.01 | 0.070.01 | 1.100.03 | 0.330.01 | 0.180.02 |
| 43 | J0900+4908 | 18.170.01 | 1.180.05 | 0.290.02 | 0.210.03 | 0.970.05 | 0.380.03 | 0.190.03 |
| 44 | J0908+0657 | 16.700.01 | 1.160.02 | 0.370.01 | 0.160.01 | 1.100.04 | 0.440.02 | 0.250.02 |
| 45 | J0908+0517 | 16.900.01 | 0.740.02 | 0.220.01 | -0.130.01 | 1.030.06 | 0.240.03 | 0.110.03 |
| 46 | J0911+3135 | 17.760.01 | 0.620.02 | 0.180.02 | 0.060.02 | 1.020.06 | 0.280.03 | 0.180.03 |
| 47 | IC2450 | 13.670.01 | 1.270.01 | 0.480.01 | 0.230.01 | 1.430.02 | 0.550.01 | 0.320.01 |
| 48 | J0926+3343 | 17.050.01 | 0.810.02 | 0.070.01 | -0.080.02 | 0.980.06 | 0.140.03 | 0.070.04 |
| 49 | J0928+2845 | 16.390.01 | 1.130.02 | 0.450.01 | 0.240.01 | 1.310.04 | 0.550.01 | 0.250.01 |
0mm \onelinecaptionstrue\captionstyleflushleft
Table 3. Photometric paramerets II. (Condt.)
| Name | ||||||||
| mag | mag | mag | mag | mag | mag | mag | ||
| (1) | (2) | (3) | (4) | (5) | (6) | (7) | (8) | |
| 50 | J0929+2502 | 18.950.02 | 0.870.05 | 0.160.03 | 0.110.04 | 0.940.08 | 0.190.05 | 0.130.06 |
| 51 | J0929+1155 | 16.890.01 | 0.950.02 | 0.220.01 | 0.150.01 | 1.040.08 | 0.350.04 | 0.200.04 |
| 52 | J0931+2717 | 17.700.01 | 1.170.04 | 0.220.02 | 0.110.02 | 1.040.08 | 0.260.01 | 0.150.05 |
| 53 | CGCG035-007 | 15.050.01 | 1.130.01 | 0.420.01 | 0.200.01 | 1.290.02 | 0.510.01 | 0.220.01 |
| 54 | KUG0934+277 | 16.170.01 | 0.990.01 | 0.300.01 | 0.150.01 | 0.960.04 | 0.370.02 | 0.200.02 |
| 55 | J0940+4459 | 17.670.01 | 0.970.03 | 0.340.01 | 0.190.02 | 1.150.07 | 0.400.03 | 0.200.04 |
| 56 | KISSB23 | 15.770.01 | 0.750.01 | 0.200.01 | 0.160.01 | 1.080.03 | 0.380.01 | 0.230.02 |
| 57 | J0942+0937 | 17.800.03 | 1.020.03 | 0.370.01 | 0.260.01 | 0.940.07 | 0.380.04 | 0.240.04 |
| 58 | UGC5186 | 15.680.01 | 1.090.01 | 0.270.01 | 0.180.01 | 1.120.03 | 0.390.01 | 0.220.01 |
| 59 | J0943+4134 | 17.300.01 | 1.100.02 | 0.340.01 | 0.160.01 | 1.060.05 | 0.400.03 | 0.210.03 |
| 60 | J0944+1000 | 16.620.01 | 0.910.01 | 0.320.01 | 0.130.01 | 0.930.04 | 0.340.02 | 0.240.02 |
| 61 | IC559 | 14.430.01 | 1.020.01 | 0.330.01 | 0.180.01 | 1.100.02 | 0.430.01 | 0.260.01 |
| 62 | UGC5209 | 15.980.01 | 0.950.01 | 0.330.01 | 0.180.01 | 0.950.03 | 0.370.02 | 0.210.02 |
| 63 | J0947+4138 | 17.650.01 | 0.870.03 | 0.120.02 | -0.030.03 | 0.930.06 | 0.280.03 | 0.170.04 |
| 64 | MRK407 | 14.960.01 | 0.860.01 | 0.280.01 | 0.100.01 | – | – | – |
| 65 | J0947+3908 | 16.540.01 | 0.910.01 | 0.230.01 | 0.080.01 | 0.950.03 | 0.270.02 | 0.140.02 |
| 66 | J0947+3905 | 17.710.01 | 1.210.03 | 0.270.01 | 0.150.02 | 1.160.06 | 0.410.03 | 0.210.03 |
| 67 | UGC5272b | 17.290.01 | 0.920.02 | 0.120.01 | 0.080.02 | 0.890.06 | 0.180.03 | 0.110.04 |
| 68 | UGC5272 | 14.180.01 | 0.670.01 | 0.130.01 | 0.070.01 | 0.870.03 | 0.170.02 | 0.150.02 |
| 69 | UGC5288 | 14.080.01 | 0.890.01 | 0.340.01 | 0.190.01 | 1.020.02 | 0.410.01 | 0.270.01 |
| 70 | J0951+3842 | 17.160.01 | 0.930.02 | 0.210.01 | 0.140.01 | 0.980.05 | 0.370.03 | 0.190.03 |
| 71 | J0954+3620 | 17.750.01 | 1.100.03 | 0.210.02 | 0.080.02 | 1.110.07 | 0.280.04 | 0.190.05 |
| 72 | IC2520 | 13.850.01 | 1.050.01 | 0.590.01 | 0.250.01 | 0.980.04 | 0.430.02 | 0.270.02 |
| 73 | J0956+2716 | 17.810.01 | 0.870.03 | 0.280.02 | 0.150.02 | 1.050.08 | 0.320.04 | 0.200.04 |
| 74 | UGC5340 | 14.460.01 | 0.640.01 | 0.030.01 | 0.030.01 | 0.770.01 | 0.060.01 | 0.070.01 |
| 75 | J0957+2745 | 17.850.01 | 1.040.03 | 0.240.01 | 0.100.01 | 0.930.07 | 0.330.03 | 0.140.04 |
| 76 | UGC5354 | 13.840.01 | 0.940.01 | 0.270.01 | 0.140.01 | 1.030.02 | 0.240.01 | 0.130.01 |
| 77 | PC0956+4751 | 16.720.01 | 0.840.01 | 0.310.01 | 0.070.01 | 0.980.04 | 0.340.02 | 0.180.03 |
| 78 | J1000+3032 | 17.780.01 | 1.140.03 | 0.400.01 | 0.120.01 | 1.060.09 | 0.390.05 | 0.170.05 |
| 79 | KUG0959+299 | 17.050.01 | 0.950.02 | 0.230.01 | 0.070.01 | 1.100.06 | 0.370.03 | 0.200.03 |
| 80 | UGC5427 | 14.580.01 | 0.940.01 | 0.290.01 | 0.180.01 | 1.090.02 | 0.330.01 | 0.210.01 |
| 81 | UGC5464 | 15.420.01 | 0.910.01 | 0.380.01 | 0.180.01 | 1.060.03 | 0.430.01 | 0.250.01 |
| 82 | J1010+4617 | 17.920.01 | 0.780.03 | 0.250.02 | 0.110.02 | 0.860.08 | 0.310.04 | 0.200.04 |
| 83 | UGC5540 | 14.300.01 | 0.980.00 | 0.320.01 | 0.170.01 | 1.090.02 | 0.420.01 | 0.260.01 |
| 84 | HS1013+3809 | 15.820.01 | 0.590.02 | -0.110.02 | -0.310.04 | – | – | – |
| 85 | J1019+2923 | 17.170.01 | 1.120.02 | 0.230.01 | 0.030.01 | 1.080.05 | 0.270.02 | 0.130.03 |
0mm \onelinecaptionstrue\captionstyleflushleft
Table 4. Photometric paramerets III.
| Name | |||||||
|---|---|---|---|---|---|---|---|
| ′′ | Sersic | ||||||
| (1) | (2) | (3) | (4) | (5) | (6) | (7) | |
| 1 | HIPASSJ0626+24 | 23.540.06 | 22.790.05 | 24.00 | 22.83 | 8.680.38 | 1.640.10 |
| 2 | UGC3600 | 22.920.08 | 22.550.07 | 23.26 | 24.31 | 11.570.35 | 1.000.01 |
| 3 | UGC3672 | 23.130.25 | 23.200.19 | 23.34 | 23.72 | 13.222.42 | 1.190.15 |
| 4 | J0713+2926 | 22.490.04 | 22.090.05 | 22.84 | 23.21 | 8.150.28 | 1.260.03 |
| 5 | J0723+3621 | 22.580.04 | 22.160.07 | 22.94 | 24.15 | 6.690.21 | 1.100.02 |
| 6 | J0723+3622 | 24.130.20 | 24.140.14 | 24.35 | 24.60 | 5.440.67 | 2.190.57 |
| 7 | J0723+3624 | 24.290.16 | 24.140.23 | 24.56 | 25.77 | 2.110.22 | 1.000.01 |
| 8 | UGC3860 | 22.990.06 | 22.600.05 | 23.34 | 24.00 | 22.420.86 | 1.790.10 |
| 9 | UGC3876 | 22.010.05 | 21.270.06 | 22.47 | 22.91 | 27.160.99 | 1.490.05 |
| 10 | J0730+4109 | 21.080.16 | 20.570.15 | 21.47 | 22.00 | 3.300.14 | 1.000.01 |
| 11 | J0737+4724 | 22.930.12 | 22.780.12 | 23.20 | 24.17 | 5.130.48 | 1.270.10 |
| 12 | UGC3966 | 23.710.11 | 23.300.14 | 24.07 | 24.04 | 30.191.95 | 1.910.21 |
| 13 | DDO47 | 23.180.05 | 23.050.03 | 23.45 | 24.30 | 22.241.14 | 1.010.03 |
| 14 | KK65 | 21.970.08 | 21.700.06 | 22.28 | 23.76 | 9.740.64 | 1.070.04 |
| 15 | J0744+2508 | 22.120.13 | 21.850.05 | 22.43 | 22.48 | 3.920.34 | 1.660.16 |
| 16 | J0744+2506 | 22.900.07 | 22.790.06 | 23.16 | 23.23 | 1.810.09 | 1.370.07 |
| 17 | MCG9-13-52 | 23.410.06 | 23.060.09 | 23.75 | 23.90 | 15.110.59 | 1.680.07 |
| 18 | MCG9-13-56 | 20.290.08 | 20.190.06 | 20.55 | 20.69 | 5.300.35 | 1.080.04 |
| 19 | UGC4115 | 22.130.17 | 21.970.16 | 22.41 | 22.89 | 16.362.27 | 1.160.14 |
| 20 | UGC4117 | 22.020.03 | 21.780.04 | 22.32 | 22.46 | 11.430.30 | 1.210.02 |
| 21 | UGC4148 | 23.420.09 | 23.140.10 | 23.73 | 24.61 | 14.420.46 | 1.000.01 |
| 22 | NGC2500 | 21.200.05 | 21.240.04 | 21.41 | 21.25 | 39.001.16 | 1.430.03 |
| 23 | MCG71719 | 22.170.16 | 22.020.13 | 22.44 | 22.83 | 10.541.18 | 1.150.08 |
| 24 | J0810+1837 | 22.440.11 | 22.200.07 | 22.74 | 24.10 | 3.100.30 | 1.010.06 |
| 25 | J0812+4836 | 22.060.08 | 21.740.05 | 22.39 | 23.27 | 5.020.29 | 1.390.07 |
| 26 | NGC2537 | 20.560.08 | 19.890.07 | 21.00 | 20.83 | 15.100.36 | 1.000.01 |
| 27 | IC2233 | 22.290.12 | 21.740.10 | 22.69 | 23.60 | 27.541.19 | 1.000.01 |
| 28 | NGC2541 | 22.180.06 | 21.600.06 | 22.59 | 22.97 | 52.152.42 | 1.340.05 |
| 29 | NGC2552 | 22.590.02 | 22.120.03 | 22.96 | 23.33 | 53.370.77 | 1.960.04 |
| 30 | KUG0821+321 | 21.800.10 | 21.540.10 | 22.11 | 22.49 | 5.300.41 | 1.270.08 |
| 31 | HS0822+3542 | 21.920.14 | 20.800.12 | 22.50 | 22.65 | 2.010.08 | 1.000.01 |
| 32 | SAO0822+3545 | 22.960.05 | 22.900.09 | 23.21 | 23.30 | 6.600.21 | 1.620.06 |
| 33 | UGC4426 | 23.620.05 | 23.160.04 | 23.99 | 24.37 | 25.951.18 | 1.300.06 |
| 34 | J0831+4104 | 21.650.15 | 21.420.14 | 21.95 | 21.93 | 2.990.41 | 1.080.10 |
| 35 | J0843+4025 | 21.620.20 | 21.490.07 | 21.89 | 22.25 | 2.840.48 | 1.140.14 |
| 36 | J0845+1519 | 22.370.19 | 22.070.19 | 22.69 | 22.92 | 2.770.47 | 1.050.11 |
| 37 | J0852+1350 | 23.020.11 | 22.800.08 | 23.32 | 23.53 | 7.760.63 | 1.390.10 |
| 38 | J0852+1351 | 22.130.09 | 22.410.23 | 22.27 | 22.76 | 1.310.05 | 1.000.01 |
| 39 | UGC4704 | 23.990.20 | 23.490.10 | 24.37 | 24.50 | 32.010.90 | 1.100.09 |
| 40 | J0859+3923 | 23.040.46 | 22.210.31 | 23.53 | 23.52 | 7.202.02 | 1.320.27 |
| 41 | J0900+3222 | 22.760.09 | 22.440.07 | 23.09 | 23.60 | 3.090.24 | 1.180.07 |
| 42 | UGC4722 | 22.290.16 | 22.350.27 | 22.50 | 23.46 | 12.661.49 | 1.020.06 |
| 43 | J0900+4908 | 23.270.05 | 22.750.11 | 23.66 | 24.04 | 4.900.20 | 1.240.05 |
| 44 | J0908+0657 | 21.780.14 | 21.460.07 | 22.11 | 22.58 | 4.090.43 | 1.000.05 |
| 45 | J0908+0517 | 23.460.11 | 23.280.10 | 23.74 | 23.56 | 8.500.91 | 1.110.09 |
| 46 | J0911+3135 | 21.520.20 | 21.370.18 | 21.79 | 21.91 | 2.780.40 | 1.390.16 |
| 47 | IC2450 | 20.730.05 | 20.170.04 | 21.13 | 21.58 | 9.000.15 | 1.000.01 |
| 48 | J0926+3343 | 23.320.07 | 23.260.07 | 23.57 | 24.82 | 7.290.50 | 1.040.06 |
| 49 | J0928+2845 | 21.010.16 | 20.670.14 | 21.34 | 22.10 | 3.650.54 | 1.070.09 |
| 50 | J0929+2502 | 24.100.18 | 23.980.15 | 24.36 | 24.38 | 5.610.82 | 1.380.23 |
0mm \onelinecaptionstrue\captionstyleflushleft
Table 4. Photometric paramerets III. (Condt.)
| Name | |||||||
|---|---|---|---|---|---|---|---|
| ′′ | Sersic | ||||||
| (1) | (2) | (3) | (4) | (5) | (6) | (7) | |
| 51 | J0929+1155 | 22.880.35 | 22.770.10 | 23.14 | 24.15 | 6.731.73 | 1.120.19 |
| 52 | J0931+2717 | 22.580.47 | 22.810.43 | 22.74 | 23.75 | 3.911.27 | 1.070.19 |
| 53 | CGCG035-007 | 20.790.09 | 20.470.09 | 21.12 | 21.29 | 5.730.45 | 1.020.04 |
| 54 | KUG0934+277 | 22.520.05 | 22.260.04 | 22.83 | 23.09 | 8.910.38 | 1.250.04 |
| 55 | J0940+4459 | 21.230.14 | 20.910.12 | 21.56 | 21.96 | 2.240.25 | 1.140.08 |
| 56 | KISSB23 | 22.280.36 | 22.030.34 | 22.59 | 23.82 | 6.711.53 | 1.020.11 |
| 57 | J0942+0937 | 23.700.09 | 23.160.08 | 24.10 | 24.27 | 7.790.53 | 1.430.10 |
| 58 | UGC5186 | 22.710.09 | 22.370.11 | 23.04 | 24.88 | 9.030.24 | 1.000.01 |
| 59 | J0943+4134 | 21.680.06 | 21.410.05 | 21.99 | 22.84 | 2.970.08 | 1.000.01 |
| 60 | J0944+1000 | 23.420.02 | 23.070.04 | 23.76 | 23.76 | 12.550.19 | 1.750.04 |
| 61 | IC559 | 22.620.43 | 22.120.46 | 23.00 | 23.04 | 16.824.84 | 1.110.18 |
| 62 | UGC5209 | 23.280.06 | 22.990.04 | 23.60 | 23.91 | 15.410.60 | 1.610.07 |
| 63 | J0947+4138 | 22.450.21 | 22.180.24 | 22.76 | 23.72 | 2.780.18 | 1.000.01 |
| 64 | MRK407 | 20.710.69 | 20.771.13 | 20.92 | 21.20 | 6.582.39 | 1.170.22 |
| 65 | J0947+3908 | 22.450.04 | 22.190.04 | 22.76 | 23.23 | 8.500.22 | 1.950.07 |
| 66 | J0947+3905 | 23.030.21 | 22.740.17 | 23.35 | 23.95 | 3.820.33 | 1.000.01 |
| 67 | UGC5272b | 22.090.12 | 22.050.08 | 22.33 | 22.82 | 4.230.41 | 1.230.09 |
| 68 | UGC5272 | 21.760.05 | 21.580.03 | 22.04 | 23.00 | 12.840.26 | 1.000.01 |
| 69 | UGC5288 | 21.880.40 | 21.920.25 | 22.09 | 22.04 | 3.441.02 | 1.020.13 |
| 70 | J0951+3842 | 22.470.06 | 22.390.03 | 22.72 | 22.79 | 5.130.26 | 1.160.04 |
| 71 | J0954+3620 | 22.150.08 | 22.160.06 | 22.37 | 23.04 | 3.230.22 | 1.100.05 |
| 72 | IC2520 | 19.690.07 | 18.720.07 | 20.22 | 20.29 | 7.260.36 | 1.320.05 |
| 73 | J0956+2716 | 23.640.12 | 23.370.13 | 23.95 | 24.88 | 6.210.74 | 1.040.09 |
| 74 | UGC5340 | 21.990.04 | 21.870.04 | 22.25 | 23.16 | 11.630.20 | 1.000.01 |
| 75 | J0957+2745 | 21.680.12 | 21.540.16 | 21.95 | 22.64 | 2.470.25 | 1.050.06 |
| 76 | UGC5354 | 21.420.06 | 20.870.06 | 21.82 | 22.42 | 13.980.78 | 1.110.04 |
| 77 | PC0956+4751 | 22.330.24 | 21.930.06 | 22.68 | 24.14 | 5.190.84 | 1.030.08 |
| 78 | J1000+3032 | 22.170.13 | 22.080.18 | 22.43 | 22.67 | 3.380.35 | 1.160.08 |
| 79 | KUG0959+299 | 21.560.12 | 21.490.11 | 21.81 | 22.07 | 3.50.34 | 1.130.07 |
| 80 | UGC5427 | 21.920.04 | 21.560.03 | 22.26 | 22.68 | 14.970.41 | 1.440.03 |
| 81 | UGC5464 | 22.620.05 | 22.260.07 | 22.96 | 23.79 | 12.790.44 | 1.230.03 |
| 82 | J1010+4617 | 21.250.14 | 21.180.04 | 21.50 | 23.00 | 1.850.24 | 1.030.08 |
| 83 | UGC5540 | 21.630.13 | 21.230.23 | 21.98 | 23.25 | 12.031.13 | 1.090.06 |
| 84 | HS1013+3809 | 21.440.56 | 21.660.85 | 21.60 | 22.02 | 2.981.02 | 0.970.14 |
| 85 | J1019+2923 | 21.790.06 | 21.520.05 | 22.10 | 23.77 | 3.340.08 | 1.000.01 |