Evolution of the Phase Diagram of LaFeP1-xAsxO1-yFy ( = 0 – 0.1)
Abstract
P/As-substitution effects on the transport properties of polycrystalline LaFeP1-xAsxO1-yFy with = 0 – 1.0 and = 0 – 0.1 have been studied. In the F-free samples ( = 0), a new superconducting (SC) dome with a maximum of 12 K is observed around = 0 – 0.3. This is separated from another SC dome with 10 K at = 0.6 – 0.8 by an antiferromagnetic region ( = 0.3 – 0.6), giving a two-dome feature in the phase diagram. As increases, the two SC domes merge together, changing to a double peak structure at = 0.05 and a single dome at = 0.1. This proves the presence of two different Fermi surface states in this system.
pacs:
74.70.Xa, 74.25.F-, 74.62.Dhyear number number identifier Date: ]
LABEL:FirstPage101 LABEL:LastPage#1102
I Introduction
Since the discovery of iron-based superconductors, one of the focuses is to find a unified picture of the electronic state among various kinds of iron-based superconductors. It has been revealed that the suppression of spin density wave (SDW) in their parent compounds is important to induce high- superconductivity (SC) in most of the cases. For example, hole doped (Ba,K)Fe2As2 Rotter2008 , electron doped Ba(Fe,Co)2As2 Chu2009 and isovalent-element doped BaFe2(As,P)2 Kasahara2010 share a similar phase diagram which shows the transition from SDW to SC state upon doping. This similarity suggests that the spin fluctuation (SF) near a quantum critical point (QCP) is a possible candidate for the pairing force of Cooper pairs. In LaFeAsO, however, the phase diagram is much more complicated. For example, in LaFeAs(O,H) Iimura2012 ; Fujiwara2013 , as H content increases after the suppression of SDW, two SC regions have been observed in the phase diagram, as well as the reappearance of an antiferromagnetic (AFM) phase in the overdoped region. The origin of these interesting behaviors has been argued in relation to SF or orbital fluctuations Fujiwara2013 ; Iimura2013 ; Yamakawa2013 ; Suzuki2013 ; Onari2014 .
On the other hand, LaFePO is known as a superconductor with 5 K without any trace of SDW Kamihara2006 ; Hamlin2008 . Introducing electrons by F substitution cannot change significantly Suzuki2009 . The striking difference between the properties of the two parent compounds LaFeAsO and LaFePO raises a question about its origin and the relation to SC. Experimental observations Coldea2008 ; Sugawara2008 ; Liu2010 ; Li2009 ; Lu2008 and theoretical calculations Lebe`gue2007 ; Singh2008 ; Kuroki2009 ; Vildosola2008 ; Thomale2011 have shown that the Fermi surface (FS) topologies of LaFeAsO and LaFePO are different, mainly in one of the hole pockets. In particular, the 2-dimensional FS exists in LaFeAsO around X-point, while the 3-dimensional one around Z-point exists in LaFePO. The difference in the resulting FS nesting may be related to the different SC behaviors.
P/As substitution in LaFe(As,P)O provides a platform for studying the relationship among SC, AFM and corresponding FS nesting. A study of LaFe(As,P)O in P doping level from 0 to 60% has been reported previously Wang2009 . After the suppression of SDW around LaFeAsO, a SC dome with a maximum critical temperature 10 K appears around 30% P doping. Recently, a further study from NMR technique has indicated the AFM ordering around 50% P doping with 15 K Kitagawa2014 . Such complex behaviors suggest the importance of the role of AFM correlation to induce SC in LaFe(As,P)O.
In our previous work, we have also studied P/As substitution effect in the same system but for 10% F-doping, namely, LaFeP1-xAsxO0.9F0.1 Saijo2010 ; Miyasaka2011 ; Miyasaka2013 . A maximum 28 K has been observed at = 0.6 together with temperature ()-linearly dependent resistivity and strong dependent Hall coefficient. It suggests SF is strong around = 0.6, which has been confirmed in the NMR study Mukuda2014 . Moreover, it has been revealed that this anomaly at = 0.6 are commonly observed not only in La-1111 system but also in Nd-1111 and Pr-1111 system which are different in lattice size. This implies that the important electronic change, presumably a band crossover, is driven by P/As substitution.
As described above, LaFePO and LaFeAsO systems have different FS states because of the existence of or band near Fermi level. The P/As substitution causes the exchange of the energy level of / band. Resultantly, our previous results show the anomalous behaviors, suggesting that FeP1-xAsxO0.9F0.1 ( = La, Pr and Nd) has the FeP-type FS below 0.6, while the samples of = 1.0 have FeAs-type FS. However, the evidence of our scenario (two FS states and the band crossover around = 0.6) was weak.
In this study, we have extended our previous work to lower F-content ( = 0 and 0.05). The transport properties for LaFeP1-xAsxO1-yFy with = 0 and 0.05 have been mainly studied, and we have tried to clarify the phase diagram, which provides further evidence for the presence of two electronic states originating from the two different FS topologies and its crossover.
II Experimental Methods and sample characterization
Polycrystalline LaFeP1-xAsxO1-yFy with nominal = 0 – 1 and = 0, 0.05 were synthesized by a solid state reaction method. The precursors LaAs/LaP, Fe2O3, Fe and LaF3 were mixed and pressed into pellets. The pellets were sealed in evacuated quartz tubes and heated at 1100 for 40 h. All the above processes except heating were performed in a glove box with pure Ar environment.
The crystal structure was characterized by powder X-ray diffraction with the source of Cu Kα radiation at room temperature. Magnetic susceptibility measurements were performed in a Quantum Design MPMS with the applied field of 10 Oe. The electrical resistivity was measured by a standard four-probe method. Hall effect measurements were performed in the magnetic field up to 7 T. was obtained from Hall resistivity which showed linear dependence on the magnetic applied field. The 31P-NMR spectra in the AFM phase were measured by sweeping the magnetic field to determine the transition temperature Mukuda2 .
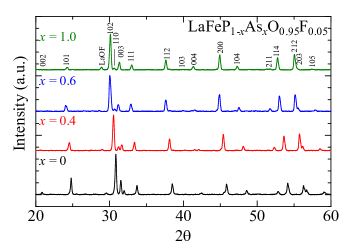
The typical powder X-ray diffraction patterns for = 0.05 are shown in Fig. 1. Almost all the Bragg peaks observed in the diffraction patterns are able to be assigned within the tetragonal symmetry. Note that a minor impurity peak of LaOF is found in some samples. The corresponding lattice constants and for the samples of = 0 and 0.05 are calculated by the least-square fitting of the Bragg peaks and the data is plotted in Fig. 2. Both samples for = 0 and 0.05 show a linear increase in and with increasing As content . This linear change of lattice constants indicates that the As/P solution compounds are successfully prepared.
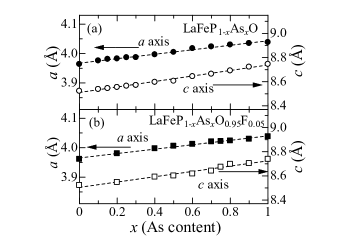
In order to determine the actual As and F concentrations, we performed the energy dispersive X-ray spectroscopy (EDX) measurements. The result of EDX indicates that the actual As concentration is the same as the nominal one () in all the samples. On the other hand, we are not able to estimate the actual F concentration by EDX measurements, because there are peaks for La and Fe near the peak for F in the EDX spectrum. With increasing the nominal F concentration , however, the lattice constants and continuously decrease. (Please see Fig. 2 and Ref. [27].) In the previous report, we have roughly estimated the actual F concentration of 0.03 – 0.04 in the samples with the nominal F concentration = 0.1 Miyasaka2013 . Assuming that the lattice constants depend linearly on the actual F concentration, the actual F concentration is about 0.01 in the samples with nominal F concentration of = 0.05. In short, we can determine the actual As concentration and not the actual F one by EDX measurements. For convenience, we use the nominal F concentration ( = 0 and 0.05) in this paper.
III Results and Discussions
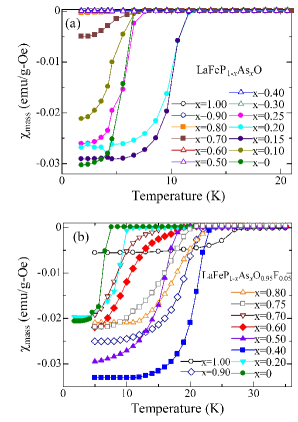
Figure 3 shows the -dependence of magnetic susceptibility for the samples of = 0 and 0.05. The SC transition can be observed in all the samples of = 0.05, and the samples of = 0 with = 0 – 0.25, 0.7 and 0.8. Note that the superconducting volume fraction of the samples of = 0.7 and 0.8 for = 0 is much smaller than the other SC samples.
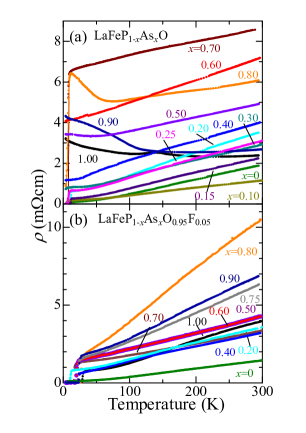
Figure 4 shows the -dependence of resistivity for the samples of = 0 and 0.05. The SC transition can be observed in all the SC samples identified in the magnetic susceptibility measurement. In the samples of = 0, the anomalous upturn in is observed for = 0.8 – 1 due to the SDW transition, which determines . The samples of = 0.3 – 0.6 seemingly behave as normal metals, but the sample of = 0.5 shows an upturn at low ( 50K), which may be related to the recently reported AFM phase Kitagawa2014 . Actually we observe the broading of NMR spectra at = 0.3 – 0.6, which indicates the existence of AFM ordering Mukuda2 . We suppose that the behaviors of resistivity obtained in these polycrystalline samples are dominated mainly by the -plane resistivity due to the large ratio of the -axis resistivity to . In fact, the large anisotropy ratio / (20 – 200) was reported by resistivity measurement of single crystalline LaFeAsO Jesche2012 .
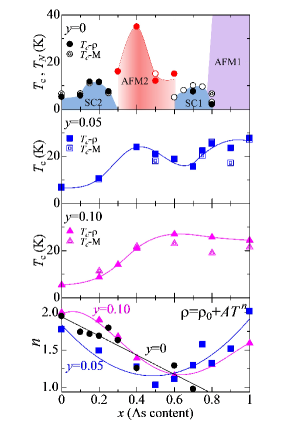
and of all the samples for = 0 are summarized in Fig. 5(a). For = 0, two SC domes and two AFM phases are observed in the phase diagram. The values of at = 0.6 – 0.8 (SC1 dome) are consistent with the previous study Wang2009 . The other SC dome at = 0 – 0.3 (SC2 dome) is first found in the present study. The maximum of SC2 dome is slightly higher (12 K) than that of SC1 dome. Between the two SC domes, an AFM order (AFM2 phase) is detected via NMR technique Kitagawa2014 ; Mukuda2 , with ranged from 15 K to 35 K. Another AFM phase (AFM1 phase) is also observed above = 0.8 through and NMR Kitagawa2014 . Here the AFM order is accompanied with a structural phase transition. The values of , between 50 K – 140 K, in AFM1 phase are much higher than that in AFM2 phase.
Fig. 5(b) shows the -dependence of for = 0.05. A local minimum of is found around = 0.6, giving a double-peak structure. If we further increase to 0.1 Miyasaka2013 , as illustrated in Fig. 5(c), only a single peak is observed at = 0.6. These results suggest that the two SC domes found at = 0 merge with each other when increases.
The exponent of is determined by fitting the data with where is the residual resistivity and is the slope of . The range of fitting is between just above and 100 K. As shown in Fig. 5(d), for the series of = 0, changes gradually from 2 to 1 when increases to 0.7. Note that the data of = 0.5, 0.8 – 1.0 are not suitable for fitting because of the upturn at low . Roughly speaking, the value of is close to 2 in SC2 dome while that is 1 in SC1 dome. It suggests that the behavior of near SC2 dome is described as Fermi liquid (FL) while that near SC1 dome is non-FL. Since the sample of = 0.7 is near the boundary of SDW phase, the gradual decrease in with increasing suggests the existence of a QCP around = 0.7. This point of view is consistent with the previous theoretical prediction Dai2009 . It is rather surprising that the AFM order observed in NMR does not seriously affect the behaviors in resistivity.
For both series of y=0.05 and 0.1, the value of approaches to 1 around = 0.6, and to 2 at = 0 for both series of = 0.05 and 0.1. It indicates that both systems exhibit non-FL behavior around = 0.6, while they behave as FL around = 0.
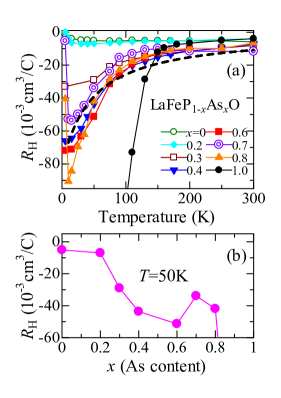
Since Hall coefficient is sensitive to the change of electronic states, it has also been measured for LaFeP1-xAsxO. Figure 6(a) illustrates dependence of for the series of = 0. For = 0 and 0.2, is very small and almost -independent, which is consistent with the FL picture suggested by the measurements of resistivity. When exceeds 0.3, begins to show a strong -dependence, namely, is strongly enhanced at low and suddenly drops at . Although this low- enhancement of is weakened once at = 0.7, it increases again at 0.8. A large drop of observed around 140 K at = 1 indicates the appearance of SDW, which is consistent with the data and the previous studies Wang2009 ; Pallecchi2013 .
To visualize the correspondence to the phase diagram in Fig. 5(a), we plot the -dependence of at 50 K in Fig. 6(b), as a measure of strength of -dependence of . Here we can find that SC2 dome (0 0.25) shows a weak dependence of , while AFM2 phase (0.3 0.6) exhibits a strong dependence. Although the decrease in is slightly recovered at = 0.7 in SC1 dome, drops again in AFM1 phase above = 0.8.
The origin of the strong -dependence of in the intermediate -region may be explained by the following two aspects. The first one is related to the change of FS through P/As substitution. Band calculation Kuroki2009 has demonstrated that the main difference between FS topology of LaFeAsO and LaFePO is the hole pocket located at (,,0), named pocket. Since the band dominates the FS at (,,) across = 0 – (2D tube-like FS), the pocket is observable in LaFeAsO. On the other hand, in LaFePO, the band which replaces from touches the Fermi level only around (,,) but not (,,0), forming a 3D FS pocket. Therefore, the pocket in the = 0 plane is absent in LaFePO. If As is substituted by P, the energy of the and bands will interchange, and as a result the pocket will shrink in size and finally vanish. We believe that this reconstruction of FS affects the dependence of . According to the results in Fig. 6, the interchange of FS topology is supposed to happen between = 0.3 and 0.8. Following the discussion about the presence of two different kinds of electronic states and their crossover in LaFeP1-xAsxO0.9F0.1 in our previous study Miyasaka2013 , we expect that there are two electronic states corresponding to two types of FS topology and the crossover of these two states causes the enhancement of .
The second aspect is related to the AFM phase between = 0.3 and 0.6. Since the AFM order may create a charge gap at some part of FS, it may decrease the number of charge carriers and thus enhance at low . Another fact is that the dependent of these samples can be roughly fitted with the equation = -/(+), and being some constants, which is derived from the SF theory Kontani1999 ; Nakajima2007 . This relation suggests that the strong dependence of is related to the presence of the backflow due to strong electron-electron scattering arising from SF, which is consistent with the observation of low-energy SF above in these samples via NMR technique Kitagawa2014 ; Mukuda2 . Therefore, the enhancement of at = 0.3 – 0.6 may be correlated to the AFM order in AFM2 phase. A small decrease in at = 0.7 indicates a recover of FS which gives SC.
The second aspect, however, cannot be adopted in the case of the F-doped system with = 0.1 Miyasaka2013 . Although a similar enhancement of is observed near = 0.6, the electronic state is far from the AFM order. Therefore, the anomaly in near = 0.6 for the series of = 0.1 should be attributed to the band crossover (the first aspect).
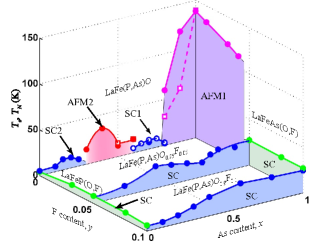
Finally, we discuss the evolution of the electronic properties in LaFeP1-xAsxO1-yFy. The phase diagram of this system is illustrated in Fig. 7, which demonstrates the evolution of two-SC-dome feature. The two-dome structure at = 0 becomes single-dome structure at = 0.1. It can be viewed as the expansion of SC2 dome with increasing as a result of the suppression of AFM2 phase through F doping. The SF originating from AFM2 phase contributes to the development of SC at 0.4 in the series of = 0.05. In the series of = 0.1, the As-content for the maximum strength of SF and the maximum value of is shifted to = 0.6. It suggests that SC2 dome further expands and merges with SC1 dome, resulting in a single dome.
It is clear that the enhancement of in SC2 dome (or in the lower region) is commonly due to the increase of SF suggested by the change of -dependence of , namely, the decrease of the exponent from 2. The enhancement of SF from the FL state has also been observed by NMR experiments Mukuda2014 ; Mukuda2 . Therefore, the SC in low- region is more likely to be induced by SF. In contrast, there is no clear correlation between and the exponent in larger (As-rich) region.
Here we note that the exponent approaches 1 around = 0.6 in all series (See Figure 2(d)). Although the band crossover is suggested in the region of 0.3 0.8 for = 0 and at 0.6 for = 0.1 by the Hall effect measurements, there is no theoretical model that connects -linear and band crossover. This, together with the SC mechanism in larger region, is a remaining puzzle.
IV conclusion
We have studied the transport properties of polycrystalline LaFeP1-xAsxO1-yFy from = 0 to 0.1. For = 0, the new SC dome (SC2 dome) has been found at = 0 – 0.3, constructing a two-dome structure in the phase diagram. With increasing , SC2 dome expands and merges with SC1 dome. Consequently, it results in a double-peak structure of in the series of = 0.05 and a single SC dome in the series of = 0.1. In addition to the AFM phase near LaFeAsO, another AFM phase is observed at = 0.3 – 0.6 (AFM2 phase) via NMR in the series of = 0. Strong temperature dependence of observed in AFM2 phase suggests the AFM order opens a charge gap at some parts of FS. F doping suppresses the AFM order in AFM2 phase and the residual SF induce SC, causing the expansion of SC2 dome. The temperature dependence of commonly approaches -linear at 0.6 in all series, together with the strong -dependence of . The evolution of the two SC domes could strongly support the scenario that there exist two different electronic states corresponding to the two FS topologies for the P-rich and the As-rich compositions, respectively. To clarify the SC mechanism for the latter composition regions, further studies are required.
acknowledgements
We thank M. Ichimiya for technical support for the EDX measurements. We also thank K. Kuroki for fruitful discussions. This work is supported by JST, TRIP and IRON-SEA.
References
- (1) M. Rotter, M. Pangerl, M. Tegel, and D. Johrendt, Angew. Chem. Int. Ed. 47, 7949 (2008).
- (2) J.-H. Chu, J. G. Analytis, C. Kucharczyk, and I. R. Fisher, Phys. Rev. B 79, 014506 (2009).
- (3) S. Kasahara et al., Phys. Rev. B 81, 184519 (2010).
- (4) S. Iimura, S. Matuishi, H. Sato, T. Hanna, Y. Muraba, S. W. Kim, J. E. Kim, M. Takata, and Hideo Hosono, Nat. Commun. 3, 932 (2012).
- (5) N. Fujiwara, S. Tsutsumi, S. Iimura, S. Matsuishi, H. Hosono, Y. Yamakawa, and H. Kontani, Phys. Rev. Lett. 111, 097002 (2013).
- (6) S. Iimura et al., Phys. Rev. B 88, 060501(R) (2013).
- (7) Y. Yamakawa, S. Onari, H. Kontani, N. Fujiwara, S. Iimura, and H. Hosono, Phys. Rev. B 88, 041106(R) (2013).
- (8) K. Suzuki, H. Usui, K. Kuroki, S. Iimura, Y. Sato, S. Mstsuishi, and H. Hosono, J. Phys. Soc. Jpn. 82, 083702 (2013).
- (9) S. Onari, Y. Yamakawa, and H. Kontani, Phys. Rev. Lett. 112, 187001 (2014).
- (10) Y. Kamihara, H. Hiramatsu, M. Hirano, R. Kawamura, H. Yanagi, T. Kamiya, and H. Hosono, J. Am. Chem. Soc. 128, 10012 (2006).
- (11) J. J. Hamlin, R. E. Baumbach, D. A. Zocco, T. A. Sayles, and M. B. Maple, J. Phys.: Condens. Matter 20, 365220 (2008).
- (12) S. Suzuki, S. Miyasaka, S. Tajima, T. Kida, and M. Hagiwara, J. Phys. Soc. Jpn. 78, 114712 (2009).
- (13) A. I. Coldea, J. D. Fletcher, A. Carrington, J. G. Analytis, A. F. Bangura, J.-H. Chu, A. S. Erickson, I. R. Fisher, N. E. Hussey, and R. D. McDonald, Phys. Rev. Lett. 101, 216402 (2008).
- (14) H. Sugawara, R. Settai, Y. Doi, H. Muranaka, K. Katayama, H. Yamagami, and Y. Onuki, J. Phys. Soc. Jpn. 77, 113711 (2008).
- (15) C. Liu et al., Phys. Rev. B 82, 075135 (2010).
- (16) D. H. Lu et al., Physica C 469, 452 (2009).
- (17) D. H. Lu, M. Yi, S.-K. Mo, A. S. Erickson, J. Analytis, J.-H. Chu, D. J. Singh, Z. Hussain, T. H. Geballe, I. R. Fisher, and Z.-X. Shen, Nature 455, 81 (2008).
- (18) S. Lebègue, Phys. Rev. B 75, 035110 (2007).
- (19) D. J. Singh, and M.-H. Du, Phys. Rev. Lett. 100, 237003 (2008).
- (20) K. Kuroki, H. Usui, S. Onari, R. Arita, and H. Aoki, Phys. Rev. B 79, 224511(2009).
- (21) V. Vildosola, L. Pourovskii, R. Arita, S. Biermann, and A. Georges, Phys. Rev. B 78, 064518 (2008).
- (22) R. Thomale, C. Platt, W. Hanke, and B. A. Bernevig, Phys. Rev. Lett. 106, 187003 (2011).
- (23) C. Wang, S. Jiang, Q. Tao, Z. Ren, Y. Li, L. Li, C. Feng, J. Dai, G. Cao, and Z. A. Xu, EPL 86, 47002 (2009).
- (24) S. Kitagawa, T. Iye, Y. Nakia, K. Ishida, C. Wang , G.-H. Cao, and Z.-A. Xu, J. Phys. Soc. Jpn. 83, 023707 (2014).
- (25) S. Saijo, S. Suzuki, S. Miyasaka, and S. Tajima, Physica C 470, S298 (2010).
- (26) S. Miyasaka, A. Takemori, S. Saijo, S. Suzuki, and S. Tajima, J. Phys. Chem. Solid 72, 414 (2011).
- (27) S. Miyasaka, A. Takemori, T. Kobayashi, S. Suzuki, S. Saijo, and S. Tajima, J. Phys. Soc. Jpn. 82, 124706 (2013).
- (28) H. Mukuda, F. Engetsu, K. Yamamoto, K. T. Lai, M. Yashima, Y. Kitaoka, A. Takemori, S. Miyasaka, and S. Tajima, Phys. Rev. B 89, 064511 (2014).
- (29) H. Mukuda, F. Engetsu, T. Shiota, K. T. Lai, M. Yashima, Y. Kitaoka, S. Miyasaka, and S. Tajima, J. Phys. Soc. Jpn. 83, 083702 (2014).
- (30) A. Jesche, F. Nitsche, S. Probst, Th. Doert, P. Müller, and M. Ruck, Phys. Rev. B 86, 134511 (2012).
- (31) J. Dai, Q. Si, J.-X. Zhu, and E. Abrahams, Proc. Natl. Acad. Sci. U.S.A. 106, 4118 (2009).
- (32) I. Pallecchi, F. Bernardini, F. Caglieris, A. Palenzona, S. Massidda, and M. Putti, Eur. Phys. J. B 86, 338 (2013).
- (33) H. Kontani, K. Kanki, and K. Ueda, Phys. Rev. B 59, 14723 (1999).
- (34) Y. Nakajima et al., J. Phys. Soc. Jpn. 76, 024703 (2007).
- (35) H. Luetkens et al., Nat. Mater. 8, 305 (2009).