Integrative multi-omics module network inference with Lemon-Tree
1Institut Curie, 26 rue d’Ulm, 75248 Paris, France
2INSERM U900, 75248 Paris, France
3Mines ParisTech, 77300 Fontainebleau, France
4Division of Genetics & Genomics, The Roslin Institute, The University of Edinburgh, Easter Bush, Midlothian, EH25 9RG, UK
∗Corresponding authors, e-mail: eric.bonnet@curie.fr, tom.michoel@roslin.ed.ac.uk
Abstract
Module network inference is an established statistical method to reconstruct co-expression modules and their upstream regulatory programs from integrated multi-omics datasets measuring the activity levels of various cellular components across different individuals, experimental conditions or time points of a dynamic process. We have developed Lemon-Tree, an open-source, platform-independent, modular, extensible software package implementing state-of-the-art ensemble methods for module network inference. We benchmarked Lemon-Tree using large-scale tumor datasets and showed that Lemon-Tree algorithms compare favorably with state-of-the-art module network inference software. We also analyzed a large dataset of somatic copy-number alterations and gene expression levels measured in glioblastoma samples from The Cancer Genome Atlas and found that Lemon-Tree correctly identifies known glioblastoma oncogenes and tumor suppressors as master regulators in the inferred module network. Novel candidate driver genes predicted by Lemon-Tree were validated using tumor pathway and survival analyses. Lemon-Tree is available from http://lemon-tree.googlecode.com under the GNU General Public License version 2.0.
Introduction
Recent years have witnessed a dramatic increase in new technologies for interrogating the activity levels of various cellular components on a genome-wide scale, including genomic, epigenomic, transcriptomic, and proteomic information [1]. It is generally acknowledged that integrating these heterogeneous datasets will provide more biological insights than performing separate analyses. For instance, in 2005, Garraway and colleagues combined SNP-based genetic maps and expression data to identify a novel transcription factor involved in melanoma progression [2]. More recently, international consortia such as The Cancer Genome Atlas (TCGA) or the International Cancer Genome Consortium (ICGC) have launched large-scale initiatives to characterize multiple types of cancer at different levels (genomic, transcriptomic, epigenomic, etc.) on several hundreds of samples. These integrative studies have already led to the identification of novel cancer genes [3, 4].
Among the many ways to approach the challenge of data integration, module network inference is a statistically well-grounded method which uses probabilistic graphical models to reconstruct modules of co-regulated genes (or other biomolecular entities) and their upstream regulatory programs and which has been proven useful in many biological case studies [5, 6]. The module network model was introduced as a method to infer regulatory networks from large-scale gene expression compendia [5] and has subsequently been extended to integrate eQTL data [7, 8], regulatory prior data [9], microRNA expression data [10], clinical data [11], copy number variation data [12] or protein interaction networks [13]. The original module network learning algorithm depended on a greedy heuristic, but subsequent work has extended this with alternative heuristics [14], Gibbs sampling [15] and ensemble methods [16]. Module network inference can be combined with gene-based network reconstruction methods [17, 18] and recently a method has been developed to reconstruct module networks across multiple species simultaneously [19]. This methodological and algorithmic work has complemented studies that were solely focused on applying module network methods to provide new biological and biomedical insights [20, 21, 22, 23, 24, 25, 26, 27].
Although the success of the module network method is indisputable, the various methodological innovations have been made available in a bewildering array of tools, written in a variety of programming languages, and, when source code has been released, it has never been with an OSI compliant license (Table 1). Here we present Lemon-Tree, a ‘one-stop shop’ software suite for module network inference based on previously validated algorithms where a community of developers and users can implement, test and use various methods and techniques. We benchmarked Lemon-Tree using large-scale datasets of somatic copy-number alterations and gene expression levels measured in glioblastoma samples from The Cancer Genome Atlas and found that Lemon-Tree compares favorably with existing module network softwares and correctly identifies known glioblastoma oncogenes and tumor suppressors as master regulators in the inferred module network. Novel candidate driver genes predicted by Lemon-Tree were validated using pathway enrichment and survival analysis.
Design and Implementation
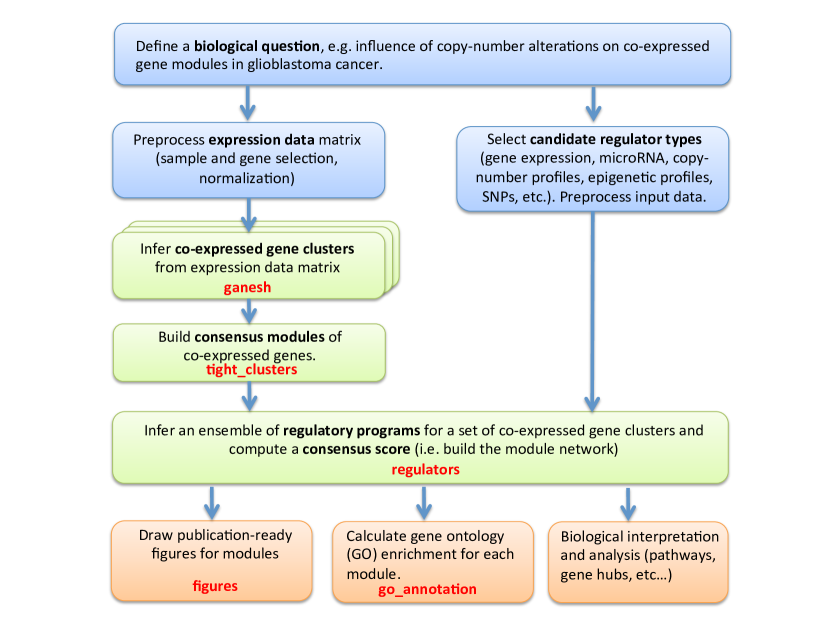
Lemon-Tree is a platform-independent command-line tool written in Java which implements previously validated algorithms for model-based clustering [15] and module network inference [16]. The principal design difference between Lemon-Tree and other module network softwares (e.g. Genomica [5] or CONEXIC [12]) consists of the separation of module learning and regulator assignment. We have previously shown that running a two-way clustering algorithm until convergence, and thereafter identifying the regulatory programs that give rise to the inferred condition clusterings for each gene module results in higher module network model likelihoods and reduced computational cost compared to the traditional approach of iteratively updating gene modules and regulator assignments [14, 16]. Hence Lemon-Tree is run as a series of tasks, where each task represents a self-contained step in the module network learning and evaluation process and the output of one task forms the input of another (a work flow representation of the different steps is illustrated in Figure 1):
- Task “ganesh”
-
Run one or more instances of a model-based Gibbs sampler [15] to simultaneously infer co-expression modules and condition clusters within each module from a gene expression data matrix.
- Task “tight_clusters”
-
Build consensus modules of genes that systematically cluster together in an ensemble of multiple “ganesh” runs. Consensus modules are reconstructed by a novel spectral edge clustering algorithm which identifies densely connected sets of nodes in a weighted graph [28], with edge weight defined here as the frequency with which pairs of genes belong to the same cluster in individual “ganesh” runs. Details about the tight clustering algorithm are provided in the Supplementary Methods.
- Task “regulators”
-
Infer an ensemble of regulatory programs for a set of modules and compute a consensus regulator-to-module score. Regulatory programs take the form of a decision tree with the (expression level of) regulators at its internal nodes. The regulator score takes into account the number of trees a regulator is assigned to, with what score (posterior probability), and at which level of the tree [16]. An empirical distribution of scores of randomly assigned regulators is provided to assess significance. Regulator data need not come from the same data that was used for module construction but can be any continuous or discrete data type measured on the same samples. When multiple regulator types are considered, the “regulators” task is run once for each of them.
- Task “experiments”
-
For a fixed set of gene modules, cluster conditions separately for each module using a model-based Gibbs sampler [15] and store the resulting hierarchical condition trees in a structured XML file.
- Task “split_reg”
-
Assign regulators to a given range of one or more modules. This task allows parallelization of the “regulators” task and needs the output of the “experiments” task as an input.
- Task “figures”
-
Draw publication-ready visualizations for a set of modules in postscript format, consisting of a heatmap of genes in each module, organized according to a consensus clustering of the samples, plus heatmaps of its top-scoring regulators, separated according to the regulator type (cf. Supplementary Figure 1).
- Task “go_annotation”
-
Calculate gene ontology enrichment for each module using the BiNGO [29] library.
While a typical run of Lemon-Tree will apply tasks “ganesh”, “tight_clusters” and “regulators” in successive order, the software is designed to be flexible. For instance, the “tight_clusters” task can be equally well applied to build consensus clusters from the output of multiple third-party clustering algorithms, regulators can be assigned to the output of any clustering algorithm, etc. To facilitate this interoperability with other tools, input/output is handled via plain text files with minimal specification, the only exception being the storage of the regulatory decision trees which uses an XML format. Tasks also permit customization by changing the value of various parameters. We have purposefully provided default values for all parameters, based on our experience accrued over many years of developing and applying the software to a great variety of datasets from multiple organisms, and avoided mentioning any parameter settings in the Tutorial such that first-time users are presented with a simple workflow. Detailed instructions on how to integrate or extend (parts of) Lemon-Tree and a complete overview of all parameters and their default values are provided on the project website (http://lemon-tree.googlecode.com/).
Results
Benchmark between Lemon-Tree and CONEXIC
We compared the performance of Lemon-Tree with CONEXIC (COpy Number and Expression In Cancer), a state-of-the-art module network algorithm designed to integrate matched copy number (amplifications and deletions) and gene expression data from tumor samples [12]. The general framework is the same for the algorithms, with modules of co-expressed genes associated to a list of regulators assigned via a probabilistic score. However, the probabilistic techniques used to build the modules and to assign regulators are different. We ran the two programs on the same large-scale reference data set to evaluate these differences. We used Gene Ontology (GO) enrichment and a reference network of protein-protein interactions to compare the co-expressed modules and the regulatory programs.
We downloaded gene expression and copy number glioblastoma datasets from the TCGA data portal [3] and we build an expression data matrix of 250 samples and 9,367 genes. We limited the number of samples for this benchmark study in order to save computational time. For the candidate regulators, we selected the top 1,000 genes that were significantly amplified or deleted as input genes for both CONEXIC and Lemon-Tree. To run CONEXIC, we followed the instructions of the manual and more specifically used the recommended bootstrapping procedure to get robust results. For Lemon-Tree, we generated an ensemble of two-way clustering solutions that were assembled in one robust solution by node clustering. Then we assigned the regulators using the same input list as with CONEXIC. A global score was calculated for each regulator and for each module and we selected the top 1% regulators as the final list (see Supplementary Methods). The total run-time for the two software programs on the benchmark dataset was quite similar, with a small advantage for Lemon-Tree (Supplementary Table S5).
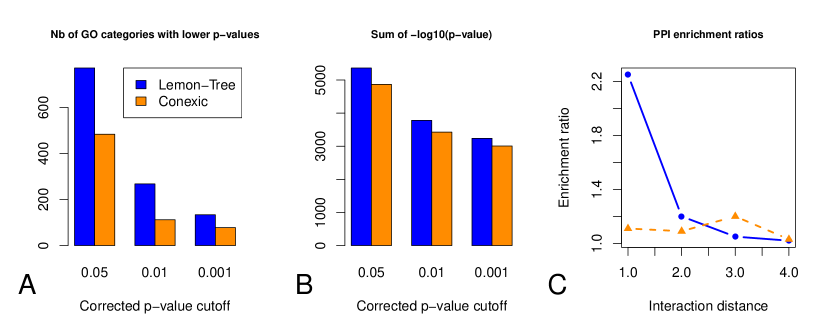
To compare the Gene Ontology (GO) categories between Lemon-Tree and CONEXIC, we built a list of all common categories for a given p-value threshold and converted the corrected p-values to (p-value) scores. We selected the highest score for each GO category and we counted the number of GO categories having a higher score for Lemon-Tree or CONEXIC, and calculated the sum of scores for each GO category and each software. The results shown in Figure 2 indicate that Lemon-Tree clusters have a higher number of GO categories with lower p-values than CONEXIC (Figure 2A), and that globally the p-values are lower for Lemon-Tree clusters (Figure 2B). To benchmark the regulators’ assignment of each software, we used a scoring scheme developed by Jornsten et al. [30]. For a given interaction distance in a reference protein-protein interaction network, we calculated the relative enrichment of known interactions in the networks inferred by Lemon-Tree and CONEXIC with respect to known interactions in networks where edges have been randomly re-assigned (see Supplementary Methods). Figure 2C shows the relative enrichments for interaction distances ranging from 1 (direct interaction) to 4. The Lemon-Tree inferred network is enriched for short or direct paths, a desired characteristic for well-estimated networks [30].
These results are consistent with a previous study conducted on bacteria and yeast data, where we showed a better performance in terms of enrichment in functional categories and known regulatory interactions of the algorithms underlying the Lemon-Tree software over Genomica (a software tool on which CONEXIC is based) [17]. Taken together, these results show that Lemon-Tree compares favorably with state-of-the-art module network inference algorithms.
Integrative analysis of TCGA glioblastoma expression and copy-number data
Lemon-Tree can be used to integrate various types of ’omics’ data and generate new biological and biomedical insights. Here, we exemplify how to integrate copy-number and expression data for a large dataset of glioblastoma tumor samples and show that the results are enriched in known key players of canonical tumor pathways as well as novel candidates. Malignant gliomas are the most common subtype of primary brain tumors and are very aggressive, highly invasive and neurologically destructive. Glioblastoma multiforme (GBM) is the most malignant form of gliomas, and despite intense investigation of this disease in the past decades, most patients with GBM die within approximately 15 months of diagnosis [31]. Somatic copy-number alterations (SCNA) are extremely common in cancer and affect a larger fraction of the genome than any other types of somatic genetic alterations. They have critical roles in activating oncogenes and inactivating tumor suppressor genes, and their study has suggested novel potential therapeutic strategies [32, 33]. However, distinguishing the alterations that drive cancer development from the passenger SCNAs that are acquired over time during cancer progression is a critical challenge. Here we use the module network framework implemented in the Lemon-Tree software tool to build a module network relating genes located in regions that are significantly amplified or deleted to modules of co-expressed genes. In other words, the module network selects and prioritizes copy-number altered genes that might play a role (direct or indirect) for clusters of co-expressed genes, performing important biological functions in glioblastoma. The resulting module network is used to prioritize SCNA genes that are amplified or deleted, and to provide novel hypotheses regarding drivers of glioblastoma.
We downloaded data from the TCGA project portal [3] and we selected 484 glioblastoma tumor samples from different patients (representing 91% of the available samples). We selected 7,574 gene expression profiles and generated an ensemble of two-way clustering solutions that were assembled in one robust solution by node clustering, resulting in a set of 121 clusters composed of 5,423 genes (Supplementary Methods and Supplementary Table S1). We assembled a list of genes amplified and deleted in glioblastoma tumors from the most recent GISTIC run of the Broad Institute TCGA Copy Number Portal on glioblastoma samples. GISTIC [34] is the standard software tool used for the detection of peak regions significantly amplified or deleted in a number of samples from copy-number profiles. We also included in the list a number of key genes amplified or deleted from previous studies [35, 36, 34]. The final list is composed of 353 amplified and 2,007 deleted genes (with all genes present on sex chromosomes excluded). We did not use extremely stringent statistical thresholds for the selection, to avoid the exclusion of potentially interesting candidates. From this list we built SCNA gene copy-number profiles using TCGA data and used those profiles as candidate regulators for the co-expressed gene clusters. We assigned regulators independently for amplified and deleted genes, and we selected the top 1% highest scoring regulators as the final list (a cutoff well above assignment of regulators expected by chance), with 92 amplified and 579 deleted selected genes (Supplementary Methods and Supplementary Tables S2 and S3). The resulting glioblastoma module network is composed of 121 clusters of co-expressed genes, together with associated prioritized lists of high-scoring SCNA genes (associated to amplified and deleted regions).
More than 60% of the clusters have a significant Gene Ontology (GO) enrichment (corrected p-value 0.05, Table 2 and Supplementary Table S4). Several of those enriched clusters can be related to the hallmarks of cancers, ten distinctive and complementary capabilities that have been defined as the fundamental biological capabilities acquired during tumor development [37, 38]. For instance, we have 11 clusters enriched for GO categories related to cell cycle processes and regulation (p-value 0.05), with three of them having very strong enrichment (corrected p-values 4, 6 and 9, Table 2). The cell cycle is deregulated in most cancers and is at the heart of the “sustaining proliferative signaling” hallmark. Eight clusters are enriched for categories related to immune response, with two of them displaying strong enrichment (corrected p-values 6 and 6, Table 2). Most tumor lesions contain immune cells present at various degrees of density. Intense recent research has shown that this immune response is linked to two phenomena. First, it is obviously an attempt by the immune system to eradicate the tumor, but secondly, there is now a large body of evidence showing that immune cells also have strong tumor-promoting effects, and both aspects are categorized as part of the hallmarks of cancer [38]. For instance, microglia are a type of glial cells that act as macrophages of the brain and the spinal cord and thus act as the main form of immune response in the central nervous system. They constitute the dominant form of glioma tumor infiltrating immune cells, and they might promote tumor growth by facilitating immunosuppression of the tumor microenvironment [39]. The development of blood vessels (angiogenesis) is another crucial hallmark of cancer, providing sustenance in oxygen and nutrients and a way to evacuate metabolic wastes and carbon dioxide [38]. Glioblastoma multiforme is characterized by a striking and dramatic induction of angiogenesis [31]. There are seven clusters enriched for GO categories related to angiogenesis and blood vessel development, with two of them having strong enrichment (corrected p-values 4 and 9, Table 2). A recent large-scale integrative study of hundreds of glioblastoma samples has shown that chromatin modifications could potentially have high biological relevance for this type of tumor [40]. Interestingly, we have a cluster highly enriched in chromatin assembly and organization (corrected p-value 5 and 9, Table 2). Taken together, these results show that the clusters of co-expressed genes in the module network are representative of the molecular functions and biological processes involved in tumor in general and more specifically in glioblastoma.
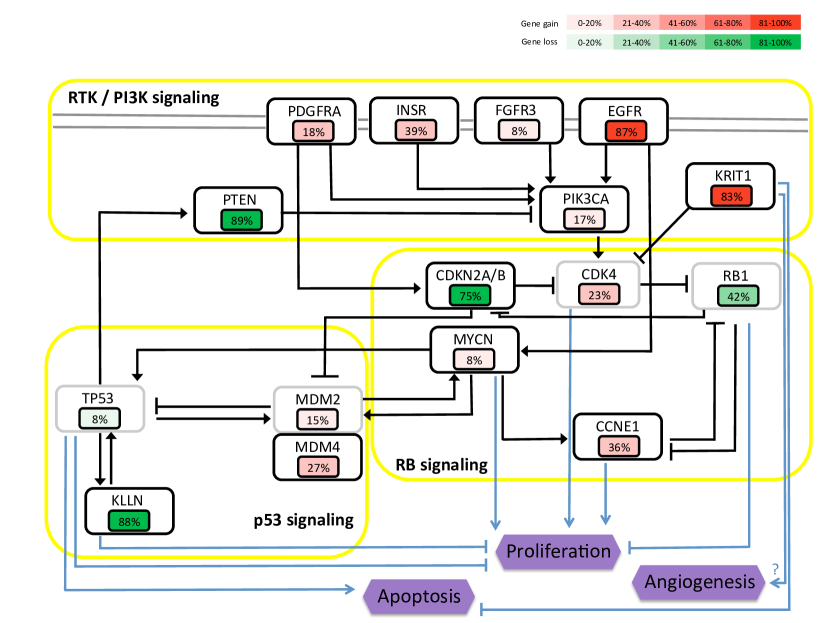
In the glioblastoma module network, we inferred a list of amplified and deleted SCNA genes linked to one or more clusters of co-expressed genes. Some of those SCNA genes are highly connected, representing potential master copy-number regulators for module activity. To identify and analyze those SCNA hub genes, we calculated for each high-scoring regulator the sum of the scores obtained in each module, and ranked them by decreasing score for amplified (Table 3) and deleted (Table 4) genes. Among these genes, we find many well-known oncogenes and tumor supressors that are frequently amplified, deleted or mutated in glioblastoma. Those genes include EGFR, PDGFRA, FGFR3, PIK3CA, MDM4, CDKN2A/B, PTEN and are all members of the core alterated pathways in glioblastoma controlling key phenotypes such as proliferation, apoptosis and angiogenesis (Figure 3, [3, 35, 40, 41]). Those genes and pathways are also frequently impaired in many other types of tumors [42, 43, 44]. In addition, we find in those lists of hub genes a number of interesting new candidates, both in amplified and deleted genes, that have not been associated with glioblastoma before. To better visualize the importance and role of both the well-known and novel SCNAs prioritized by Lemon-Tree, we represent those that are part of the three core pathways altered in glioblastoma as a network with edges representing activation or inhibition relationships, together with their levels of gene gains and losses in glioblastoma samples (Figure 3).
Within the list of amplified gene hubs (Table 3), we find a number of genes that have been rarely or never associated before with glioblastoma. INSR is a gene encoding for the insulin receptor, a transmembrane receptor activated by insuline and IGF factors, member of the tyrosine receptor kinase family, and playing a key role in glucose homeostasis. INSR is selected as a high-scoring regulator in 15 modules and ranked in third position in the list of amplified gene hubs. It is found to be amplified as low-level gain or higher in 39% of the samples (Table 3). Beyond its well-known role in glucose homeostasis, INSR stimulates cell proliferation (Figure 3) and migration and is often aberrantly expressed in cancer cells [45]. Consequently, amplification of INSR in glioblastoma may enhance proliferation. MYCN encodes a transcription factor (N-myc) highly expressed in fetal brain and critical for normal brain development. It is also a well-known proto-oncogene, and amplification of N-myc is associated with poor outcome in neuroblastoma [46]. MYCN is amplified as low-level gain or higher in 8% of the glioblastoma samples and is connected to 21 modules (Table 3). MYCN is part of the RB signaling pathway, and is also strongly connected to the RTK / PI3K and p53 pathways (Figure 3), with a direct influence on proliferation. For that reason, its amplification may also favor proliferation in glioblastoma. KRIT1 (also known as CCM1) is a gene crucial for maintaining the integrity of the vasculature and for normal angiogenesis. Loss of function of this gene is responsible for vascular malformations in the brain known as cerebral cavernous malformations [47, 48]. It is amplified as low-level gain or higher in 83% of the glioblastoma samples and it is listed in the top 10 hubs in our list (Table 3). The consequences of KRIT1 amplification are not completely clear, but we may hypothesize that it is required for proper angiogenesis development, which is a hallmark of glioblastoma [31], and that it may also help decrease apoptosis (Figure 3).
In the list of putative deleted genes, PAOX (polyamine oxidase) is ranked first, with a connection to 54 modules and the highest sum of scores value. It is classified as single loss (GISTIC call value of -1 or lower) in 89% of the samples. This is a very high value, comparable to the value obtained for the classical tumor suppressor CDKN2A (75%, Table 4). Amine oxidases are involved in the metabolism of polyamines, regulating their intracellular concentrations and elimination. The products of this metabolism (e.g. hydrogen peroxyde) are cytotoxic and have been considered as a cause for apoptotic cell death. Amine oxidases are considered as biological regulators for cell growth and differentiation, and a primary involvement of amine oxidases in cancer growth inhibition and progression has been demonstrated [49]. Therefore, PAOX might have a tumor suppressor activity and its deletion in many glioblastoma samples could provide a selective advantage to glioblastoma tumor cells. Interestingly, amino acids metabolism is not part of the standard alterated pathways in glioblastoma (explaining why we did not represent PAOX on Figure 3), but targeting this pathway could lead to novel therapeutic treatments [50]. KLLN encodes a nuclear transcription factor and shares a bidirectional promoter with PTEN. It is activated by p53 and is involved in S phase arrest and apoptosis [51]. Recent studies show that KLLN has a tumor supressor effect and is associated with worse prognosis in prostate and breast carcinomas [52, 53]. Consequently, the loss of KLLN that is observed in 88% of the glioblastoma samples (Table 4) would help the development of tumor cells by decreasing apoptosis and favoring proliferation (Figure 3).
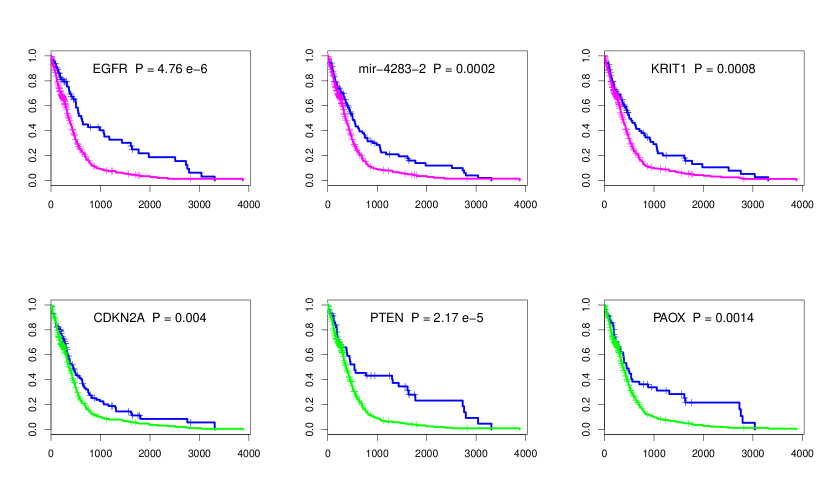
To assess the biological relevance of the amplified and deleted gene hubs in the module network, we analyzed the prognosis value of the top gene hubs by survival analysis, using the clinical data available for TCGA samples (survival time and status of the patient). We constructed Kaplan-Meier estimates using GISTIC putative calls to define genes having single or deep copy loss (i.e. GISTIC call value ) and genes having low-level gains or high-level amplifications (i.e. GISTIC call value ). The differences between groups were formally tested and a total of 3 amplified genes and 18 deleted genes from the lists displayed in tables 3 and 4 have significant p-values 0.05 (Figure 4 and Supplementary Table S6). Interestingly, among those genes we find the well-known glioblastoma oncogene EGFR and tumor suppressors CDKN2A and PTEN, but also novel candidates such as KRIT1 and PAOX described in the previous paragraph. Glioblastoma patients having copy-number alterations for those genes have a worse survival prognostic. This indicates the biological relevance of those genes that may be used as biomarkers.
Availability and future directions
The Lemon-Tree software is hosted at Google Code (http://lemon-tree.googlecode.com/). The source code, executables and documentation can be downloaded with no restrictions and no registration, and are released under the terms of the GNU General Public License (GPL) version 2.0. Developers and users can join the project by contacting the authors and there is a mailing list for discussions and news about module networks and the project. A step-by-step tutorial to learn how to install and use the software is available on the wiki section, together with the corresponding data sets.
In the future, we intend to extend Lemon-Tree’s support for explicitly modelling causal relations between regulator types and to incorporate complementary algorithms available in the literature for integrating gene-based methods, physical interactions and cross-species data. Firstly, the current version of Lemon-Tree is able to associate co-expression modules to multiple ‘regulator’ types (e.g. expression regulators, structural DNA variants, phenotypic states, etc.) by assigning each of those independently as regulators of a module. We will extend the software with Bayesian methods to account for possible causal relations between regulator types, e.g. when the association between a module and expression regulator can be partly explained by a structural DNA variant. Secondly, a key long-term objective of the Lemon-Tree project is to provide a general open-source repository for module network inference tools with a consistent user interface. As a first step, the current version of Lemon-Tree implements algorithms previously developed by our group [14, 15, 16, 17]. In the future, we intend to extend it with complementary algorithms developed by other groups, including algorithms to combine the strengths of module network methods with gene-based methods [18], to incorporate physical protein-protein or protein-DNA interactions as a prior in the regulator assignment procedure [13] or to infer module networks from multiple species simultaneously [19]. A document detailing guidelines to implement new functions in the Lemon-Tree Java codebase is available on the project wiki.
Acknowledgments
This research was supported by Roslin Institute Strategic Grant funding from the BBSRC (TM). The research leading to these results has received funding from the European Community’s Seventh Framework Programme (FP7/2007-2013) under grant agreement number FP7-HEALTH-2010-259348 (ASSET project). EB and LC are members of the team ”Computational Systems Biology of Cancer”, Equipe labellisée par la Ligue Nationale Contre le Cancer.
References
- 1. Hawkins RD, Hon GC, Ren B (2010) Next-generation genomics: an integrative approach. Nature Reviews Genetics 11: 476–486.
- 2. Garraway LA, Widlund HR, Rubin MA, Getz G, Berger AJ, et al. (2005) Integrative genomic analyses identify mitf as a lineage survival oncogene amplified in malignant melanoma. Nature 436: 117–122.
- 3. McLendon R, Friedman A, Bigner D, Van Meir EG, Brat DJ, et al. (2008) Comprehensive genomic characterization defines human glioblastoma genes and core pathways. Nature 455: 1061–1068.
- 4. Hudson TJ, Anderson W, Aretz A, Barker AD, Bell C, et al. (2010) International network of cancer genome projects. Nature 464: 993–998.
- 5. Segal E, Shapira M, Regev A, Pe’er D, Botstein D, et al. (2003) Module networks: identifying regulatory modules and their condition-specific regulators from gene expression data. Nat Genet 34: 166–167.
- 6. Friedman N (2004) Inferring cellular networks using probabilistic graphical models. Science 308: 799–805.
- 7. Lee S, Pe’er D, Dudley A, Church G, Koller D (2006) Identifying regulatory mechanisms using individual variation reveals key role for chromatin modification. Proc Natl Acad Sci USA 103: 14062–14067.
- 8. Zhang W, Zhu J, Schadt EE, Liu JS (2010) A Bayesian partition method for detecting pleiotropic and epistatic eQTL modules. PLoS Computational Biology 6: e1000642.
- 9. Lee SI, Dudley AM, Drubin D, Silver PA, Krogan NJ, et al. (2009) Learning a prior on regulatory potential from eqtl data. PLoS Genetics 5: e1000358.
- 10. Bonnet E, Tatari M, Joshi A, Michoel T, Marchal K, et al. (2010) Module network inference from a cancer gene expression data set identifies microRNA regulated modules. PLoS One 5: e10162.
- 11. Bonnet E, Michoel T, Van de Peer Y (2010) Prediction of a gene regulatory network linked to prostate cancer from gene expression, microRNA and clinical data. Bioinformatics 26: i683–i644.
- 12. Akavia UD, Litvin O, Kim J, Sanchez-Garcia F, Kotliar D, et al. (2010) An integrated approach to uncover drivers of cancer. Cell 143: 1005–1017.
- 13. Novershtern N, Regev A, Friedman N (2011) Physical module networks: an integrative approach for reconstructing transcription regulation. Bioinformatics 27: i177–i185.
- 14. Michoel T, Maere S, Bonnet E, Joshi A, Saeys Y, et al. (2007) Validating module networks learning algorithms using simulated data. BMC Bioinformatics 8: S5.
- 15. Joshi A, Van de Peer Y, Michoel T (2008) Analysis of a Gibbs sampler for model based clustering of gene expression data. Bioinformatics 24: 176–183.
- 16. Joshi A, De Smet R, Marchal K, Van de Peer Y, Michoel T (2009) Module networks revisited: computational assessment and prioritization of model predictions. Bioinformatics 25: 490-496.
- 17. Michoel T, De Smet R, Joshi A, Van de Peer Y, Marchal K (2009) Comparative analysis of module-based versus direct methods for reverse-engineering transcriptional regulatory networks. BMC Syst Biol 3: 49.
- 18. Roy S, Lagree S, Hou Z, Thomson JA, Stewart R, et al. (2013) Integrated module and gene-specific regulatory inference implicates upstream signaling networks. PLoS Computational Biology 9.
- 19. Roy S, Wapinski I, Pfiffner J, French C, Socha A, et al. (2013) Arboretum: reconstruction and analysis of the evolutionary history of condition-specific transcriptional modules. Genome Research 23: 1039–1050.
- 20. Segal E, Sirlin CB, Ooi C, Adler AS, Gollub J, et al. (2007) Decoding global gene expression programs in liver cancer by noninvasive imaging. Nat Biotech 25: 675–680.
- 21. Zhu H, Yang H, Owen MR (2007) Combined microarray analysis uncovers self-renewal related signaling in mouse embryonic stem cells. Syst Synth Biol 1: 171–181.
- 22. Li J, Liu Z, Pan Y, Liu Q, Fu X, et al. (2007) Regulatory module network of basic/helix-loop-helix transcription factors in mouse brain. Genome Biol 8: R244.
- 23. Novershtern N, Itzhaki Z, Manor O, Friedman N, Kaminski N (2008) A functional and regulatory map of asthma. Am J Respir Cell Mol Biol 38: 324–336.
- 24. Amit I, Garber M, Chevrier N, Leite AP, Donner Y, et al. (2009) Unbiased reconstruction of a mammalian transcriptional network mediating pathogen responses. Science 326: 257.
- 25. Vermeirssen V, Joshi A, Michoel T, Bonnet E, Casneuf T, et al. (2009) Transcription regulatory networks in Caenorhabditis elegans inferred through reverse-engineering of gene expression profiles constitute biological hypotheses for metazoan development. Mol BioSyst 5: 1817–1830.
- 26. Novershtern N, Subramanian A, Lawton LN, Mak RH, Haining WN, et al. (2011) Densely interconnected transcriptional circuits control cell states in human hematopoiesis. Cell 144: 296–309.
- 27. Zhu M, Deng X, Joshi T, Xu D, Stacey G, et al. (2012) Reconstructing differentially co-expressed gene modules and regulatory networks of soybean cells. BMC Genomics 13: 437.
- 28. Michoel T, Nachtergaele B (2012) Alignment and integration of complex networks by hypergraph-based spectral clustering. Physical Review E 86: 056111.
- 29. Maere S, Heymans K, Kuiper M (2005) BiNGO: a Cytoscape plugin to assess overrepresentation of gene ontology categories in biological networks. Bioinformatics 21: 3448–3449.
- 30. Jörnsten R, Abenius T, Kling T, Schmidt L, Johansson E, et al. (2011) Network modeling of the transcriptional effects of copy number aberrations in glioblastoma. Molecular Systems Biology 7.
- 31. Maher EA, Furnari FB, Bachoo RM, Rowitch DH, Louis DN, et al. (2001) Malignant glioma: genetics and biology of a grave matter. Genes & Development 15: 1311–1333.
- 32. Beroukhim R, Mermel CH, Porter D, Wei G, Raychaudhuri S, et al. (2010) The landscape of somatic copy-number alteration across human cancers. Nature 463: 899–905.
- 33. Zack TI, Schumacher SE, Carter SL, Cherniack AD, Saksena G, et al. (2013) Pan-cancer patterns of somatic copy number alteration. Nature Genetics 45: 1134–1140.
- 34. Beroukhim R, Getz G, Nghiemphu L, Barretina J, Hsueh T, et al. (2007) Assessing the significance of chromosomal aberrations in cancer: methodology and application to glioma. Proceedings of the National Academy of Sciences 104: 20007–20012.
- 35. Parsons DW, Jones S, Zhang X, Lin JCH, Leary RJ, et al. (2008) An integrated genomic analysis of human glioblastoma multiforme. Science 321: 1807–1812.
- 36. Verhaak RG, Hoadley KA, Purdom E, Wang V, Qi Y, et al. (2010) Integrated genomic analysis identifies clinically relevant subtypes of glioblastoma characterized by abnormalities in PDGFRA, IDH1, EGFR, and NF1. Cancer Cell 17: 98–110.
- 37. Hanahan D, Weinberg RA (2000) The hallmarks of cancer. Cell 100: 57–70.
- 38. Hanahan D, Weinberg RA (2011) Hallmarks of cancer: the next generation. Cell 144: 646–674.
- 39. Yang I, Han SJ, Kaur G, Crane C, Parsa AT (2010) The role of microglia in central nervous system immunity and glioma immunology. Journal of Clinical Neuroscience 17: 6–10.
- 40. Brennan CW, Verhaak RG, McKenna A, Campos B, Noushmehr H, et al. (2013) The somatic genomic landscape of glioblastoma. Cell 155: 462–477.
- 41. Frattini V, Trifonov V, Chan JM, Castano A, Lia M, et al. (2013) The integrated landscape of driver genomic alterations in glioblastoma. Nature Genetics 45: 1141–1149.
- 42. Forbes SA, Bindal N, Bamford S, Cole C, Kok CY, et al. (2011) Cosmic: mining complete cancer genomes in the catalogue of somatic mutations in cancer. Nucleic Acids Research 39: D945–D950.
- 43. Vogelstein B, Papadopoulos N, Velculescu VE, Zhou S, Diaz LA, et al. (2013) Cancer genome landscapes. Science 339: 1546–1558.
- 44. Lawrence MS, Stojanov P, Mermel CH, Robinson JT, Garraway LA, et al. (2014) Discovery and saturation analysis of cancer genes across 21 tumour types. Nature 505: 495–501.
- 45. Belfiore A, Frasca F, Pandini G, Sciacca L, Vigneri R (2009) Insulin receptor isoforms and insulin receptor/insulin-like growth factor receptor hybrids in physiology and disease. Endocrine Reviews 30: 586–623.
- 46. Cheng JM, Hiemstra JL, Schneider SS, Naumova A, Cheung NKV, et al. (1993) Preferential amplification of the paternal allele of the n–myc gene in human neuroblastomas. Nature Genetics 4: 191–194.
- 47. Wüstehube J, Bartol A, Liebler SS, Brütsch R, Zhu Y, et al. (2010) Cerebral cavernous malformation protein ccm1 inhibits sprouting angiogenesis by activating delta-notch signaling. Proceedings of the National Academy of Sciences 107: 12640–12645.
- 48. Guzeloglu-Kayisli O, Kayisli UA, Amankulor NM, Voorhees JR, Gokce O, et al. (2004) Krev1 interaction trapped-1/cerebral cavernous malformation-1 protein expression during early angiogenesis. Journal of Neurosurgery: Pediatrics 100: 481–487.
- 49. Toninello A, Pietrangeli P, De Marchi U, Salvi M, Mondovì B (2006) Amine oxidases in apoptosis and cancer. Biochimica et Biophysica Acta (BBA)-Reviews on Cancer 1765: 1–13.
- 50. Agostinelli E, Arancia G, Dalla Vedova L, Belli F, Marra M, et al. (2004) The biological functions of polyamine oxidation products by amine oxidases: perspectives of clinical applications. Amino Acids 27: 347–358.
- 51. Cho Yj, Liang P (2008) Killin is a p53-regulated nuclear inhibitor of dna synthesis. Proceedings of the National Academy of Sciences 105: 5396–5401.
- 52. Wang Y, Radhakrishnan D, He X, Peehl DM, Eng C (2013) Transcription factor klln inhibits tumor growth by ar suppression, induces apoptosis by tp53/tp73 stimulation in prostate carcinomas, and correlates with cellular differentiation. The Journal of Clinical Endocrinology & Metabolism 98: E586–E594.
- 53. Wang Y, He X, Yu Q, Eng C (2013) Androgen receptor-induced tumor suppressor, klln, inhibits breast cancer growth and transcriptionally activates p53/p73-mediated apoptosis in breast carcinomas. Human molecular genetics : ddt077.
Figure and Tables
| Software | Language | I/O | Source | Data | URL | Year |
|---|---|---|---|---|---|---|
| Genomica | Java | g | no | m | http://genomica.weizmann.ac.il | 2003 |
| Geronemo | Java | g | no | m, e | http://ai.stanford.edu/~koller/index.html | 2006 |
| Lemone | Java/Matlab | c | yes1 | m, mi | http://bioinformatics.psb.ugent.be/software/details/Lemone | 2007 |
| Lirnet | Matlab | c | yes2 | m, e | http://homes.cs.washington.edu/~suinlee/lirnet | 2009 |
| CONEXIC | Java | c | no | m, c | http://www.c2b2.columbia.edu/danapeerlab/html/conexic.html | 2010 |
| PMN | Unix binary | c | no | m, p | http://www.compbio.cs.huji.ac.il/PMN | 2010 |
| ARBORETUM | C | c | yes2 | m-s | http://pages.discovery.wisc.edu/~sroy/arboretum | 2013 |
| MERLIN | C | c | yes2 | m | http://pages.discovery.wisc.edu/~sroy/merlin | 2013 |
| Lemon-Tree | Java | c | yes3 | m, mi, e, c, any | http://lemon-tree.googlecode.com | 2014 |
| Group | Module | Module | Corrected p-value | GO category |
| number | nb of genes | |||
| Cell Cycle | ||||
| 1 | 85 | 9 | cell cycle phase | |
| 2 | cell cycle process | |||
| 6 | mitotic cell cycle | |||
| 11 | 60 | 6 | cell cycle phase | |
| 6 | mitotic cell cycle | |||
| 33 | 36 | 4 | cell cycle phase | |
| 1 | mitotic cell cycle | |||
| Immune response | ||||
| 3 | 145 | 6 | immune response | |
| 6 | immune system process | |||
| 1 | inflammatory response | |||
| 4 | innate immune response | |||
| 14 | 127 | 6 | response to type I interferon | |
| 8 | innate immune response | |||
| 26 | 54 | 7 | defense response | |
| 9 | immune response | |||
| 48 | 37 | 1 | immune system process | |
| Vasculature | ||||
| 27 | 40 | 4 | vasculature development | |
| 2 | blood vessel development | |||
| 7 | angiogenesis | |||
| 37 | 81 | 3 | extracellular matrix organization | |
| 9 | blood vessel development | |||
| Chromatin modifications | ||||
| 70 | 12 | 9 | chromatin assembly | |
| 8 | nucleosome assembly | |||
| 5 | chromatin organization |
Selection of clusters of co-expressed genes from the glioblastoma module network highly enriched for GO categories related to cancer hallmarks. Enriched categories are grouped into broader functional groups. Only a subset of the GO categories are displayed in this table. The full list is available as Supplementary Table 1.
| Symbol | Pathway | Band | Nm | Sum score | % amp. | M-list | P-list |
|---|---|---|---|---|---|---|---|
| CHIC2 | 4q12 | 32 | 5884 | 19 | x | x | |
| EGFR | EGFR signalling | 7p11.2 | 24 | 5184 | 87 | x | x |
| INSR | EGFR signalling | 19p13.2 | 15 | 3918 | 39 | x | x |
| ASAP1 | Membrane cytoskeleton interactions, cell motility | 8q24.21 | 16 | 3119 | 11 | ||
| MYCN | Regulation of transcription | 2p24.3 | 21 | 3028 | 8 | x | |
| C1orf101 | 1q44 | 19 | 2980 | 17 | x | ||
| RHOB | Rho protein signal transduction | 2p24.1 | 19 | 2731 | 7 | ||
| KRIT1 | Small GTPase mediated signal transduction | 7q21.2 | 11 | 2242 | 83 | ||
| CCNE1 | Regulation of cell cycle | 19q12 | 14 | 1980 | 36 | x | x |
| SDCCAG8 | 1q43 | 14 | 1973 | 17 | x | ||
| ADCY8 | Intracellular signal transduction | 8q24.22 | 12 | 1949 | 11 | ||
| PDGFRA | Cell proliferation, signal transduction | 4q12 | 10 | 1874 | 18 | x | x |
| DDX1 | Regulation of translation | 2p24.3 | 16 | 1763 | 8 | ||
| MDM4 | p53 regulation | 1q32.1 | 9 | 1385 | 27 | x | x |
| mir-4283-2 | 7q11.21 | 10 | 1374 | 80 | |||
| PRDM2 | Regulation of transcription | 1p36.21 | 8 | 1323 | 15 | ||
| FGFR3 | Cell growth | 4p16.3 | 5 | 1031 | 8 | x | x |
| SCIMP | Immune response, signal transduction | 17p13.2 | 8 | 1022 | 8 | ||
| GSDMC | Epithelial cell proliferation and apoptosis | 8q24.21 | 8 | 919 | 11 | ||
| COL4A1 | Angiogenesis | 13q34 | 2 | 743 | 5 | x | |
| PIK3CA | Cell signalling, cell growth | 3q26.3 | 7 | 743 | 17 | x |
List of the top 20 amplified genes ordered by decreasing sum of score values. Nm: number of modules in which the gene is selected as a high-scoring regulator. % amp.: percentage of samples in which the gene is classified as low-level gain or high-level amplification (according to GISTIC putative calls). M-list: presence in a list of genes frequently mutated in cancer, compiled from [42, 43, 44]. P-list: presence in a list of genes recurrently amplified or deleted in 11 cancer types [33].
| Symbol | Pathway | Band | Nb modules | Sum score | % del. | M-list | P-list |
|---|---|---|---|---|---|---|---|
| PAOX | Polyamine homeostasis, apoptosis | 10q26.3 | 54 | 7937 | 89 | x | x |
| CDKN2A | Negative regulation of cell proliferation | 9p21.3 | 31 | 4785 | 75 | x | |
| mir-3201 | 22q13.32 | 21 | 3030 | 37 | x | ||
| mir-340 | 5q35.3 | 35 | 3030 | 10 | x | ||
| mir-604 | 10p11.23 | 49 | 2930 | 82 | x | ||
| mir-938 | 10p11.23 | 45 | 2921 | 82 | |||
| C9orf53 | 9p21.3 | 29 | 2897 | 75 | x | ||
| ATAD1 | 10q23.31 | 55 | 2433 | 88 | |||
| KIAA0125 | 14q32.33 | 30 | 2117 | 28 | x | ||
| mir-548q | 10p13 | 35 | 2017 | 81 | |||
| OMG | Cell adhesion | 17q11.2 | 21 | 1697 | 13 | x | |
| EVI2B | 17q11.2 | 19 | 1629 | 13 | x | ||
| KRTAP5-6 | 11p15.5 | 18 | 1564 | 21 | |||
| SRGAP1 | Cell migration | 12q14.2 | 20 | 1397 | 14 | ||
| KLLN | Cell cycle arrest, apoptosis | 10q23.31 | 34 | 1374 | 88 | x | |
| FLT4 | Protein tyrosine kinase signalling | 5q35.3 | 12 | 1022 | 10 | x | |
| EFCAB4A | Metabolic process | 11p15.5 | 33 | 964 | 23 | ||
| HBD | 11p15.4 | 38 | 964 | 20 | |||
| DMRTA2 | Regulation of transcription | 1p32.3 | 28 | 926 | 5 | ||
| TBC1D30 | 12q14.3 | 15 | 791 | 13 | |||
| ART5 | Protein glycosylation | 11p15.4 | 11 | 785 | 21 | ||
| FAM19A5 | 22q13.32 | 4 | 745 | 37 | x | ||
| EVI2A | 17q11.2 | 17 | 709 | 13 | x | ||
| ARID2 | 12q12 | 5 | 681 | 14 | x | ||
| WDR37 | 10p15.3 | 21 | 614 | 81 | |||
| MOB2 | Death receptor signalling | 11p15.5 | 15 | 599 | 23 | ||
| PTEN | EGFR signalling, AKT pathway | 10q23.31 | 19 | 593 | 89 | x | x |
| MUC4 | Cell matrix adhesion, transport | 3q29 | 10 | 588 | 11 | ||
| IDI1 | Isoprenoids synthesis | 10p15.13 | 23 | 569 | 81 | ||
| CSMD1 | 8p23.2 | 8 | 566 | 12 | x | ||
| CDKN2B | Negative regulation of cell proliferation | 9p21.3 | 19 | 565 | 75 | x |
List of top 30 deleted genes ordered by decreasing sum of score values. % del.: percentage of samples in which the gene is classified as single-copy loss or deep loss (according to GISTIC putative calls). Nm, M-list and P-list: see Table 3.
Appendix A Supplementary methods
Tight clustering algorithm
Lemon-Tree uses a tight clustering step to extract consensus modules from an ensemble of clustering solutions. A novel spectral edge clustering algorithm [28] was implemented in Lemon-Tree for this purpose. This algorithm proceeds as follows:
Pre-processing
First, let be the cluster assignment matrix for the th ganesh run, i.e. is an matrix where is the number of genes and the number of clusters in the th run such that
Ganesh clusters are non-overlapping and all genes belong to a cluster, i.e. for all . Next, an co-clustering matrix for the th run is defined as
is obtained from via the matrix multiplication
Averaging over all runs gives the co-occurence frequency matrix
Entries of close to 1 represent pairs of genes which robustly cluster together irrespective of the stochastic fluctuations introduced by the ganesh Gibbs sampling algorithm, whereas entries close to represent noisy relations between gene pairs accidentally clustering together by random chance. We convert to a sparse weighted adjacency matrix by choosing a threshold and setting
In our experience, thresholds in the range produce suitably sparse graphs while retaining all information about robust gene pairings. The default value is set to .
Spectral clustering
Tight clusters are defined as subsets of genes with a high total edge weight in the thresholded co-occurence frequency graph, as expressed by a score function
where denotes the number of elements in . The spectral edge clustering algorithm iteratively searches for the set which (approximately) maximizes , removes from the graph, and repeats the procedure until no more edges remain. Specifically:
-
1.
Calculate the dominant eigenvector corresponding to the largest eigenvalue of ; is normalized to have , and by the Perron-Frobenius theorem, all its elements are positive .
-
2.
Find the set for which the vector with components for and otherwise is as similar as possible to , more precisely
Since all , must be of the form for some threshold value and is easily found.
-
3.
Store and perform one of two alternatives
-
(a)
(Node clustering) Remove all nodes in from the graph, i.e. set
-
(b)
(Edge clustering) Remove all edges in from the graph, i.e. set
-
(a)
-
4.
Repeat until .
The solution for in step 2 is an approximation to the real solution . However, because the dominant eigenvector maximizes the quantity
over all possible choices of vectors , including vectors of the form , it can be shown that the approximate solution is in some sense optimal. More precisely, the quantity maximized by provides an upper bound to the (unknown) maximum value and numerical simulations on a variety of graphs have shown that the score of the approximate solution is always close to the upper bound, and therefore also to the true maximum. For more details, see [28].
Removal of nodes [step 3(a)] implies that every gene can belong to only one tight cluster whereas removal of edges [step 3(b)] results in possibly overlapping tight clusters. In module network applications, we always apply node clustering, because only non-overlapping clusters can be given a statistical interpretation in the form of an underlying Bayesian network model.
Post-processing
The spectral clustering algorithm runs until all edges in the thresholded co-occurence frequency graph have been removed, but not all clusters found represent well-supported tight clusters, particularly towards the end of the algorithm when tight clusters will consist of very few nodes and edges. We therefore apply a post-processing step whereby clusters that are too small or have too low value for the score function are removed. The default values are to keep all tight clusters with minimum size of 10 genes and score value (i.e. weighted edge to node ratio) of 2. As a result, some genes may not belong to any tight cluster and are discarded from any subsequent analysis.
Benchmark between Lemon-Tree and CONEXIC
We downloaded gene expression and copy number glioblastoma datasets from the Cancer Genome Atlas (TCGA, [3]) data portal and we selected a set of 250 samples that were matched for copy number and gene expression data. We built a matrix of gene expression ratios (normal/disease) and discarded genes having a flat profile (standard deviation <0.25), keeping a total of 9,367 genes. To build a list of candidate regulators, we applied the program JISTIC on copy-number profiles to determine genes that were significantly amplified or deleted in the samples (with a default q-value cutoff of 0.25), and we selected the top 1,000 genes for each category as input for the candidate regulators for both CONEXIC and Lemon-Tree.
To run CONEXIC, we followed the instructions of the manual and more specifically used the recommended bootstrapping procedure to get robust results. For the Single Modulator step (initial grouping of genes into modules), we performed 100 bootstrap runs, with 10,000 permutations each. We selected the regulators that appear in at least 90% of the runs for the final Single Modulator run. We also performed 100 bootstrap runs for the Module Network step (learning the modulators that best fit the data and improving the grouping of genes into modules). We selected regulators appearing in at least 40% of the bootstrap files for the final Module Network run. The final network was composed of 281 modules and 6,292 genes.
For Lemon-Tree, we generated 150 two-way clustering solutions that were assembled in one robust solution by node clustering (minimum weight 0.33), resulting in a set of 257 clusters composed of 5,354 genes. Then we assigned the regulators using the same input list as with CONEXIC, with 10 hierarchical trees for each module. A global score was calculated for each regulator and for each module and we selected the top 1% regulators as the final list.
The GO enrichment for the CONEXIC and Lemon-Tree clusters were calculated using the built-in tool of the Lemon-Tree software package, which is based on the BiNGO Java library. The same list of reference genes, GO ontology file and annotation file were used for the two sets (see the latest version for the gene ontology file at http://geneontology.org/page/download-ontology, and the latest version for human gene association file at http://geneontology.org/page/download-annotations). To compare the GO categories between Lemon-Tree and CONEXIC, we built a list of all common categories for a given p-value threshold and converted the corrected p-values to converted the corrected p-values to (p-value) scores. We selected the highest score for each GO category and we counted the number of GO categories having a higher score for Lemon-Tree or CONEXIC, and calculated the sum of scores for each GO category and each software.
We downloaded all the human protein-protein interactions (PPI) from Reactome, Intact and HPRD through the Pathway Commons portal. The resulting network was composed of 9,599 genes and 168,117 interactions. We calculated the shortest paths between all pairs of genes in the network, using Dijkstra’s algorithm from the JUNG library (http://jung.sourceforge.org). Interaction distances can be defined as the number of steps needed to ’walk’ from one gene to another.
For a network and interaction distance , we followed [30] and calculated the enrichment ratio (as a relative proportion) as:
where is the shortest path length in the PPI network between nodes and , and was generated by random permutations of the non-diagonal elements (network edges).
Integrative analysis of TCGA glioblastoma expression and copy-number data
We downloaded data from the Cancer Genome Atlas project portal (TCGA [3]) and we selected 484 glioblastoma tumor samples from different patients, matched for mRNA expression and copy-number data. The expression data was composed of a total of 12,042 genes. We selected genes differentially expressed (ttest p-value 0.05, Benjamini-Hochberg correction, all calculations done with R) compared to normal tissue samples. We excluded genes having flat profiles (standard deviation 0.3), resulting in an expression matrix of 7,574 genes that was centered, scaled and taken as input for Lemon-Tree. We generated 127 two-way clustering solutions that were assembled in one robust solution by node clustering (minimum weight 0.33, minimum size 10, minimum score 2), resulting in a set of 121 clusters composed of 5,423 genes (median cluster size of 34 genes, see complete list of genes and clusters in supplementary table S1).
We assembled a list of genes amplified and deleted in glioblastoma tumors from the most recent GISTIC run of the Broad Institute TCGA Copy Number Portal on glioblastoma samples (http://www.broadinstitute.org/tcga/home). GISTIC [34] is the standard software tool used for the detection of peak regions significantly amplified or deleted in a number of samples from copy-number profiles. We also included in the list a number of key genes amplified or deleted from previous studies [35, 36, 34]. The final list is composed of 353 amplified and 2,007 deleted genes (with all genes present on sex chromosomes excluded). To build the copy-number matrix profiles, we downloaded the segmented data (level 3 files) corresponding to Affymetrix Human SNP Array 6.0 hybridizations for all glioblastoma samples, and mapped all genes and miRNAs to the segments in each sample. Each gene is then assigned the copy-number value corresponding to the segment in which it is located or a missing value if there is no segment corresponding to the location of the gene. All the profiles were centered and scaled and used to infer the regulation programs. We assigned regulators independently for amplified and deleted genes lists, and we selected the top 1% highest scoring regulators as the final list (a cutoff well above assignment of regulators expected by chance), with 92 amplified and 579 deleted selected genes (see supplementary tables S2 and S3).