11email: koenig@iram.fr 22institutetext: Chalmers University of Technology, Department of Earth and Space Sciences, Onsala Space Observatory, 43992 Onsala, Sweden33institutetext: Department of Astronomy, University of Wisconsin, 475 N. Charter Street, Madison, WI, 53706, USA44institutetext: University of Manchester, Jodrell Bank Centre for Astrophysics, Oxford Road, Manchester, M13 9PL, UK55institutetext: Harvard-Smithsonian Center for Astrophysics, 60 Garden Street, Cambridge, MA, 02138, USA66institutetext: Astronomisches Institut Ruhr-Universität Bochum, Universitätsstraße 150, 44780 Bochum, Germany
Molecular tendrils feeding star formation in the Eye of the Medusa
Studying molecular gas properties in merging galaxies gives us important clues to the onset and evolution of interaction-triggered starbursts. NGC 4194 (the Medusa merger) is particularly interesting to study since its FIR-to-CO luminosity ratio rivals that of ultraluminous galaxies (ULIRGs), despite its lower luminosity compared to ULIRGs, which indicates a high star formation efficiency (SFE) that is relative to even most spirals and ULIRGs. We study the molecular medium at an angular resolution of 0.65′′ 0.52′′ (120 98 pc) through our observations of 12CO 21 emission using the Submillimeter Array (SMA). We compare our 12CO 21 maps with optical Hubble Space Telescope and high angular resolution radio continuum images to study the relationship between molecular gas and the other components of the starburst region. The molecular gas is tracing the complicated dust lane structure of NGC 4194 with the brightest emission being located in an off-nuclear ring-like structure with 320 pc radius, “the Eye of the Medusa”. The bulk CO emission of the ring is found south of the kinematical center of NGC 4194. The northern tip of the ring is associated with the galaxy nucleus, where the radio continuum has its peak. Large velocity widths associated with the radio nucleus support the notion of NGC 4194 hosting an AGN. A prominent, secondary emission maximum in the radio continuum is located inside the molecular ring. This suggests that the morphology of the ring is partially influenced by massive supernova explosions. From the combined evidence, we propose that the Eye of the Medusa contains a shell of swept up material where we identify a number of giant molecular associations (GMAs). We propose that the Eye may be the site of an efficient starburst of 5-7 M yr-1, but it would still constitute only a fraction of the 30-50 M yr-1 star formation rate of the Medusa. Furthermore, we find that 50% of the molecular mass of NGC 4194 is found in extended filamentary-like structures tracing the minor and major axis dust lanes. We suggest that molecular gas is transported along these lanes providing the central starburst region with fuel. Interestingly, a comparison with locations of “super star clusters” (SSCs) reveal that the molecular gas and the SSCs are not co-spatial.
Key Words.:
galaxies: evolution – galaxies: individual: NGC 4194 – galaxies: starburst – galaxies: active – radio lines: ISM – ISM: molecules1 Introduction
The focus on merger studies often lies on major-major (equal mass spirals) mergers and their evolution, although minor (unequal-mass)
mergers constitute the major phase of interactions in the local Universe and at higher redshifts. Understanding how the gas is feeding
starburst and AGN activities in these objects is therefore paramount in understanding the overall evolution of the Universe. In a
numerical simulation study of minor- or intermediate mergers, Bournaud et al. (2005) found that the gas brought in by the disturbing companion
galaxy is generally found at large radii in the merger remnant. The gas returns to the system from tidal tails and often forms
rings - polar, inclined or equatorial – that will appear as dust lanes when seen edge-on (e.g., Combes 1988; Shlosman et al. 1989).
Evidence has been presented for an increased fraction of star formation happening in clusters within starbursts that are compared to that
in quiescent galaxies, which potentially are linked to the interstellar medium (ISM) structure changes, while the starburst process takes
place (Kennicutt & Evans 2012). Massive, young star clusters (super star clusters (SSCs), 105 - 108 M) are observed to
form in on-going starbursts, such as those associated with interactions and (minor and major) mergers and those in smaller numbers in
other types of galaxies with elevated star formation rates (SFR; e.g., Larsen 2002; de Grijs et al. 2003; Mora et al. 2009).
A nearby example of a surprisingly efficient starburst is the inner 2 kpc of the Medusa merger (NGC~4194). With a
luminosity of LFIR = 8.5 1010 L (at D = 39 Mpc, 1′′ = 189 pc), this E+S minor merger is
an order of magnitude fainter than well known ULIRGs, such as Arp~220 (Aalto & Hüttemeister 2000; Manthey et al. 2008). Despite the moderate FIR
luminosity, NGC 4194 has a LFIR/LCO ratio similar to those typical for ULIRGs, which suggests that its star formation
efficiency (SFE) rivals that of the compact ULIRGs. Despite this, its CO/HCN 10 luminosity ratio is 25, indicating that the
fraction of dense gas is significantly lower despite the similar SFE to ULIRGs. The picture becomes even more interesting when one
considers that most of the ongoing star formation in NGC~4194 is not traced by the FIR or radio emission: The H SFR is
40 M yr-1 (Hancock et al. 2006), while the FIR estimated SFR is 6-7 M yr-1. The spatial correlation between
the molecular gas distribution and the 1.4 GHz continuum is also poor (unlike the case for most nearby galaxies, Aalto & Hüttemeister 2000). In
NGC~4194, a large fraction of the star formation is going on in super star clusters with a kpc-scale distribution, which is
separated from the molecular gas distribution. No obvious correlation between these young SSCs (5-15 Myr) and the CO can be found.
The CO emission also traces the two prominent dust lanes that cross the central region and extends into the northern tidal tail. The
majority of the CO (70, 12CO, Aalto et al. 2001; Lindroos 2011) is found in the central 2 kpc of the galaxy with 15 of this
gas (13CO, Aalto et al. 2010), which resides in a compact region 1.5′′ south of the radio nucleus. The knots where
the optically traced star formation is going on only occasionally correlate with the radio continuum or the molecular distribution.
Throughout the paper, we are concerned with pure rotational transitions in CO between upper state = 2 and lower state = 1
that are labeled 21.
In this paper, we present a study of the molecular gas close to the AGN in the Medusa merger. In Sect. 2, we
describe the observations and data reduction; Sect. 3 reports on the results of the observations. The discussion follows
in Sects. 4 and 5, and conclusions are drawn in Sect. 6.
2 Observations
NGC~4194 was observed with the SubMillimeter Array (SMA) on February 21, 2010 in the very-extended configuration and on April
8 in the compact configuration, which provides the highest angular resolution CO observations of NGC 4194 to date. For analysis
purposes, we shifted the phase center to the position of the 1.4 GHz radio continuum peak at =12:14:09.660 and
=+54:31:35.85 (J2000, Beswick et al. 2005). The heterodyne receivers were tuned to the redshifted frequency of the
12CO 21 transition at 228.63 GHz in the upper sideband, while the 13CO 21 transition was observed in the lower
sideband. With baseline lengths between 38 m and 509 m, these SMA imaging data are sensitive to scales smaller than 16.5′′.
The correlator was configured to provide a spectral resolution of 0.8125 MHz (corresponding to a velocity resolution of
1.1 km s-1). The bright quasars J0854+201 and 3C454.3 were used as bandpass calibrators; Vesta
and Ganymede were observed as primary flux calibrators, and we regularly observed the close-by quasars J1153+72,
J0927+390, and J0721+713 for complex gain calibration.
After calibration within the dedicated MIR/IDL SMA reduction package, both visibility sets were converted into FITS format and imported
in the GILDAS/MAPPING111http://www.iram.fr/IRAMFR/GILDAS and AIPS packages for further imaging.
For the 12CO 21 data, sets of visibilities from the compact and very extended configuration observations were combined and
deconvolved using the Clark method (Clark 1980) with robust weighting. This results in a synthesized beam size of
0.65′′ 0.52′′ with a position angle (PA) of 67∘. We smoothed the data to a velocity resolution of
25 km s-1, which yields a 1 rms noise level per channel of 6.8 mJy beam-1. To look at the most
compact component in the CO distribution, we used robust weighting, putting additional weight on the longest baselines, resulting
in a 0.43′′ 0.38′′ beam with a position angle of 52∘. This provides a very high resolution map in which we look
for giant molecular associations (GMAs).
To compare our results with high resolution images of the radio continuum structure of NGC 4194, we obtained 1.4 GHz radio
continuum data at the VLA (Jütte et al., in prep.) and combined them with published data from Beswick et al. (2005). These combined data have
an angular resolution of 0.50′′ 0.52′′ corresponding to a linear scale of 95pc 98pc.
3 Results
3.1 12CO 21
3.1.1 Integrated intensity
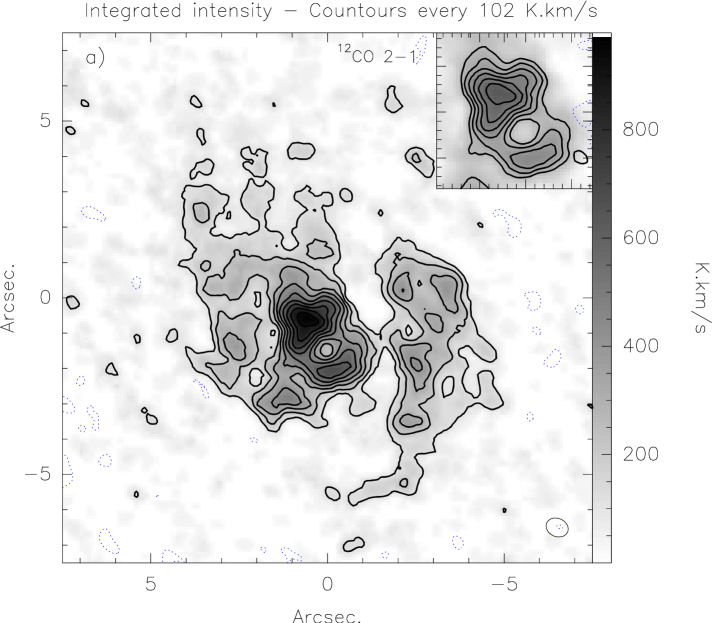
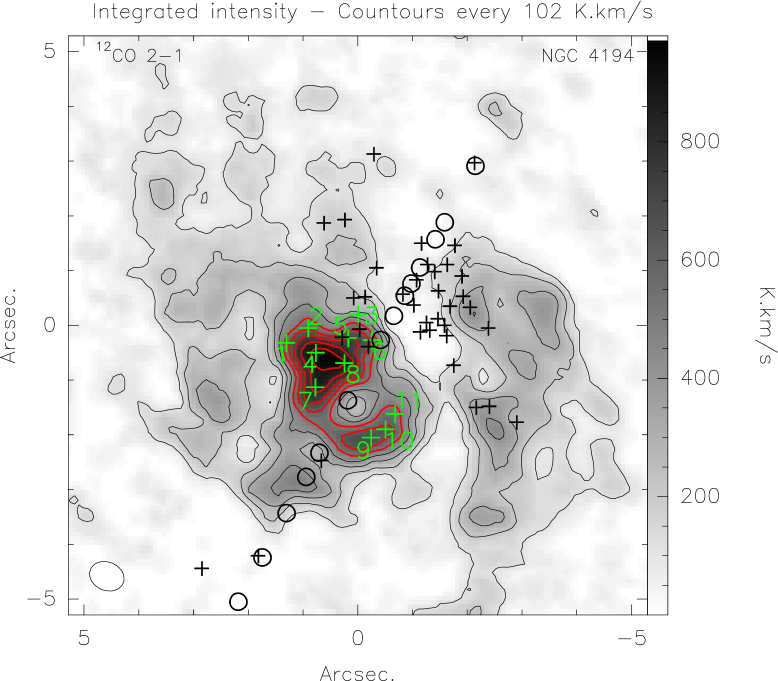
The integrated intensity map (Fig. 1a) shows an asymmetric CO 21 distribution in the east-west direction. The eastern
part contains the peak of the CO emission at about 1-1.5′′ southeast of the radio continuum peak, which is located in the northern
part of a ring-like structure or possibly tightly wound spiral arms, with a maximum extent of 4′′ that has no CO emission
peak at its center (Fig. 1a).
The total CO 21 flux within the 2 contours (see Fig. 1a) amounts to 411.0 4.1 Jy km s-1. A
comparison of the total CO 21 flux within the inner 13′′ of NGC 4194 obtained from single-dish observations Casoli et al. (1992) shows
that we recover approximately 50% (642 Jy km s-1) of the flux with our SMA observations. Our high-resolution data are
sensitive to structures smaller than 16.5′′ (see Sect. 2), hence 50% of the flux seems to be associated with
structures larger than this size. Approximately one third of the total flux is located in the east of the ring-like structure
(128.3 4.5 Jy km s-1) and one fourth (Sν = 103.7 2.7 Jy km s-1) in the elongated
western part of the CO 21 distribution.
Casoli et al. (1992) show the integrated intensity of CO 21 to be 80% of that of CO 10. Thus, we can scale our CO 21 flux by this
amount to obtain an estimated CO 10 flux for our observations. Assuming a CO-to-H2 conversion factor of
= 2.0 1020 cm-2 (K km s-1 (Narayanan et al. 2012; Sandstrom et al. 2013)222We will study
the influence of the distribution of molecular gas on through different molecular transitions in paper II (König et al. in
prep.)., this then translates to a mass of 1.6 109 M for the overall CO 21 molecular gas
distribution. The molecular gas in the ring sums up to a mass of 4.1 108 M.
3.1.2 Kinematics of the 12CO 21 gas
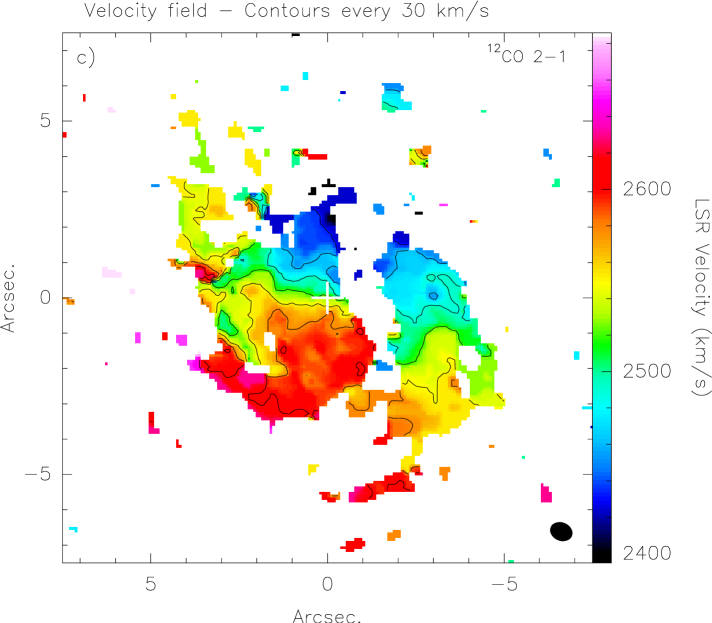
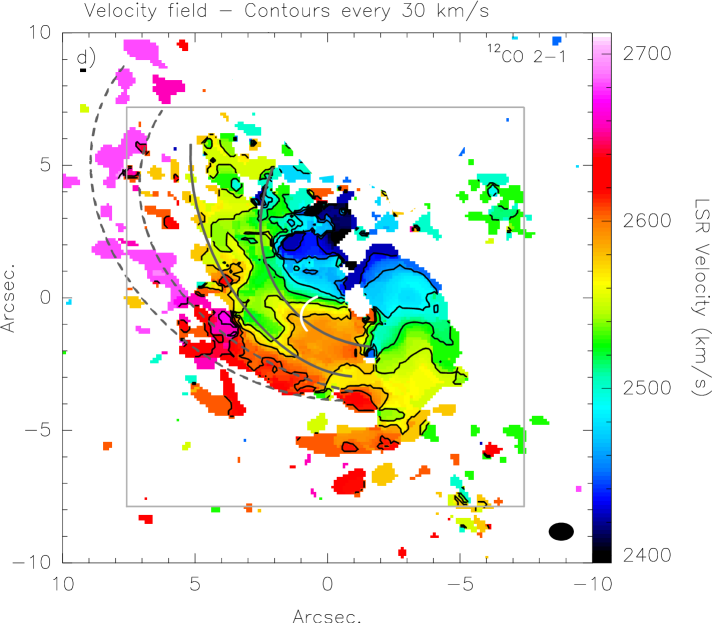
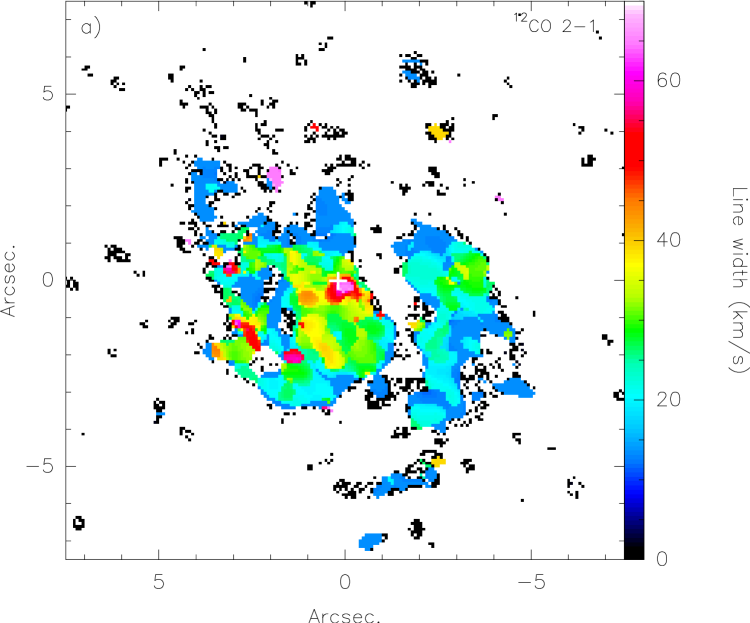
Figs. 1c, d, and 2 show the velocity field and the velocity dispersion of the CO 21
emission in NGC 4194. The velocity fields (Figs. 1c, d) show a rather regular pattern for the main body of the
molecular emission, which is typical for solid body rotation, with a position angle of -20∘ in which the velocities range from
2400 km s-1 to 2700 km s-1. The contours of the velocity field in the western component of the molecular gas
emission, which we call the “western arm”, deviate from the typical solid-body rotation pattern. These deviations could be indicators
for streaming motions, as found in other galaxies, such as in M 51 and NGC 5248 (Aalto et al. 1999; van der Laan et al. 2013). Aalto & Hüttemeister (2000) have shown that
molecular gas is associated with the dust lanes that cross NGC 4194 in front of the main body. The velocities of this gas emission are
almost constant across large distances along the way to the center. This behavior changes just before the gaseous material turns into the
plane of the merger (see, e.g., the most eastern CO associated with the eastern dust lane,as seen in Fig. 1c). This seems
to be true as well for the dust lane located further west and closer to the center of NGC 4194.
The velocity dispersion distribution in the Medusa (Fig. 2a) shows the most prominent peak at the
position of the radio continuum peak (Beswick et al. 2005) with a line dispersion roughly twice the size than in the rest of the CO distribution.
The line dispersion at this peak rises to about 70 km s-1 compared to the surrounding material where the dispersion lies
between 15 km s-1 and 35-40 km s-1.
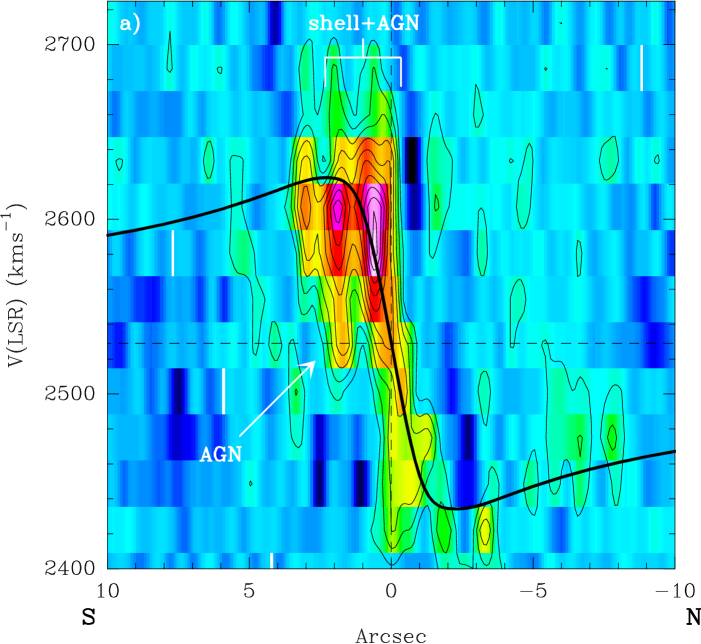
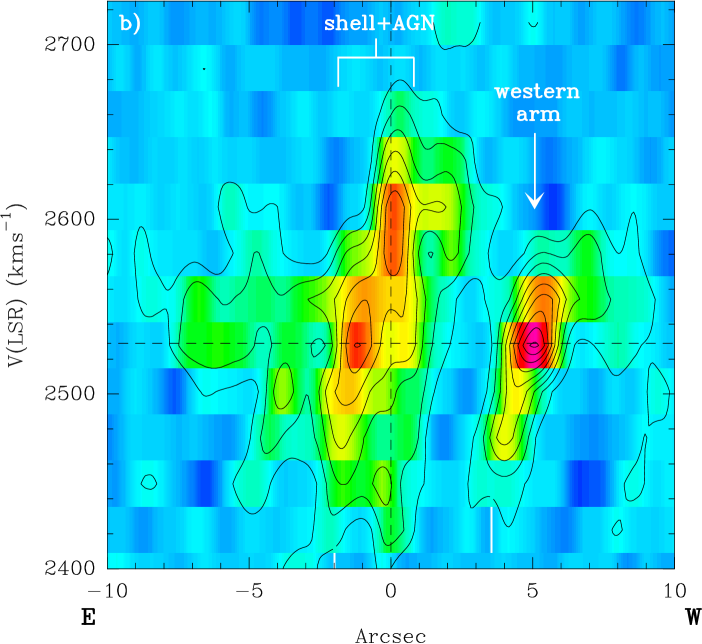
The position-velocity diagrams along the major (north to south, left panel) and the minor (east to west, right panel) axes are
shown in Fig. 3. Both pv diagrams were obtained by averaging over slits with a width of 1′′ with one positioned
along the axis of solid-body rotation and the other perpendicular to that direction. Both slits do include emission from parts of the
molecular ring-like structure. In the major axis pv diagram (Fig. 3a), the pattern of the rather smooth solid-body
rotation, especially when considering the merger history, already seen in the velocity field (Figs. 1c, d) has been
reproduced. The two most distinctive peaks in this distribution represent the structure of the ring-like gas component at the center of
NGC 4194. The minor axis pv diagram (Fig. 3b) shows two distinct components in the distribution: one molecular emission
peak with a steep velocity gradient across a few arcseconds in the west and two distribution peaks close to the nucleus. The feature with
the steep velocity gradient originates from gas in the same location that already showed an exceptional behavior in the velocity field
(Figs. 1c, d) in the western arm. This might hint toward the presence of streaming motions in the western arm. The second
component close to the nucleus represents the gas in the ring-like structure by showing a difference in velocity for the different
locations in this structure.
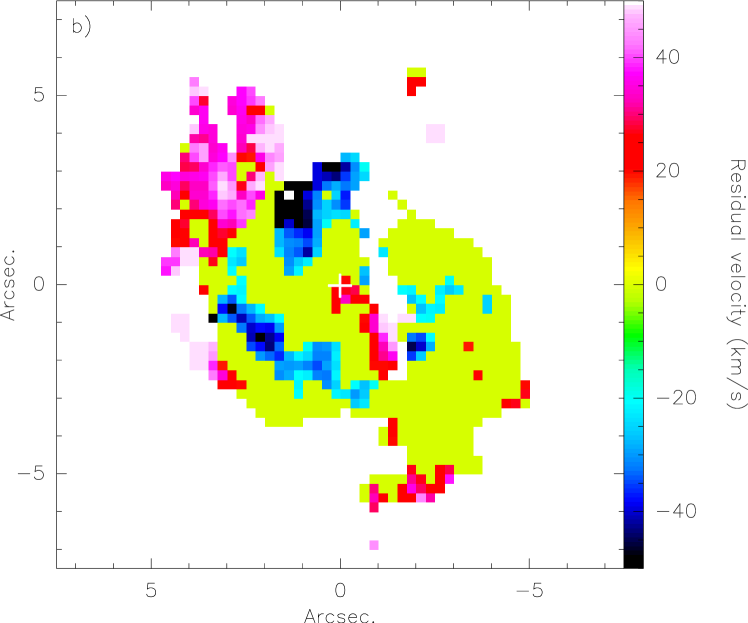
The rotation curve: We fitted a Brandt curve (Eq. 1, Brandt 1960) to the velocity field of the molecular
emission using a fixed inclination value of 40∘ (from the optical isophotes, Aalto & Hüttemeister 2000). The result is shown in
Fig. 3a with the pv diagrams for the major and minor axes. The fitted rotation curve starts to flatten (fall) at a
radius Rmax of 2.3′′, which indicates a deprojected rotational velocity vrot of 148 km s-1. The
dynamical mass inferred from these values is Mdyn 2.2 109 M. A plot of the residuals after
subtracting the fit from the velocity field is presented in Fig. 2b. There, the residuals in the western
arm again illustrate the presence of typical features of streaming motions in this location. We cannot draw clear conclusions whether or
not some type of streaming motion is also going on in the eastern part of the molecular emission as well due to the likely overlap of
different structures and processes taking place there.
| (1) |
3.2 The Eye of the Medusa
Figs. 1a and b show a top-heavy ring-like structure, where the majority of the molecular mass is located in the northern
part of the structure. This structure dominates the CO 21 emission in the eastern part of NGC 4194, which is close to its center. We
determined the ring-like structure to have a molecular mass of 4.1 108 M (corresponding to one third
of the total CO 21 mass in these data), enclosed in a radius of 1.7′′ (equivalent to 320 pc) with a width of
1.5′′ (285 pc) in the northern part of the ring and a width of 0.9′′ (170 pc) in the south. The nucleus of
NGC 4194 is located at the northern tip of the ring, while the bulk emission of the ring is located south of the kinematical center in
a molecular shell or bubble. In contrast to 1.4 GHz radio continuum observations (Fig. 6, Beswick et al. 2005),
where a secondary peak is located at the center of the ring, the CO 21 does not show a clear emission peak at its center. This
structure was named the Eye of the Medusa (Lindroos 2011).
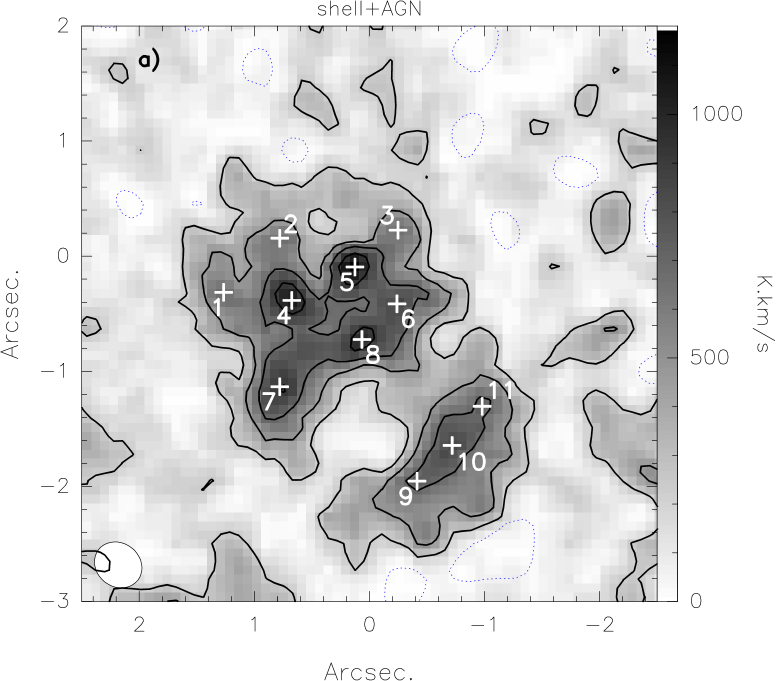
The CO 21 emission distribution of the Eye, shows “hot spots” of enhanced 12CO 21 intensity
(Fig. 5). The mass estimates of some of those clumps place them in the mass range for giant molecular associations
(GMAs, Table 1, Vogel et al. 1988). We identified GMA candidates as peaks (peak values larger than three times the
noise level) in the integrated CO 21 map and with a clear detection ( 5) in the spectrum. The spectra were obtained
by averaging over an area of 5 5 pixels around the peak. This resulted in the identification of 11 GMA candidates. How many of
these candidates are real is an issue that can only be solved by higher resolution, high-sensitivity observations. The molecular
properties of the Eye are discussed in Sect. 4.
4 Molecular structure of NGC 4194
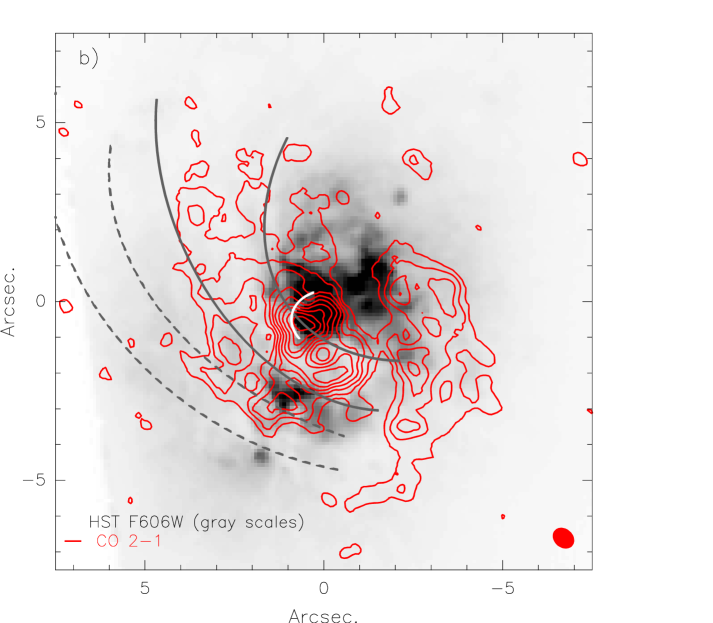
Two major dust lanes to the east of the nucleus, which are visible in the optical (e.g., HST, Fig. 1b), cross the main
optical body of NGC 4194. The one crossing directly below the galaxy’s dynamical center is associated with large parts of the molecular
gas. The second dust lane further to the east crosses further south of the nucleus. The molecular gas is clearly associated with both
dust lanes tracing filamentary-like features (see the lower resolution velocity field in Fig. 1d). The CO emission in the
northeast stretching out toward these dust lanes appears filamentary. The western part of the CO distribution with a north-south
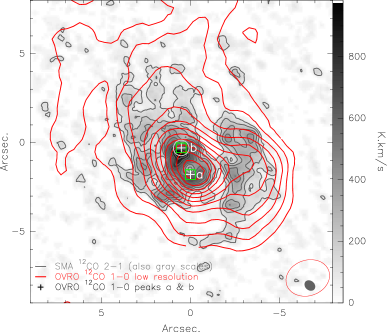
orientation agrees well with peaks c and d found by Aalto & Hüttemeister (2000) in their CO 10 data (see Fig. 7).
There seems to be a gap in the CO distribution between the molecular gas in the east and the west, apart from a small connection between
the two parts with a width of 1′′. Within the asymmetric CO 21 emission distribution, the ring-like structure, the Eye of
the Medusa, shows hot spots of enhanced 12CO 21 intensity (Fig. 5). A more detailed discussion of these
features can be found in Sect. 4.2.
Connected to the CO in the Eye seems to be a gas component that shows the highest velocity dispersion at the 1.4 GHz radio continuum
peak found by Beswick et al. (2005). A weak AGN component might be present at this position in the center of NGC 4194. This is discussed in more
detail in Sect. 4.1.
Observations of different star formation tracers have been reported covering the larger scale structures associated with the CO 10
observations and the dust lanes down to the region surrounding the nucleus of NGC 4194. Weistrop et al. (2004) and Hancock et al. (2006) found a number of
stellar clusters in the UV and visible light (VIS, see, e.g., Figs. 8,
9). The majority of these clusters does not seem to be closely associated with the molecular gas. Indeed,
most of these clusters are positioned in a void of molecular gas between the eastern and western parts in the CO 21 emission. For
further details, see Sect. 4.3.
In Sect. 5.1, we compare the properties of NGC 4194 to other minor mergers and, in
Sect. 5.2, we compare our results for NGC 4194 with galaxies that harbor molecular shells and blowouts.
4.1 The AGN
Several indicators speak in favor of the presence of an AGN in NGC 4194, even if it might be weak. X-ray and [Ne V] 14.3 m line
observations have shown the possibility for the presence of a small AGN contribution to the energy output of NGC 4194. Kaaret & Alonso-Herrero (2008) and
Lehmer et al. (2010) suggest the presence of an AGN in the nucleus based on their 210 and 28 keV point source identifications and nuclear
count rates. Spitzer observations of the [Ne V] 14.3 m line yielded detections for Bernard-Salas et al. (2009) and Lehmer et al. (2010) which leads them
to conclude the presence of a weak AGN being located in NGC 4194.
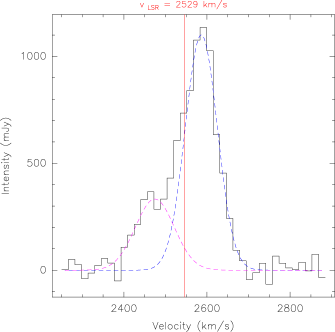
Spectra taken of the Eye from the high resolution data (0.43′′ 0.38′′) show a double-peaked velocity
distribution (Fig. 4) with velocity components centered at 2600 km s-1 and at
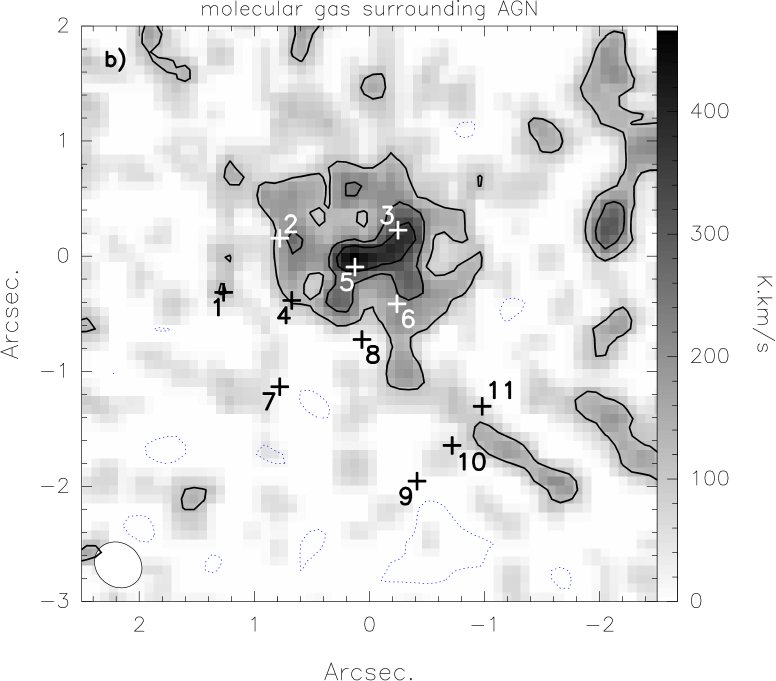
2450 km s-1. The latter component is only present in the region closest to the AGN (GMAs 3, 5 & 6). The gas mass
determined from this velocity component is 4.4 107 M. Isolating this velocity component and
making an integrated intensity map confirms that this gas is only present in the northern part of the central high density gas complex
(Fig. 5b). The total gas mass surrounding the AGN (both CO velocity components) results to
1.1 108 M. The dynamical mass enclosed in this region is
5.0 108 M. With their HI absorption observations, Beswick et al. (2005) were able to put a limit on the
dynamical mass of the central nuclear region of 2 109 M, which is in good agreement with the
results from this work. This CO 21 complex is located at the unresolved center of the larger scale molecular gas reservoir in
NGC 4194 (CO 10, see Fig. 7, Aalto & Hüttemeister 2000).
Speaking against the presence of an AGN, however, are the findings from Beck et al. (2014). Their radio continuum and [Ne ii]
observations indicate the compact radio emission sources in NGC 4194 to be dense stellar clusters.
4.2 The structure of the Eye
The highest surface brightness CO 21 emission emerges in a ring-like structure south of the nucleus (Fig. 5b) -
the Eye of the Medusa. The molecular gas in this complex seems to be connected to the 1.4 GHz radio continuum peak, which possibly marks
the position of a weak AGN. Most of the gas, however, is associated with the eastern dust lane that comes in closest to the galactic
center (Fig. 1). The center of the Eye is not located at the dynamical center of NGC 4194, as determined from the
rotation curve (see Sect. 3.1.2). The location of the possible AGN in the northwestern part of this structure agrees
with the center coordinates. This implies that this structure might not have been formed from purely dynamical processes (e.g.,
orbit crowding, resonances).
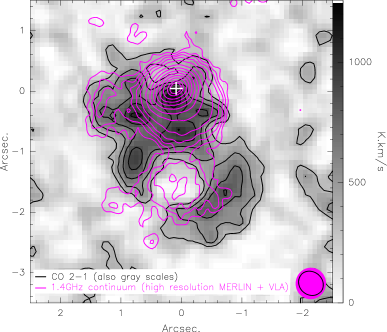
In Figs. 5 and 6 we show that there is a “hole” in the CO emission. Located right at
the center of that hole is a secondary 1.4 GHz radio continuum peak (Fig. 6, see also Beswick et al. 2005). The
radio continuum very nicely traces the peak of the gas in the northern part of the Eye but it seems to avoid gas in the southern part:
the radio continuum peaks at the center of the structure where there is no CO, but most of the southern part of the CO in this region is
not traced by the 1.4 GHz emission as is GMA 7 in the north. The radio continuum associated with GMA 8 most likely spills over from the
peak at the AGN position.
The fact that the CO depression in the south of the ring-like structure corresponds to a secondary peak in the 1.4 GHz emission and the
maximum in HI absorption against the continuum (Beswick et al. 2005), suggests that the hole in the CO 21 distribution might be a shell or
bubble in the molecular gas caused by a massive explosion of supernovae (SNe). The funneling of the gas to the very center of NGC 4194
leeds to a burst of star formation in the central molecular gas. Subsequently, supernovae explode and the energy freed by the SNe going off drove the molecular gas outwards, which is away from the center of the explosion, thereby shaping the central molecular gas reservoir
to the observed morphology: the expansion of the shell/bubble causes a spherical gas pile-up at the shock fronts, where new star
formation is triggered and pinpoints the interaction between the accelerated shell/bubble material and the surrounding ISM. The result is
the Eye of the Medusa, the molecular ring-like structure with a shell or bubble that we observe in the CO 21 emission.
| (2) |
To derive the energy output necessary for the formation of the shell/bubble with the properties we observe in our CO 21 data, we
applied Chevalier’s equation (Eq. 2, Chevalier 1974). Using a hydrogen number density of the surrounding pre-bubble
medium of 59 cm-3 (value determined from the density and volume of the surrounding gas not yet influenced by the expansion
of the shell), a radius of 180 pc (the inner radial expansion of the shell material), and an expansion velocity of 55 km s-1
(from the pv diagram), we derive an energy output of 1.4 1055 ergs, which is the equivalent of 10 000 SNe of
type II. We derived the kinematical age, using where is the radius of the shell or bubble,
is the expansion velocity, and is a parameter to account for nonlinear expansion. We assume to be 0.5, a
value in the middle of the range of possible values (Sakamoto et al. 2006). Due to the uncertainty in the assumption of , we expect an
uncertainty in the time estimate of a factor of 2. Hence, the kinematical age for the shell in NGC 4194 is
1.6 106 yr, and the supernova rate thus amounts to 6 10-3 SN yr-1. A
comparison to other galaxies hosting shells/bubbles is discussed in Sect. 5.2.
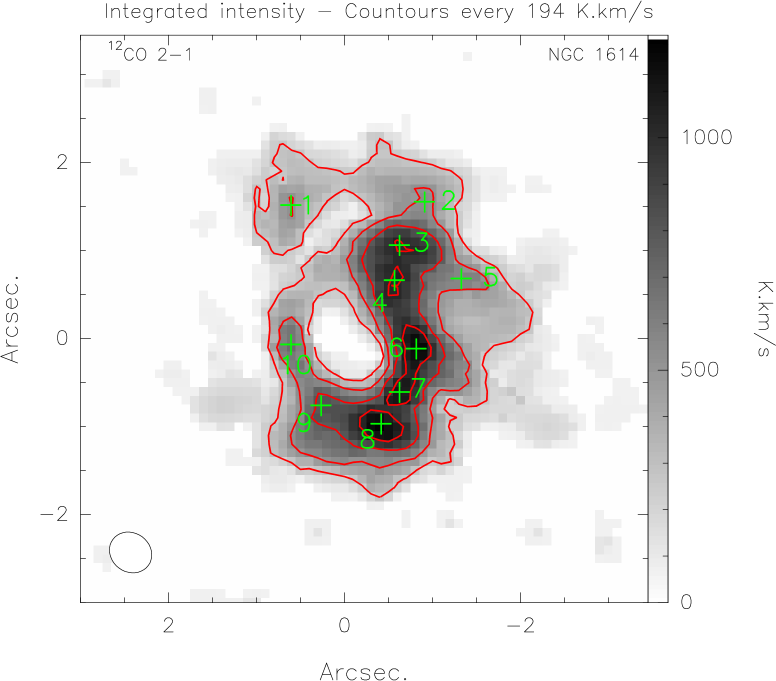
Our data mapped at the highest resolution (beam: 0.43′′ 0.38′′, PA = 52∘, 1′′ = 189 pc) revealed a
clumpy structure in the Eye component of the CO 21 distribution, as in NGC~1097, NGC~1365, or NGC~1614,
for example. We identified 11 possible GMAs (see Fig. 5); the majority (GMA 1 to GMA 8) are located in the northern
part of the structure. Masses M(H2) between 1.0 107 M and
3.6 107 M place them in the mass range typically found for GMAs (Vogel et al. 1988). Their dispersion values
and sizes (spherical radii) range from 40 km s-1 to 67 km s-1 and 35 pc to 56 pc, respectively. Due to
their large velocity dispersion, the GMA candidates do not fall on the Larson size-linewidth law for molecular clouds
(e.g., Larson 1981; Solomon et al. 1987) but instead lie above this relation. A comparison of the CO spectra of the GMA candidates reveals a single
spectral peak in all GMAs not associated with gas surrounding the AGN position. The spectra of some of the GMAs in the northern part of
the shell show a double-peaked emission line (GMA 5, 8) and broad line widths probably due to blending of the two velocity components
(GMA 6). These three complexes are closest to the nucleus of NGC 4194. The GMAs 7 and 8 are located in the northern part of the shell;
GMA 9 to 11 are located in the southern part. The majority of these hot spots of enhanced 12CO 21 intensity (GMA 1, 4, 7,
911) is actually associated with the eastern dust lane that crosses the molecular gas shell. This can also be seen in NGC 1614, for
example, where half of the GMAs identified in CO 21 observations are associated with dust lanes.
The average mass of the GMA candidates in NGC 4194 is 2.2 107 M, the line widths average at a value of
120 km s-1, and the fitted average FWHM size (spherical radius) of the GMAs is 109 pc. The GMAs in NGC 1614
seem to lie on a different scale. They are on average more massive (6.0 107 M), show the same line widths
(120 km s-1), and are significantly larger in size (270 pc) than the GMAs in NGC 4194 (König et al. 2013). The size estimate is
difficult, though. Therefore, this comparison criterion should not be overestimated. Another point to keep in mind is that the
ring-structure in NGC 4194 is only half of the size of the ring in NGC 1614. Another galaxy bearing GMAs that are comparable to the ones
in NGC 1614 is NGC 1097
(average size 250 pc, mass 9.2 107 M, line width 84 km s-1 Hsieh et al. 2011), whereas the
GMAs in NGC 1365 (line widths between 60 and 90 km s-1, masses of 106 M, Sakamoto et al. 2007) seem to be
even less massive and have smaller line widths than the ones in NGC 4194.
| GMA | RA(2000) | DEC(2000) | spherical radius333The source size was determined by fitting a Gaussian to the position of the
respective GMA in the uv table. The values given here are the
FWHM of the fitted Gaussian deconvolved from the synthesized beam. The typical (average) error for the fit to the GMA size is about 20%. |
0444Typical errors are on the order of 5-10 km s-1. | dispersion555Typical errors are on the order of 10%. | mass | |
|---|---|---|---|---|---|---|---|
| [h] [m] [s] | [∘] [′] [′′] | [pc] | [km s-1] | [km s-1] | [M] | ||
| GMA 1 | 12:14:09.805 | 54:31:35.54 | 83 | 2585 | 42 | 1.0 107 | |
| GMA 2 | 12:14:09.749 | 54:31:36.01 | 103 | 2501 | 52 | 1.5 107 | |
| GMA 3 | 12:14:09.631 | 54:31:36.08 | 92 | 2467 | 44 | 1.2 107 | |
| GMA 4 | 12:14:09.737 | 54:31:35.47 | 132 | 2557 | 57 | 3.4 107 | |
| GMA 5 | 12:14:09.674 | 54:31:35.76 | 114 | 2508 | 67 | 2.8 107 | |
| GMA 6 | 12:14:09.632 | 54:31:35.44 | 92 | 2510 | 62 | 1.6 107 | |
| GMA 7 | 12:14:09.749 | 54:31:34.72 | 123 | 2595 | 40 | 3.1 107 | |
| GMA 8 | 12:14:09.667 | 54:31:35.13 | 130 | 2595 | 45 | 3.5 107 | |
| GMA 9 | 12:14:09.612 | 54:31:33.90 | 103 | 2599 | 45 | 1.9 107 | |
| GMA 10 | 12:14:09.577 | 54:31:34.21 | 130 | 2575 | 59 | 3.1 107 | |
| GMA 11 | 12:14:09.547 | 54:31:34.55 | 92 | 2588 | 47 | 1.3 107 |
4.3 Circumnuclear molecular gas and star formation
A number of different gas tracers has been observed toward NGC 4194 with different spatial resolutions. The CO 10, radio continuum
(at 3.5 cm, 6 cm and 20 cm), and HST observations (e.g., at wavelengths of 150 nm and 600 nm), for example, show brightness distribution
peaks at the location of the AGN (e.g., Aalto & Hüttemeister 2000; Condon et al. 1990; Beswick et al. 2005; Armus et al. 1990; Weistrop et al. 2004). Spectroscopic H observations find the majority
of the star formation going on in the central 8′′ (Weistrop et al. 2012). Several star forming clusters have been identified in the UV
(160 nm & 200 nm, Weistrop et al. 2004) and the VIS (430 nm & 780 nm, Hancock et al. 2006); some of them are associated with the AGN at the
nucleus of NGC 4194 (Fig. 8).
Most of the brightness peaks identified in the high resolution CO 10 data (Aalto & Hüttemeister 2000) are situated in the main dust lane (peaks
a, b, d, and e). Peaks a and b represent positions in the southern and northern part of the central high surface brightness density
complex in the CO 21 maps; peaks c and d are located in the northern and the southern part of the western arm. Two of the CO 10
peaks (b and c) seem to be counterparts to brightness maxima found in H observations
(see Fig. 7, Armus et al. 1990). Peak b is furthermore associated with the peak position in the
high-resolution 1.4 GHz continuum maps (see, e.g., Fig. 6, Beswick et al. 2005).
Our CO 21 observations together with all these tracers indicate that a big part of the overall star forming activity seems to be
on-going in the central few arcseconds around the AGN. However, to gain more insight into the locations and the properties of the star forming regions in the center of NGC 4194, further observations are needed. For example, high resolution Br narrow-band images
would give valuable insight into the positions of regions of massive star formation; HCN/HCO+ observations would help to
distinguish high density regions ( 104 cm-3).
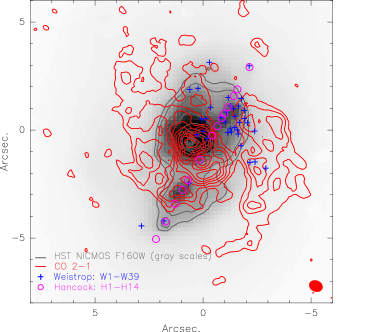
The search for star clusters has yielded detections in the visible and in the UV wavelength regimes (see
Figs. 8 and 9). Weistrop et al. (2004) used HST imaging to look for star clusters
in the UV. They identified 39 young stellar clusters between the ages of 5 and 15 Myr distributed over the the optical body of NGC 4194.
Hancock et al. (2006) extended the properties of star clusters in this galaxy by identifying 14 clusters in a slit positioned along a position
angle of 147∘ using visible and UV light. Some of the clusters from the two samples seem to coincide within the placement of the
slit, but there are also clusters at slit positions in the visible light that seem to have no UV counterparts. The majority of the UV and
VIS identified star clusters does not seem to be closely associated with the molecular gas. Indeed, most of these clusters are positioned
in a void of molecular gas between the eastern and western parts in the CO 21 emission. Most of the UV-identified clusters are
located in the north and west of the CO 21 distribution; none are associated with molecular gas in the east and north-east of the
nucleus (Figs. 8, 9).
A comparison to the high resolution CO 21 shows that the GMAs closest to the nucleus (GMA 3, 5 and 6) seem to be associated with some
of the Weistrop et al. (2004) UV clusters (Fig. 9). One of the clusters identified by Hancock et al. (2006) is also
located in that region. The southern part of the CO shell, on the other hand, harbors no star clusters, although we identified three GMAs
in that region. One of the VIS-identified star clusters, however, is located right at the center of the shell, where there is no CO, but
the radio continuum has a secondary peak in this location.
Using the CO 21 data, we are now able to better distinguish between the higher density gas close to the nucleus and the lower density
gas in the surrounding environment described by the CO 10 observations of Aalto & Hüttemeister (2000). Indeed, we find that the gas in the Eye
closest to the nucleus is of higher surface brightness density than the larger scale CO emission. This reservoir of
high-surface-brightness gas is located inside the solid body part of the rotation (Fig. 3). The gas surface density
close to the nucleus amounts to 4.1 103 M pc-2, whereas we find a value of
1.4 103 M pc-2 for the surrounding medium; hence, we find a difference of a factor of
3. This value would increase even more when taking the surface density of the CO 10
(500-1000 M pc-2, Aalto & Hüttemeister 2000) into account instead. The difference between the obtained values from our
CO 21 observations and the CO 10 data from Aalto & Hüttemeister (2000) is that we do suffer from resolving out large parts of the lower
brightness gas due to the high resolution of these observations.
The bulk of the star formation ongoing in the super star clusters that are distributed on extended scales is not associated with the
regions of highest surface brightness density (Figs. 8, 9). The clusters
identified with the highest H SFR, however, are located in this high surface density region (Hancock et al. 2006). Using the CO 21
surface brightness density, the Kennicutt-Schmidt law predicts a star formation rate of 4.9 M yr-1, which within
the error bars is in good agreement with the 6-7 M yr-1 value that Aalto & Hüttemeister (2000) estimated from the FIR but is much
below the value of 46 M yr-1 that Hancock et al. (2006) derive from their H observations. The star formation efficiency we obtained from the highest surface brightness density CO 21 emission is
1.5 10-8 yr-1. Although NGC 4194 has a brightness surface density of one magnitude lower than typical
ULIRGs, its star formation efficiencies rival that of these extraordinary objects (e.g., SFE(Arp~220)
2 10-8, Franceschini 2003). Compared to values in typical mergers, the star formation in NGC 4194 is two orders of
magnitude more efficient (Rownd & Young 1999).
Although the gas surface density at the center of NGC 4194 has now increased to
4.1 103 M pc-2, these values show that the surface density even in the densest regions in
the center is still lower by one order of magnitude compared to the gas in the centers of ULIRGs like Arp~220 or objectMrk 231
that have surface densities of up to 3.3 104 M pc-2 (Bryant & Scoville 1999). The central high surface
brightness gas density values in NGC 4194 are comparable to numbers for other similar sources, such as NGC 1614
(3.1 103 M pc-2, König et al. 2013) and NGC 5218
(1.8 103 M pc-2, Cullen et al. 2007).
4.4 Infalling gas
1.4 GHz radio continuum observations show two compact radio components at the center of NGC 4194 (Beswick et al. 2005). They concluded that there
is the possibility of a weak, buried AGN that contributes to the powering of the star formation. The position that is inferred from the
radio continuum brightness peak coincides with the velocity dispersion peak, which we find in our CO 21 data
(Fig. 2a). The rotation curve fitted to the CO 21 data cube (Fig. 2a,
Sect. 3.1.2) further indicated the location of the dynamical center just 0.4′′ toward the south of the
radio continuum and the velocity dispersion peaks. This is in positional agreement within one beam size.
It is possible that the nucleus is fed by molecular gas returning via the dust lane. Bournaud et al. (2005) have shown that the gas in minor
mergers that is brought in by a disturbing galaxy companion is generally found at large radii in the merger remnant. Gas located in this
largest scale gas reservoir is then returned to the system via tidal tails, where it often ends up forming rings, which might be
associated with or appear as dust lanes seen edge-on. In NGC 4194, a number of dust lanes has been found. The dust lanes most probably
playing a role in the feeding of the AGN are the two large dust lanes to the east of the nucleus and a smaller one just northeast of the
AGN. All those dust lanes are associated with the CO emission (Aalto & Hüttemeister 2000, see also Fig. 1b) and might funnel the CO
from the larger scale molecular gas reservoir, as traced by the CO 10 emission, to the center and ultimately to the AGN. We found
evidence for this scenario for example in the western part of the molecular gas distribution in the velocity field
(Figs. 1c, d) and the map showing the residuals from the subtraction of the rotation curve
(Fig. 2b), which show typical features of streaming motions as, for example, found in M~51 (Aalto et al. 1999) and M~83 (Rand et al. 1999).
Another mode of transport providing gas to the center of NGC 4194 might be streaming motions. We found indications for streaming motions
in the western arm of NGC 4194. Gas could be piled up in the center of the galaxy due to orbit crowding processes of inflowing gas
streams. In the galactic potential, the gas brought in through the streams encounters shocks and migrates to new orbits accumulating in
these locations.
| Galaxy | Merger/ | presence of | ring key properties | shell key properties | Reference666References: 1):
this work, 2): Beck et al. (2014), 3) Jütte et al. (in prep.), 4): König et al. (2013), 5): Olsson et al. (2007),
6): Gallagher & Parker (2010), 7): Sparke et al. (2009), 8): Krips et al. (2005), 9): Manthey et al. (2008), 10): Jütte et al. (2010), 11): Weiß et al. (1999), 12): Nakai et al. (1987), 13): Sakamoto et al. (2006) |
||||||
|---|---|---|---|---|---|---|---|---|---|---|---|
| interaction | a bar | a ring | a shell | radius [pc] | mass [M] | radius [pc] | vexp777expansion velocity [km/s] | mass [M] | |||
| NGC 4194 | + | + | + | + | 320 | 4.4 108 | 180 | 55 | 2.3 108 | 1), 2), 3) | |
| NGC 1614 | + | (+)888Its presence is still under discussion.\saveFN\tab | + | – | 500 | 8.3 108 | – | – | – | 4) | |
| NGC 5218 | +999Part of an interacting galaxy pair: NGC 5218 NGC 5216, NGC 3718 NGC 3729, M 82 M 81.\saveFN\inte | + | + | + | 470 | 7 108 | 150 | 30 | 7 107 | 5), 6) | |
| NGC 3718 | +\useFN\inte | + | – | – | – | – | – | – | – | 7), 8) | |
| NGC 4441 | + | – | (+)\useFN\tab | + | 875 | 4.1 108 | 101010No values given in the literature for the optical shells.\saveFN\sfn | \useFN\sfn | \useFN\sfn | 9), 10) | |
| M 82 | +\useFN\inte | + | + | + | 200 | 3 107 | 65111111Values are for the molecular “superbubble”.\saveFN\foot | 45\useFN\foot | 8 106 \useFN\foot | 11), 12) | |
| NGC 253 | – | + | – | + | – | – | 130 | 50 | 106 | 13) | |
5 Comparisons to other galaxies
Comparisons between the features of NGC 4194 and other interacting galaxies with similar types of structure can help in the interpretation of our data. In this section, we consider how the properties of NGC 4194 relate to those observed in a comparison sample of interacting galaxies and galaxies with shells/bubbles.
5.1 Comparison to other minor axis dust lane minor mergers
One galaxy sharing a number of properties with NGC 4194 is the S+s minor merger NGC~1614. Both galaxies are associated with
large reservoirs of molecular gas (e.g., Aalto & Hüttemeister 2000; Olsson et al. 2010; König et al. 2013). Whereas the star formation in NGC 1614 is mostly
associated with molecular gas (CO) and other tracers like Pa, radio continuum, etc. (König et al. 2013), most of the star formation
in NGC 4194 is taking place in star clusters (Weistrop et al. 2004; Hancock et al. 2006), which are not associated with the bulk of the 12CO emission,
but instead, mostly with lower surface brightness gas to the west of the mergers nucleus.
Looking into the molecular gas content in these two galaxies in more detail, NGC 4194 and NGC 1614 share even more properties. In both
galaxies, a large reservoir of CO 10 emission is associated with the minor axis dust lanes crossing the mergers main body. This
association between molecular gas and dust lanes led to suggestions that the dust lanes are playing a key role in the transport of the
molecular gas into the centers of galaxies of this type (minor mergers). Both galaxy centers harbor ring-like molecular structures that
are clearly identified in high-resolution 12CO 21 observations (König et al. 2013, this work) that might be connected to the
larger scale CO 10 reservoirs via the respective dust lanes. The ring-structures are, however, different in size and mass. The ring
in NGC 1614 is twice as large and twice as massive (König et al. 2013) than the shell complex in NGC 4194
(Fig. 9, Table 2). Both ring-like structures are located off the actual nuclei of their
galaxies: the ring in NGC 1614 is located symmetrically off-nucleus with its center located right at the galaxy’s nucleus
(König et al. 2013), whereas the high density gas complex in NGC 4194 including the shell is located asymmetrically off nucleus. Only the
gas to the north of the shell, containing the AGN, is located at the very nucleus of this galaxy. Both rings are closely associated with
radio continuum emission, whereas the emission in NGC 1614 is actually associated with the ring, the radio continuum in NGC 4194 has
a secondary peak at the center of the shell but does not coincide with most of the CO emission located in the shell. It does seem as if
the radio continuum in NGC 4194 is avoiding the regions filled with CO in the shell. Furthermore, we have identified GMAs
(Fig. 9) in both NGC 4194 and NGC 1614 - 11 in NGC 4194 and ten in NGC 1614. The GMAs in both minor
mergers are associated with the dust lanes. In general, the GMAs in NGC 4194 are smaller in size and mass then the ones in NGC 1614. This
is most probably due to the AGN-shell-complex in NGC 4194 itself being much smaller than the ring in NGC 1614.
Other nearby minor axis dust lane galaxies at different evolutionary stages in the merger sequence share some of these properties
as well (e.g., NGC~5218, NGC~3718, and NGC~4441). The object NGC 5218 is a merger at an earlier evolutionary
stage with a molecular ring about 2.5 times larger and twice more massive than the ring in NGC 4194
(Table 2 Cullen et al. 2007; Olsson et al. 2007). Two galaxies at a later evolutionary stage in the merger sequence are NGC 3718 and
NGC 4441. In their morphology, NGC 3718 and NGC 4441 are very similar to NGC 4194; they have tidal tails and minor axis dust lanes
crossing the galaxies. Closely associated with these features are molecular gas reservoirs extended out to large scales
(e.g., Pott et al. 2004; Krips et al. 2005; Jütte et al. 2010) as in NGC 4194. Like NGC 4194, NGC 3718 hosts a large number of star clusters (Trinh et al. 2006). Both
mergers also harbor molecular disks/ring-like structures at their centers (Schwarz 1985; Pott et al. 2004; Krips et al. 2005; Sparke et al. 2009; Jütte et al. 2010).
In a nutshell, galaxies with minor axis dust lanes involved in interactions/mergers can show extended molecular gas emission over
scales of several kpc, and many harbor molecular gas rings at their centers. There is no obvious correlation between the size and mass
of the observed molecular rings with the stage of the interaction/merger process the comparison galaxies represent.
5.2 Shells in other galaxies
A number of shells and bubbles have been discovered in external galaxies using different atomic and molecular gas tracers
(e.g., HI, OH, CO, Weiß et al. 1999; Wills et al. 2002; Sakamoto et al. 2006; Olsson et al. 2007; Argo et al. 2010). Nearby starburst galaxies known to host molecular shells/bubbles are
M~82, NGC~253, and NGC~5218. These bubble hosts are no mergers, but M 82 and NGC 5218 are involved in
interactions. All three of them have a bar transporting molecular gas to the galaxies center (Petitpas & Wilson 2000; Mauersberger et al. 1996; Olsson et al. 2007) like NGC 4194
(Beck et al. 2014, Jütte et al. in prep.).
One process, that causes the formation of shells/bubbles can be the explosion of a large number of supernovae, as suggested for the
bubbles in M 82 (e.g., Wills et al. 2002; Argo et al. 2010) and the shell in NGC 5218 (Olsson et al. 2007). It has been determined that the energy output of up
to several thousand type II supernovae is necessary to reach the current extents that are found for these structures. An alternative
scenario for shell/bubble formation is that they might be caused by stellar winds coming from massive super star clusters, as suggested
for the bubbles in NGC 253 (Sakamoto et al. 2006). NGC 4194 does have a large population of star clusters, but the majority of these clusters is
located away from the bulk of the molecular gas. In particular, we do not find a large conglomerate of star clusters at the center of the
molecular shell in NGC 4194. This points toward supernova explosions as the driving mechanism of the shell in this galaxy.
An in-detail comparison between the shells/bubbles in these three galaxies with the shell in NGC 4194 (for more details see
Table 2) shows that the shell in NGC 4194 is older, has a larger size, expands with a higher velocity, and is more
massive than the shells/bubbles found in the starburst galaxies M 82, NGC 253, and NGC 5218.
This shows that NGC 4194 shares properties with several of the comparison galaxies - for example, being a merger, having dust lanes,
harboring shells/bubbles and/or GMAs, having asymmetric molecular ring-like structures, and massive star clusters. However, we always
found significant differences as well. Therefore, NGC 4194 cannot be classified as a typical barred spiral galaxy, or a typical merger of
any flavor; it remains a very interesting yet puzzling object.
6 Summary
We studied the properties of the molecular gas in the center of NGC 4194 using high angular resolution 12CO 21 emission line observations.
-
1.
We found a ring-like structure, the Eye of the Medusa, at the center of NGC 4194. A large part of the gas in this region of high surface brightness is associated with the major dust lane. The structure contains molecular gas associated with the AGN and a molecular shell located southeast of the nucleus.
-
2.
The event causing the formation of the molecular shell southeast of the dynamical center of NGC 4194 was most probably a number of supernovae explosions, which now pushes the molecular gas outward.
-
3.
The kinematics of the molecular gas distribution suggest that gas is transported along the dust lanes to the center of NGC 4194, where it replenishes the gas in the Eye. Smaller dust lanes in the very center, together with the pressure provided by the expanding material in the shell, then funnel this gas to the immediate surroundings of the AGN.
-
4.
We identified individual GMAs in the Eye, which are associated with both the shell structure and the gas surrounding the AGN. The GMAs are not associated with star clusters previously identified in the UV and visible wavelength regimes.
In summary, we found that NGC 4194 is a very interesting lab to study different physical properties of the molecular gas in different
states. It is remarkable how well-ordered the velocity field looks when comparing all the different processes going on at different
scales of this merger. We believe we found another example of a minor merger, besides NGC 1614, where molecular gas is transported via
the dust lanes to the very center of the galaxy. There, we found molecular gas associated with the AGN at the dynamical center and with a
shell to the southeast of the very nucleus, which is most likely formed by explosions of supernovae. The GMAs we located in the central
molecular structure might be the result of the formation of denser gas resulting from shocks from the supernovae explosions.
In spite of these results, many questions remain to be answered, such as the origin of the gas surrounding the AGN, the feeding of the
AGN itself on even smaller scales and the origin of the GMAs, or how the kinematics of cold molecular gas affect the evolution of star
formation and nuclear activity in minor mergers in general. A more detailed study of the molecular gas content of NGC 4194 on different
spatial scales is needed to address these questions. New studies with instruments, such as the PdBI and the SMA, will enable us to answer
them.
Acknowledgements.
We thank the referee for useful comments. SA thanks the Swedish Research Council (grant 621-2011-414) and the Swedish National Space Board (SNSB, grant 145/11:1-3) for support. JSG thanks the College of Letters & Science, University of Wisconsin-Madison for partial support of this work. The Submillimeter Array is a joint project between the Smithsonian Astrophysical Observatory and the Academia Sinica Institute of Astronomy and Astrophysics and is funded by the Smithsonian Institution and the Academia Sinica. MERLIN/eMERLIN is a National Facility operated by the University of Manchester at Jodrell Bank Observatory on behalf of STFC. AIPS is produced and maintained by the National Radio Astronomy Observatory, a facility of the National Science Foundation operated under cooperative agreement by Associated Universities, Inc. This research has made use of the NASA/IPAC Extragalactic Database (NED) which is operated by the Jet Propulsion Laboratory, California Institute of Technology, under contract with the National Aeronautics and Space Administration.References
- Aalto et al. (2010) Aalto, S., Beswick, R., & Jütte, E. 2010, A&A, 522, A59
- Aalto & Hüttemeister (2000) Aalto, S. & Hüttemeister, S. 2000, A&A, 362, 42
- Aalto et al. (2001) Aalto, S., Hüttemeister, S., & Polatidis, A. G. 2001, A&A, 372, L29
- Aalto et al. (1999) Aalto, S., Hüttemeister, S., Scoville, N. Z., & Thaddeus, P. 1999, ApJ, 522, 165
- Argo et al. (2010) Argo, M. K., Pedlar, A., Beswick, R. J., Muxlow, T. W. B., & Fenech, D. M. 2010, MNRAS, 402, 2703
- Armus et al. (1990) Armus, L., Heckman, T. M., & Miley, G. K. 1990, ApJ, 364, 471
- Beck et al. (2014) Beck, S. C., Lacy, J., Turner, J., Greathouse, T., & Neff, S. 2014, ApJ, 787, 85
- Bernard-Salas et al. (2009) Bernard-Salas, J., Spoon, H. W. W., Charmandaris, V., et al. 2009, ApJS, 184, 230
- Beswick et al. (2005) Beswick, R. J., Aalto, S., Pedlar, A., & Hüttemeister, S. 2005, A&A, 444, 791
- Bournaud et al. (2005) Bournaud, F., Jog, C. J., & Combes, F. 2005, A&A, 437, 69
- Brandt (1960) Brandt, J. C. 1960, ApJ, 131, 293
- Bryant & Scoville (1999) Bryant, P. M. & Scoville, N. Z. 1999, AJ, 117, 2632
- Casoli et al. (1992) Casoli, F., Dupraz, C., & Combes, F. 1992, A&A, 264, 55
- Chevalier (1974) Chevalier, R. A. 1974, ApJ, 188, 501
- Clark (1980) Clark, B. G. 1980, A&A, 89, 377
- Combes (1988) Combes, F. 1988, in NATO ASIC Proc. 232: Galactic and Extragalactic Star Formation, ed. R. E. Pudritz & M. Fich, 475
- Condon et al. (1990) Condon, J. J., Helou, G., Sanders, D. B., & Soifer, B. T. 1990, ApJS, 73, 359
- Cullen et al. (2007) Cullen, H., Alexander, P., Green, D. A., & Sheth, K. 2007, MNRAS, 376, 98
- de Grijs et al. (2003) de Grijs, R., Anders, P., Bastian, N., et al. 2003, MNRAS, 343, 1285
- Franceschini (2003) Franceschini, A. 2003, in Galaxies at High Redshift, ed. I. Pérez-Fournon, M. Balcells, F. Moreno-Insertis, & F. Sánchez, 69–129
- Gallagher & Parker (2010) Gallagher, III, J. S. & Parker, A. 2010, ApJ, 722, 1962
- Hancock et al. (2006) Hancock, M., Weistrop, D., Nelson, C. H., & Kaiser, M. E. 2006, AJ, 131, 282
- Hsieh et al. (2011) Hsieh, P.-Y., Matsushita, S., Liu, G., et al. 2011, ApJ, 736, 129
- Jütte et al. (2010) Jütte, E., Aalto, S., & Hüttemeister, S. 2010, A&A, 509, A19
- Kaaret & Alonso-Herrero (2008) Kaaret, P. & Alonso-Herrero, A. 2008, ApJ, 682, 1020
- Kennicutt & Evans (2012) Kennicutt, R. C. & Evans, N. J. 2012, ARA&A, 50, 531
- König et al. (2013) König, S., Aalto, S., Muller, S., Beswick, R. J., & Gallagher, J. S. 2013, A&A, 553, A72
- Krips et al. (2005) Krips, M., Eckart, A., Neri, R., et al. 2005, A&A, 442, 479
- Larsen (2002) Larsen, S. S. 2002, AJ, 124, 1393
- Larson (1981) Larson, R. B. 1981, MNRAS, 194, 809
- Lehmer et al. (2010) Lehmer, B. D., Alexander, D. M., Bauer, F. E., et al. 2010, ApJ, 724, 559
- Lindroos (2011) Lindroos, L. 2011, Masters thesis, Chalmers University of Technology
- Manthey et al. (2008) Manthey, E., Hüttemeister, S., Aalto, S., Horellou, C., & Bjerkeli, P. 2008, A&A, 490, 975
- Mauersberger et al. (1996) Mauersberger, R., Henkel, C., Wielebinski, R., Wiklind, T., & Reuter, H.-P. 1996, A&A, 305, 421
- Mora et al. (2009) Mora, M. D., Larsen, S. S., Kissler-Patig, M., Brodie, J. P., & Richtler, T. 2009, A&A, 501, 949
- Nakai et al. (1987) Nakai, N., Hayashi, M., Handa, T., et al. 1987, PASJ, 39, 685
- Narayanan et al. (2012) Narayanan, D., Krumholz, M. R., Ostriker, E. C., & Hernquist, L. 2012, MNRAS, 421, 3127
- Olsson et al. (2010) Olsson, E., Aalto, S., Thomasson, M., & Beswick, R. 2010, A&A, 513, A11+
- Olsson et al. (2007) Olsson, E., Aalto, S., Thomasson, M., Beswick, R., & Hüttemeister, S. 2007, A&A, 473, 389
- Petitpas & Wilson (2000) Petitpas, G. R. & Wilson, C. D. 2000, ApJ, 538, L117
- Pott et al. (2004) Pott, J.-U., Hartwich, M., Eckart, A., et al. 2004, A&A, 415, 27
- Rand et al. (1999) Rand, R. J., Lord, S. D., & Higdon, J. L. 1999, ApJ, 513, 720
- Rownd & Young (1999) Rownd, B. K. & Young, J. S. 1999, AJ, 118, 670
- Sakamoto et al. (2006) Sakamoto, K., Ho, P. T. P., Iono, D., et al. 2006, ApJ, 636, 685
- Sakamoto et al. (2007) Sakamoto, K., Ho, P. T. P., Mao, R.-Q., Matsushita, S., & Peck, A. B. 2007, ApJ, 654, 782
- Sandstrom et al. (2013) Sandstrom, K. M., Leroy, A. K., Walter, F., et al. 2013, ApJ, 777, 5
- Schwarz (1985) Schwarz, U. J. 1985, A&A, 142, 273
- Shlosman et al. (1989) Shlosman, I., Frank, J., & Begelman, M. C. 1989, Nature, 338, 45
- Solomon et al. (1987) Solomon, P. M., Rivolo, A. R., Barrett, J., & Yahil, A. 1987, ApJ, 319, 730
- Sparke et al. (2009) Sparke, L. S., van Moorsel, G., Schwarz, U. J., & Vogelaar, M. 2009, AJ, 137, 3976
- Trinh et al. (2006) Trinh, C. Q., Sparke, L. S., & Gallagher, J. S. 2006, in Bulletin of the American Astronomical Society, Vol. 38, American Astronomical Society Meeting Abstracts, 924
- van der Laan et al. (2013) van der Laan, T. P. R., Schinnerer, E., Emsellem, E., et al. 2013, A&A, 556, A98
- Vogel et al. (1988) Vogel, S. N., Kulkarni, S. R., & Scoville, N. Z. 1988, Nature, 334, 402
- Weiß et al. (1999) Weiß, A., Walter, F., Neininger, N., & Klein, U. 1999, A&A, 345, L23
- Weistrop et al. (2004) Weistrop, D., Eggers, D., Hancock, M., et al. 2004, AJ, 127, 1360
- Weistrop et al. (2012) Weistrop, D., Nelson, C. H., Angione, R., et al. 2012, AJ, 143, 98
- Wills et al. (2002) Wills, K. A., Pedlar, A., & Muxlow, T. W. B. 2002, MNRAS, 331, 313