The cosmological Lithium problem outside the Galaxy:
the Sagittarius globular cluster M54
††thanks: Based on data taken at the ESO, within
the observing program 089.D-0341.
Abstract
The cosmological Li problem is the observed discrepancy between Li abundance () measured in Galactic dwarf, old and metal-poor stars (traditionally assumed to be equal to the initial value ), and that predicted by standard Big Bang Nucleosynthesis calculations (). Here we attack the Li problem by considering an alternative diagnostic, namely the surface Li abundance of red giant branch stars that in a colour magnitude diagram populate the region between the completion of the first dredge-up and the red giant branch bump. We obtained high-resolution spectra with the FLAMES facility at the Very Large Telescope for a sample of red giants in the globular cluster M54, belonging to the Sagittarius dwarf galaxy. We obtain = 0.930.11 dex, translating – after taking into account the dilution due to the dredge up– to initial abundances () in the range 2.35–2.29 dex, depending on whether or not atomic diffusion is considered. This is the first measurement of Li in the Sagittarius galaxy and the more distant estimate of in old stars obtained so far. The estimated in M54 is lower by 0.35 dex than , hence incompatible at a level of . Our result shows that this discrepancy is a universal problem concerning both the Milky Way and extra-galactic systems. Either modifications of BBN calculations, or a combination of atomic diffusion plus a suitably tuned additional mixing during the main sequence, need to be invoked to solve the discrepancy.
keywords:
stars: abundances – stars: atmospheres – stars: Population II – (Galaxy:) globular clusters: individual (M54)1 Introduction
Lithium, together with hydrogen and helium, is produced in the first minutes after the Big Bang, and its primordial abundance is a function of the cosmological density of baryons. An estimate of this primordial Li abundance provides therefore an important test for current standard cosmological models. Spite & Spite (1982) first discovered that dwarf (main sequence, turn-off or sub-giants), Population II stars with effective temperatures () between 5700 and 6300 K and [Fe/H]–1.4 dex share the same Li abundance, the so-called Spite Plateau. The existence of a narrow Li Plateau has been confirmed by three decades of observations (see e.g. Rebolo et al., 1988; Bonifacio & Molaro, 1997; Asplund et al., 2006; Bonifacio et al., 2007); when considering stellar evolution calculations that include only convection as element transport, this plateau corresponds to the primordial Li abundance in the Galactic halo, that is usually identified as the Li abundance produced during the Big Bang Nucleosynthesis (). The measured Li abundance in Spite Plateau dwarfs is in the range A(Li)111A(Li)== 2.1–2.3 dex, depending on the adopted scale.
On the other hand, the very accurate determination of the baryonic density obtained from the WMAP (Spergel et al., 2007; Hinshaw et al., 2013) and PLANCK (Planck collaboration, 2013) satellites, coupled with the BBN standard model, has allowed to calculate . The derived values (2.720.06 dex, Cyburt et al., 2008, and 2.690.04, Coc et al. 2013) are significantly higher, about a factor of 3, than that measured in dwarf stars.
A first potential solution to this discrepancy between from BBN calculations and Spite Plateau measurements (denoted here as the cosmological Li problem) envisages the inclusion of atomic diffusion in stellar model calculations. Atomic diffusion is a physical process that can be modeled parameter-free from first principles, it is efficient in the Sun (see e.g. Bahcall et al., 1997), and can deplete efficiently the surface abundance of Li in metal poor main sequence stars. However, because the degree of depletion increases with effective temperature (and decreasing metallicity), it is not possible to reproduce the observed plateau-like abundance trend (see e.g. Richard et al., 2005, and references therein) if atomic diffusion is fully efficient in objects populating the Spite Plateau, see e.g. Fig. 3 in Mucciarelli et al. (2011).
Recent proposed solutions to the cosmological Li problem) are:
(i) the combined effect of atomic diffusion and some competing additional mixing –necessary to preserve the existence of an abundance plateau– whose combined effect decreases the Li abundance in the atmospheres of dwarf stars (Richard et al., 2005; Korn et al., 2006); (ii) inadequacies of the BBN model used to calculate (see e.g. Iocco et al., 2009); (iii) a Li depletion driven by Population III stars during the early Galaxy evolution (Piau et al., 2006).
Mucciarelli, Salaris & Bonifacio (2012, MSB12) proposed an alternative/complementary route to investigate the initial Li abundance in Population II stars (), by measuring the surface Li abundance in lower red giant branch (RGB) stars. These stars are located between the completion of the first dredge-up (FDU, where Li-free material is mixed to the surface by convection) and the luminosity level of the RGB bump (where an additional mixing episode occurs, see Gratton et al., 2000). These giants are characterised by a constant Li abundance (at fixed [Fe/H]), drawing a Plateau that mirrors the Spite Plateau but at a lower abundance (A(Li)0.9-1.0 dex). The amount of Li depletion due to dilution after the FDU can be predicted easily by stellar models. Lower RGB stars are therefore a powerful alternative diagnostic of , mainly because the derived value is very weakly affected by atomic diffusion during the previous main sequence phase. This means that it is possible to put strong constraints on , irrespective of whether atomic diffusion is effective or not, and assess whether additional processes –within the stars, or during the BBN nucleosynthesis, or during Galaxy formation– need to be invoked to match the BBN calculations of Li abundances. Moreover, lower RGB stars also enable to investigate in stars more distant than those usually observed for Spite Plateau studies.
In this paper we exploit this new diagnostic with the aim to study in M54, a massive globular cluster (GC) immersed in the nucleus of the Sagittarius (Sgr) dwarf galaxy (Monaco et al., 2005; Bellazzini et al., 2008). The dwarf stars in M54 and Sgr are too faint (V22) to be observed, thus the study of lower RGB stars represents the only possible route to infer in this galaxy. Section 2 describes the spectroscopic observations, followed in Section 3 by the determination of the Li abundances and the constraints on for M54 stars, and is followed by a discussion of the results and conclusions.
2 Observations
High-resolution spectra of lower RGB stars in M54 have been secured with the multi-object spectrograph FLAMES (Pasquini et al., 2002) at the ESO Very Large Telescope, in the GIRAFFE/MEDUSA mode. The observations have been performed with the setups HR12 (to sample the Na D lines, with a resolution of 18700) and HR15N (to sample the Li doublet at 6707 Å , with a resolution of 17000). The same target configuration has been used for both gratings and each target has been observed for a total time of 26 hr and 4 hr, for HR15N and HR12, respectively.
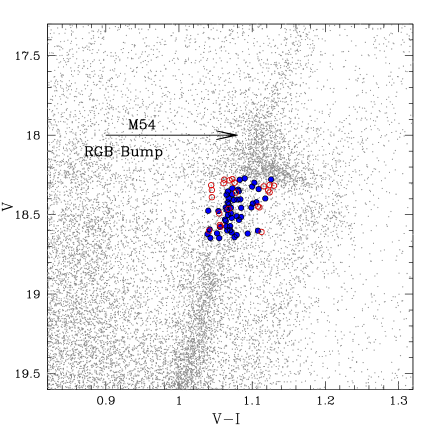
The targets have been selected from ACS@HST photometry (Siegel et al., 2007) for the central region and from WFI@ESO photometry (Monaco et al., 2002) for the outermost region. Eighty-five stars have been selected along the RGB of M54 in the magnitude range V=18.3-18.6, being its RGB bump at V18, according to the RGB luminosity function. We excluded the 0.2 magnitudes below the RGB bump to minimise the contamination from the Sgr He-Clump stars. Figure 1 shows the colour-magnitude diagram of M54 with marked the observed targets (red and blue points). The signal-to-noise (SNR) ratio per pixel around the Li doublet ranges from 30 to 50, with an average value of 42.
The spectra have been processed with the GIRAFFE data reduction pipeline, including bias-subtraction, flat-fielding, wavelength calibration, spectral extraction222https://www.eso.org/sci/software/pipelines/. Radial velocities have been measured with DAOSPEC (Stetson & Pancino, 2008) by using 15 metallic lines. 11 targets have been discarded because they are clearly Galactic interlopers, with radial velocities between –105 and +60 km/s (see Fig. 8 in Bellazzini et al., 2008). Finally, our sample includes a total of 74 candidate member stars of M54 (their main information is listed in Table 1).
3 Chemical analysis
Values of have been derived from the colour by means of the calibration by Alonso et al. (1999), adopting the colour excess E(B-V)= 0.14 mag (Layden & Sarajedini, 2000) and the extinction coefficients by McCall (2004). Surface gravities have been calculated from the Stefan-Boltzmann relation assuming the photometric , the bolometric corrections by Alonso et al. (1999) and the distance modulus = 17.10 mag (Monaco et al., 2004). We assumed a mass of 0.8 , according to a BaSTI isochrone (Pietrinferni et al., 2006) with 12 Gyr, Z= 0.0003 and -enhanced chemical mixture. A microturbulent velocity = 1.5 km/s has been assumed for all the targets, taking the median value of of the lower RGB stars analysed by MSB12.
Fe and Na abundances have been derived from the line equivalent widths (EWs) by using the code GALA (Mucciarelli et al., 2013), coupled with ATLAS9 model atmospheres. Fe abundances have been obtained from the measure of 10-15 Fe I lines, while Na abundances from the Na D lines at 5889-5895 Å. EWs of Fe lines have been measured with DAOSPEC (Stetson & Pancino, 2008), while those of the Na lines by using IRAF assuming a Voigt profile. NLTE corrections for the Na abundances are from Gratton et al. (1999). The recent NLTE calculations by Lind et al. (2011) provide lower by about 0.2–0.3 dex; however, in the following we refer to the abundances obtained with the corrections by Gratton et al. (1999) to allow a direct comparison with Carretta et al. (2010) that measured Na abundances in 76 stars of M54. Figure 2 shows the metallicity distribution of the 74 candidate M54 member stars, ranging from [Fe/H]=–2.0 dex up to –0.34 dex, with a main peak at –1.7 dex and a second peak at –0.9 dex.
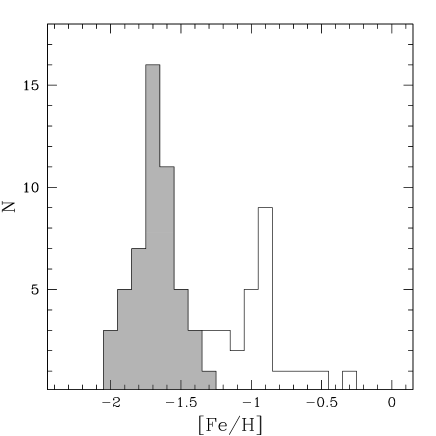
We consider as members of M54: (i) stars with radial velocity between 100 and 170 km/s, (Bellazzini et al., 2008), and (ii) stars with [Fe/H]–1.3 dex, in order to exclude the stars of the second peak observed in the metallicity distribution, likely belonging to the Sgr field (note that the metallicity distributions of M54 by Bellazzini et al. 2008 and Carretta et al. 2010 are both broad but they do not show evidence of bimodality). Finally, 51 targets are considered as bona fide M54 member stars. These stars are shown as blue circles in Fig. 1 and as the shaded histogram in Fig. 2. The mean iron content is [Fe/H]= –1.670.02 dex (= 0.15 dex), compatible with those derived by Bellazzini et al. (2008) and Carretta et al. (2010). The M54 member stars show a wide range of [Na/Fe], between –0.56 and +0.77 dex, with an average value [Na/Fe]=+0.110.04 dex (= 0.31 dex), fully consistent with the results by Carretta et al. (2010).
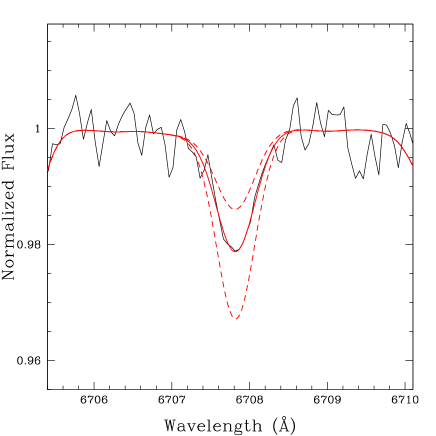
The Li abundances have been derived from the Li resonance doublet at 6707 Å, by comparing the observed spectra with a grid of synthetic spectra, calculated with the code SYNTHE (Sbordone et al., 2004). NLTE corrections are from Lind et al. (2008). The uncertainty in the fitting procedure has been estimated with MonteCarlo simulations performed by analysing synthetic spectra with the injection of Poissonian noise. Also, we included in the total error budget of the Li abundance the impact of the uncertainties in , the other parameters having a negligible impact on A(Li). Because of the weakness of the Li doublet (EW13 mÅ ), at the SNR of our spectra it cannot be properly measured in each individual spectrum. Thus, we grouped together all the spectra of the stars considered as members of M54, obtaining an average spectrum with SNR300 and assuming the average atmospheric parameters of the sample, namely = 4995 K and log g= 2.46. These stars are located in a narrow region of the colour-magnitude diagram, legitimating this procedure. In particular, is the most critical parameter for the Li abundance estimate, whereas log g and have a negligible impact. The 51 cluster members cover a range between 4873 K and 5090 K, with a mean equal to 4995 K (= 48 K), and a median value of 5005 K with an interquartile range of 51 K. Figure 3 shows the Li doublet observed in the average spectrum, with superimposed the best-fit synthetic spectrum (red solid line) and two synthetic spectra calculated with 0.2 dex with respect to the best-fit abundance (red dashed lines).
The final derived Li abundance is = 0.930.030.11 dex (where the first errorbar is the internal error as derived by the MonteCarlo simulations, and the second one is due to the uncertainty). For consistency with MSB12 we checked also obtained with the NLTE corrections by Carlsson et al. (1994), that lead to an increase of the final abundance by 0.08 dex, thus providing = 1.01 dex. The choice of the NLTE corrections has obviously a small impact of the final A(Li) value and does not change drastically our conclusions.
3.1 Checks about the average spectrum
To assess the stability of our results against the way we group the spectra,
we have performed a number of sanity checks.
In these tests we divided the cluster sample into two bins, according to:
(a) [Fe/H]; the two groups include stars
with [Fe/H] lower and higher than the median value of [Fe/H]
([Fe/H]=–1.67; see Fig. 2) respectively;
(b) ; the boundary between the two groups is the median
;
(c) magnitude; the two groups include stars
fainter and brighter than the median V-band magnitude (V= 18.45) respectively;
(d) [Na/Fe]; the boundary between the two groups is
the median value of the distribution (=+0.16 dex).
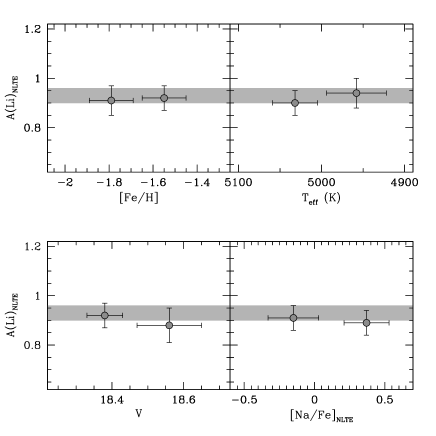
For all these cases, we found compatible within the uncertainties with the value obtained with the average spectrum of the whole cluster targets, as shown by Fig. 4. The largest difference (0.08 dex, still compatible within 1 with the original value), is found when we group together spectra with V-band magnitude fainter than V= 18.45, because they have the lowest SNR. In light of these results, we can conclude that no significant biases related to the grouping of the target spectra affect our Li abundance estimate.
Another point to discuss here concerns the use of a single value of the NLTE correction computed for the average atmospheric parameters of the whole sample. To this purpose we notice that the variation of the NLTE corrections in the parameter space covered by our targets is small: in particular, at fixed /logg the corrections vary by 0.03–0.04 dex between the minimum and maximum [Fe/H] of the metallicity distribution, while at fixed metallicity, the corrections change by 0.03 dex between the minimum and maximum . To investigate more rigorously this effect, we simulated a spectrum with the following procedure: (1) for each individual member star a synthetic spectrum has been calculated with the appropriate atmospheric parameters and iron abundance, imposing a Li abundance = 0.93 dex (to take into account the proper NLTE correction of each star); (2) the spectra have been rescaled according to the relative differences in magnitude; (3) Poissonian noise has been injected in each synthetic spectrum to reproduce the measured SNR of the observed counterpart; (4) all these synthetic spectra have been co-added as done with the observed sample.
The entire procedure is repeated to obtain a sample of 1000 average spectra that has been analysed as done with the observed stars. The derived distribution (assuming a single value of the NLTE correction) displays a mean value equal to 0.95 dex with a dispersion of 0.04 dex. This simulation confirms that star-to-star variations of the NLTE corrections are only a second order effect and do not affect substantially the abundance derived from the average spectrum.
3.2 Lithium abundance and chemical anomalies in GCs
It is well established that individual GCs harbour sub-populations characterised by different abundances of light elements, like Na and O (see e.g. Gratton et al., 2012). In principle, these so-called second-generation stars, characterised by high values of [Na/Fe] and low values of [O/Fe], should display lower Li abundances, because they are predicted to be born from gas diluted with Li-poor material coming from asymptotic giant branch or fast-rotating massive stars. Given that the thermonuclear reactions able to produce the observed chemical patterns occur at temperatures larger than K, while Li is destroyed at lower temperatures (K), second-generation stars should exhibit lower abundances of Li compared to first-generation stars. In particular, Li depletions, Li-O correlations and Li-Na anti-correlations are expected within individual clusters. Empirically, clear Li-O correlations have been detected in NGC6752 (Shen et al., 2010) and 47 Tuc (Dobrovolskas et al., 2014). Three Na-rich stars (thus belonging to the second cluster generation) with low Li abundance (A(Li)2.0 dex) have been detected in NGC6397 (Lind et al., 2009), while most of the observed stars display a uniform Li (compatible with the Spite Plateau) but a large range of Na, suggesting that Li depletion is negligible for the second generation stars of this cluster. M4 displays a very small (if any) intrinsic Li dispersion, without correlation between O and Li abundance (Mucciarelli et al., 2011) and with a weak Li-Na anticorrelation (Monaco et al., 2012). Lower RGB stars in M12 share all the same Li content, whilst there is a spread of Li in M5, but no statistically significant Li-O correlations and Li-Na anticorrelations (D’Orazi et al., 2014).
We have checked whether potential systematic differences between A(Li) of first and second generation stars in M54 can affect our conclusions. As discussed in Section 3.1 we divided the sample of M54 stars into two groups, according to their [Na/Fe] abundances, adopting as boundary the median value of the [Na/Fe] distribution (+0.16 dex). The derived average spectra show a very similar Li content, = 0.910.05 and 0.890.05 dex for the Na-poor and Na-rich groups, respectively, consistent with the value for the whole sample (see left bottom panel in Fig. 4). Note that systematic differences in the Li content between the two samples smaller than 0.1 dex (compatible, for instance, with those observed by Monaco et al. 2012 in M4) cannot be ruled out. However, such a small possible Li depletion in Na-rich stars of M54 does not change our conclusion about in this cluster.
3.3 in M54
To constrain the initial in M54, we adopted the same procedure discussed in MSB12, by using the amount of Li depletion due to the FDU as predicted by stellar models (see their Table 2). For a metallicity [Fe/H]=–1.67 dex, the predicted value is equal to 1.36 dex and 1.42 dex without and with atomic diffusion, respectively. As already discussed by MSB12, the amount of Li depletion along the RGB Plateau is marginally sensitive to the efficiency of the atomic diffusion that affects the dwarf stars much more strongly. We recall that M54 has an intrinsic iron dispersion (Carretta et al., 2010); however, the predicted Li depletion changes by 0.02 dex with respect to the values quoted above if we consider the minimum and maximum value of the cluster metallicity distribution, namely [Fe/H]=–2.0 and –1.3 dex. We can thus neglect the effect of the cluster metallicity spread.
The derived in M54 is = 2.290.11 dex (the error bar takes into account only the dominant effect of the uncertainty in ) without diffusion and 2.350.11 dex with fully efficient diffusion, When the NLTE corrections by Carlsson et al. (1994) are adopted, the range of values is 2.37–2.43 dex.
4 Discussion
This is the first study of the primordial Li abundance in M54 and, hence, in the Sgr galaxy. Also, it is the most distant measurement of in old, metal-poor stars obtained so far, given that Li abundance determinations in dwarf stars are restricted to distances within 8 kpc from the Sun (see the case of M92, Boesgaard et al., 1998; Bonifacio, 2002). The use of lower RGB stars allows a giant leap in the study of , pushing our investigation to 25 kpc from the Sun and enlarging our perspective of the Li problem. This work demonstrates the potential of lower RGB stars to investigate in stellar systems for which the observation of dwarf stars is precluded.
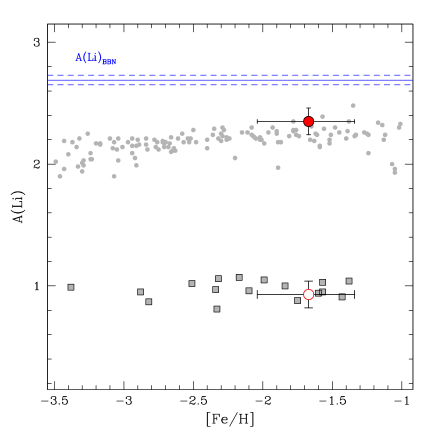
Fig. 5 compares our and for M54 stars (red empty and filled circle, respectively) to the results of Galactic field dwarf (grey circles) and lower RGB stars (grey squares). The value of provided by Coc et al. (2013) is shown as reference. First of all, measured in M54 red giants is in very good agreement with the results for the Galactic halo field (MSB12 found an average =0.97 with the same scale used for this study). Secondly, inferred from the lower RGB of M54 has, as already said, a very small dependence on whether atomic diffusion is fully efficient or inhibited, and results to be on average dex higher than typical values measured in dwarf stars, that are equal on average to A(Li)2.25 dex (see Fig. 5). Assuming the initial Li in M54 and the Galactic halo was the same, if atomic diffusion is fully efficient in Spite Plateau stars within the range of metallicities covered by M54 lower RGB stars, their surface Li abundances should be 0.4-0.7 dex lower than (see e.g. Fig. 3 in Mucciarelli et al., 2011)333It is worth bearing in mind that a detailed comparison between derived from lower RGB stars and the Spite Plateau depends also on the adopted scales and NLTE corrections; here we simply take at face value the various estimates displayed in Fig. 5.
This means that either atomic diffusion is completely inhibited in halo field stars, and therefore the cosmological Li problem persists, or an additional element transport must be at work, burning during the main sequence more Li than predicted by models with diffusion only. This route has been investigated in order to interpret the surface Li abundances measured in dwarf stars of Galactic globular clusters.
To this purpose we first compare the results for M54 with measurements of obtained for lower RGB stars in Galactic GCs that do not display a significant spread of Li. MSB12 determined =1.00 and =0.92 dex (both with 0.10 dex error bars) for NGC6397 ([Fe/H] dex) and M4 ([Fe/H]1.1 dex) respectively, using the same scale employed here. The same result has been found for lower RGB stars in M4 by Villanova & Geisler (2011). These values are well consistent with M54 result. The recent study by D’Orazi et al. (2014) found again a similar value, =0.98 dex, with an error bar of 0.10 dex (using again the same scale of this work) for lower RGB stars in M12, another cluster with essentially no Li spread amongst lower RGB objects, and [Fe/H] similar to M54.
Measurements of in dwarfs stars have been performed in M92 (Boesgaard et al., 1998; Bonifacio, 2002) NGC6397 (Korn et al., 2006; Lind et al., 2008; Gonzalez Hernandez et al., 2009; Nordlander et al., 2012), NGC6752 (Shen et al., 2010; Gruyters et al., 2013, 2014), M4 (Mucciarelli et al., 2011; Monaco et al., 2012), 47 Tuc (D’Orazi et al., 2010; Dobrovolskas et al., 2014). To these GCs, we add also Omega Centauri (Monaco et al., 2010), a globular cluster-like stellar system characterized by a wide range of metallicities and probably ages, and usually thought as the stripped core of a dwarf galaxy. All these works found that dwarf GC stars display on average a Li content compatible with the Spite plateau, confirming cosmological Li problem. The works on NGC6397 and NGC6752 by Gruyters et al. (2013) and Gruyters et al. (2014) have however addressed this issue by considering as potential solution the combined effect of atomic diffusion and an hypothetical extra mixing process. In the following we will consider the recent analysis by Gruyters et al. (2014) of Li abundances in NGC6752, that has a [Fe/H] very close to the mean value of M54. These authors followed the same procedures applied to infer in NGC6397 (see Nordlander et al., 2012, for the latest work on this cluster). They measured the abundances of Li, and additional metals like Mg, Ca, Ti and Fe, in cluster stars from the main sequence turn off to the lower red giant branch, and compared the abundance trends along these evolutionary phases with results from stellar model calculations by Richard et al. (2002). The observed trends could be matched only by models where the effect of diffusion was modulated by an additional mixing that in Richard et al. (2002) calculations is modeled as a diffusive process with diffusion coefficient chosen as
| (1) |
where is the atomic diffusion coefficient of He at a reference temperature , and is the density of the stellar model at the same temperature. This is a somewhat ad-hoc prescription, with the proportionality constant , and the steep dependence on being essentially free parameters. A justification for the choice of the steep dependence on stems from the need to restrict the efficiency of this mixing to a narrow region below the outer convection zone, as suggested by the solar beryllium abundance, believed to be essentially unaltered since the formation of the solar system. The temperature is also a free parameter, that determines the depth where this diffusive mixing is most effective. It is important to remark that so far there has not been any attempt to test whether this mixing prescription can be associated to a well established physical process like, i.e., rotationally induced mixing. Assuming that the prescription in Eq. 1 is realistic, Gruyters et al. (2014) found that the free parameter has to be set to log()=6.2 to match the observed abundance trends for NGC6752, resulting in =2.530.10, within less than 2 of the BBN predictions.
To our purposes it is relevant to notice that when log()=6.2, the lower RGB abundances of Richard et al. (2005) models decrease by 0.1 dex compared to the case of pure diffusion, because during the main sequence additional Li is transported to the burning region by this extra mixing. If the same process and the same efficiency estimated for NGC6752 are assumed also for M54, we need to add the same amount to determined including efficient diffusion, thus obtaining 2.450.11 dex (or 2.530.11 dex when considering the NLTE corrections by Carlsson et al., 1994).
Given the current lack of identification of the proposed additional mixing with an established physical process, it is fair to say that we should be still cautious about this route to solve the cosmological Li problem, because simple parametric models have little predictive power. For example, to explain abundance trends in NGC6397, NGC6752 and M4 –and reconcile the measured with – one needs to employ a varying value of , generally increasing with increasing [Fe/H]. Whether or not this trend of with [Fe/H] is a sign of the inadequacy of this parametrization of the additional mixing, requires a deeper understanding of its origin.
Observationally, Gonzalez Hernandez et al. (2009) found a trend of the surface A(Li) with in NGC6397 that is not explainable with the additional mixing of Eq. 1. Also, as discussed by Dobrovolskas et al. (2014), the constant Li abundance observed among the stars in Omega Centauri (Monaco et al., 2010) spanning a wide range of ages and metallicities, and the Li distribution observed in 47 Tuc seem to require fine-tuned mechanisms that are at present difficult to explain with simple parametric diffusive mixing prescriptions.
5 Conclusions
We measured the surface Li abundance in lower RGB stars harboured by M54, a GC belonging to the Sgr dwarf galaxy. We have obtained = 0.930.11 dex, in agreement with measurements in Galactic halo stars. By considering the dilution due to the FDU, we have established an initial Li abundance of this stellar system (= 2.290.11 and 2.350.11 dex, without and with atomic diffusion, respectively) that is lower than the BBN value by 0.3 dex. The cluster can become compatible with within only assuming diffusion plus the additional mixing prescriptions by Richard et al. (2005) calibrated on the (same metallicity) Galactic GC NGC6752 (Gruyters et al., 2014). Alternatively, inadequacies of the BBN model used to derive cannot be totally ruled out.
Also, an important question can be addressed by our study:
is the Li problem a local problem, limited to our Galaxy, or is it independent
of the environment?
The analysis of the RGB stars in M54 confirms the findings in
Centauri (Monaco et al., 2010), considered as the remnant of an accreted
dwarf galaxy: the Li problem seems to be an universal problem, regardless
of the parent galaxy. The solution able to explain the discrepancy must work
both in the Milky Way and other galaxies, with different origins and star formation histories.
Thus, it seems unlikely that the scenario proposed by Piau et al. (2006), requiring that at least one third of
the Galactic halo has been processed by Population III, massive stars, can work in the same way
also in smaller systems like Sgr and Centauri (see also Prantzos, 2007).
The universality of the Spite plateau and the lower RGB abundances
is a constraint that must be satisfied by any theory aimed at solving the
cosmological Li problem.
We warmly thank the referee, Andreas Korn, for his detailed comments that have helped to improve the paper significantly. S.V. gratefully acknowledges the support provided by Fondecyt reg. N. 1130721.
References
- Alonso et al. (1999) Alonso, A. Arribas, S. & Martinez-Roger, C., 1999, A&AS, 140, 261
- Aoki et al. (2009) Aoki, W., et al., 2009, ApJ, 698, 1803
- Asplund et al. (2006) Asplund, M., Lambert, D. L., Nissen, P. E., Primas, F., & Smith, V. V., 2006, ApJ, 644, 229
- Bahcall et al. (1997) Bahcall, J. N.; Pinsonneault, M. H., Basu, S., & Christensen-Dalsgaard, J., 1997, PhRvL, 78, 171
- Bellazzini et al. (2008) Bellazzini, M., et al., 2008, AJ, 136, 1147
- Boesgaard et al. (1998) Boesgaard, A. M., Deliyannis, C. P., Stephens, A., & King, J. R., 1998, 493, 206
- Bonifacio & Molaro (1997) Bonifacio, P. & Molaro, P., 1997, MNRAS, 285, 847
- Bonifacio (2002) Bonifacio, P., 2002, A&A, 395, 515
- Bonifacio et al. (2007) Bonifacio, P., et al. 2007, A&A, 462, 851
- Carlsson et al. (1994) Carlsson, M., Rutten, R. J., Bruls, J. H. M. J., & Shchukina, N. G., 1994, A&A, 288, 860
- Carretta et al. (2010) Carretta, E., et al., 2010, A&A, 520, 95
- Coc et al. (2013) Coc, A., Uzan, J.-P., & Vangioni, E., 2013, arXiv1307.6955
- Cyburt et al. (2008) Cyburt, R. H., Fields, B. D., & Olive, K. A., 2008, J. Cosmol. Astro-Part. Phys., 11, 12
- Dobrovolskas et al. (2014) Dobrovolskas, V, Kucinskas, A., Bonifacio, P., Korotin, S. A., Steffen, M., Sbordone, L., Caffau, E., Ludwig, H.-G., Royer, F., & Prakapavicus, D., 2014, A&A, 565, 121
- D’Orazi et al. (2010) D’Orazi, V., Lucatello, S., Gratton, R., Bragaglia, A., Carretta, E., Shen, Z., & Zaggia, S., 2010, ApJ, 713L, 1
- D’Orazi et al. (2014) D’Orazi, V., Angelou, G. C., Gratton, R. G., Lattanzio, J C., Bragaglia, A., Carretta, E., Lucatello, S., & Momany, Y., 2014, ApJ, in press (arXiv:1406.5513)
- Gonzalez Hernandez et al. (2009) Gonzalez Hernandez, J. I., Bonifacio, P., Caffau, E., Steffen, M., Ludwig, H.-G., Behara, N. T., Sbordone, L., Cayrel, R., & Zaggia, S., 2009, A&A, 505L, 13
- Gratton et al. (1999) Gratton, R. G., Carretta, E., Eriksson, K., & Gustafsson, B., 1999, A&A, 350, 955
- Gratton et al. (2000) Gratton, R. G., Sneden, C., Carretta, E., & Bragaglia, A., 2000, A&A, 354, 169
- Gratton et al. (2012) Gratton, R. G., Carretta, E., & Bragaglia, A., 2012, A&ARv, 20, 50
- Gruyters et al. (2013) Gruyters, P., Korn, A. J., Richard, O., Grundahl, F., Collet, R., Mashonkina, L. I., Osorio, Y., & Barklem, P. S., 2013, A&A, 555, 31
- Gruyters et al. (2014) Gruyters, P., Nordlander, T., & Korn, A. J., 2014, arXiv1405-6543
- Hinshaw et al. (2013) Hinshaw, G., et al., 2013, ApJS, 208, 19
- Hosford et al. (2009) Hosford, A., Ryan, S. G., Garcia Perez, A. E., Norris, J. E., & Olive, K. A., 2009, A&A, 493, 601
- Korn et al. (2006) Korn, A. J., et al., 2006, Nature, 442, 657
- Iocco et al. (2009) Iocco, F., Mangano, G., Miele G., Pisanti, O., & Serpico, P. D., 2009, PhR, 472, 1
- Layden & Sarajedini (2000) Layden, A. C., & Sarajedini, A., 2000, AJ, 119, 1760
- Lind et al. (2008) Lind, K., Asplund, M., Barklem, P. S., & Belyaev, A. K., 2008, A&A, 528, 103
- Lind et al. (2009) Lind, K., Primas, F., Charbonnel, C., Grundahl, F., & Asplund, M., 2009, 503, 545
- Lind et al. (2011) Lind, K., Asplund, M., Barklem, P. S., & Belyaev, A. K., 2011, A&A, 528, 103
- McCall (2004) McCall, M. L., 2004, AJ, 128, 2144
- Melendez et al. (2010) Melendez, J., Casagrande, L., Ramirez, I., Asplund, M. & Schuster, W. J., 2010, A&A, 515, L3
- Monaco et al. (2002) Monaco, L., Ferraro, F. R., Bellazzini, M., & Pancino, E., 2002, ApJ, 578L, 47
- Monaco et al. (2004) Monaco, L., Bellazzini, M., Ferraro, F. R., & Pancino, E., 2004, MNRAS, 353, 874
- Monaco et al. (2005) Monaco, L., Bellazzini, M., Ferraro, F. R., & Pancino, E., 2005, MNRAS, 356, 1396
- Monaco et al. (2010) Monaco, L., Bonifacio, P., Sbordone, L., Villanova, S., & Pancino, E., 2010, A&A, 519L, 3
- Monaco et al. (2012) Monaco, L., Villanova, S., Bonifacio, P., Caffau, E., Geisler, D., Marconi, G., Momany, Y., & Ludwig, H.-G., 2012, A&A, 539, 157
- Mucciarelli et al. (2011) Mucciarelli, A., Salaris, M., Lovisi, L., Ferraro, F. R., Lanzoni, B., Lucatello, S., & Gratton, R. G., 2011, MNRAS, 412, 81
- Mucciarelli, Salaris & Bonifacio (2012) Mucciarelli, A., Salaris, M. & Bonifacio, P., 2012, MNRAS, 419, 2195
- Mucciarelli et al. (2013) Mucciarelli, A., Pancino, E., Lovisi, L., Ferraro, F. R., & Lapenna, E., 2013, ApJ, 766, 78
- Nordlander et al. (2012) Nordlander, T., Korn, A. J., Richard, O., & LInd, K., 2012, ApJ, 753, 48
- Pasquini et al. (2002) Pasquini, L., 2002, The Messenger, 110, 1
- Piau et al. (2006) Piau, L. et al., 2006, ApJ, 653, 300
- Pietrinferni et al. (2006) Pietrinferni, A., Cassisi, S., Salaris, M., & Castelli, F., 2006, ApJ, 642, 797
- Planck collaboration (2013) Planck Collaboration, 2013, arXiv1203.5076
- Prantzos (2007) Prantzos, N., 2007, SSRv, 130, 27
- Rebolo et al. (1988) Rebolo, R., Beckman, J. E., & Molaro, P., 1988, A&A, 192, 192
- Richard et al. (2002) Richard, O., Michaud, G., & Richer, J., 2002, ApJ, 580, 1100
- Richard et al. (2005) Richard, O., Michaud, G., & Richer, J., 2005, ApJ, 619, 538
- Sbordone et al. (2004) Sbordone, L., Bonifacio, P., Castelli, F., & Kurucz, R. L., 2004, MSAIS, 5, 93
- Shen et al. (2010) Shen, Z.-X., Bonifacio, P., Pasquini, L., & Zaggia, S., 2010, A&A, 524L, 2
- Siegel et al. (2007) Siegel, M. H., et al., 2007, ApJ, 667L, 57
- Spergel et al. (2007) Spergel, D. N., et al., 2007, ApJS, 170, 377
- Spite & Spite (1982) Spite, M., & Spite, F., 1982, Nature, 297, 483
- Stetson & Pancino (2008) Stetson, P. & Pancino, E., 2008, PASP, 120, 1332
- Villanova & Geisler (2011) Villanova, S. & Geisler, D., 2011, A&A, 535, 31
| ID | RA | Dec | log g | RV | [Fe/H] | [Na/Fe] | flag | |
|---|---|---|---|---|---|---|---|---|
| (J2000) | (J2000) | (K) | (km/s) | (dex) | (dex) | |||
| 6750 | 283.7948303 | -30.4990501 | 5010 | 2.50 | 130.5 | -1.75 | -0.56 | M54 |
| 7590 | 283.7933655 | -30.4935970 | 5010 | 2.51 | 140.9 | -1.65 | 0.38 | M54 |
| 12291 | 283.7864380 | -30.5019646 | 4987 | 2.47 | 151.8 | -2.00 | -0.40 | M54 |
| 21190 | 283.7769165 | -30.5052319 | 4921 | 2.40 | 135.7 | -1.74 | 0.16 | M54 |
| 51661 | 283.7530823 | -30.5037270 | 4916 | 2.41 | 148.5 | -0.34 | -0.48 | Sgr |
| 53985 | 283.7514343 | -30.4937611 | 4936 | 2.37 | 149.1 | -1.74 | 0.09 | M54 |
| 56686 | 283.7486572 | -30.5045719 | 5018 | 2.45 | 141.6 | -1.42 | 0.25 | M54 |
| 65022 | 283.7391968 | -30.5047073 | 5046 | 2.52 | 149.3 | -1.24 | 0.46 | Sgr |
| 69373 | 283.7333679 | -30.4932117 | 4977 | 2.37 | 144.5 | -1.56 | -0.21 | M54 |
| 75429 | 283.7950134 | -30.4848213 | 5028 | 2.50 | 149.3 | -1.58 | -0.19 | M54 |
| 86412 | 283.7847900 | -30.4922523 | 5079 | 2.56 | 146.1 | -1.95 | 0.58 | M54 |
| 91967 | 283.7814636 | -30.4800529 | 4975 | 2.42 | 142.1 | -1.86 | 0.47 | M54 |
| 121249 | 283.7685242 | -30.4917202 | 4873 | 2.32 | 153.5 | -1.86 | -0.07 | M54 |
| 141357 | 283.7619019 | -30.4915009 | 5023 | 2.51 | 146.1 | -1.87 | 0.25 | M54 |
| 155785 | 283.7575684 | -30.4852924 | 5023 | 2.43 | 141.1 | -1.66 | 0.26 | M54 |
| 201571 | 283.7276917 | -30.4915905 | 5015 | 2.46 | 144.4 | -0.96 | 0.04 | Sgr |
| 208256 | 283.7915344 | -30.4739513 | 5082 | 2.54 | 143.7 | -1.93 | 0.16 | M54 |
| 216867 | 283.7841797 | -30.4684467 | 5007 | 2.47 | 142.7 | -1.79 | 0.23 | M54 |
| 231677 | 283.7753906 | -30.4778271 | 5048 | 2.55 | 136.0 | -1.70 | -0.22 | M54 |
| 235280 | 283.7738342 | -30.4735279 | 5056 | 2.54 | 147.3 | -1.66 | 0.53 | M54 |
| 279832 | 283.7575073 | -30.4666042 | 5090 | 2.56 | 148.6 | -1.79 | 0.58 | M54 |
| 299467 | 283.7481689 | -30.4728985 | 4960 | 2.36 | 149.6 | -1.72 | 0.27 | M54 |
| 304691 | 283.7450256 | -30.4665394 | 5005 | 2.48 | 139.0 | -1.31 | 0.18 | M54 |
| 315861 | 283.7359009 | -30.4745407 | 5025 | 2.50 | 140.6 | -1.60 | -0.07 | M54 |
| 335718 | 283.7800903 | -30.4574833 | 5005 | 2.52 | 150.1 | -1.67 | -0.28 | M54 |
| 340297 | 283.7754211 | -30.4570541 | 4980 | 2.47 | 136.6 | -1.63 | -0.14 | M54 |
| 342644 | 283.7732849 | -30.4543114 | 5018 | 2.42 | 142.6 | -1.62 | 0.10 | M54 |
| 348795 | 283.7681274 | -30.4567890 | 5002 | 2.41 | 149.6 | -1.73 | 0.30 | M54 |
| 356601 | 283.7614441 | -30.4637871 | 5025 | 2.46 | 145.1 | -1.59 | 0.53 | M54 |
| 358028 | 283.7607117 | -30.4514027 | 4928 | 2.36 | 144.2 | -1.66 | 0.01 | M54 |
| 359389 | 283.7593689 | -30.4573898 | 5051 | 2.48 | 147.2 | -1.37 | -0.14 | M54 |
| 379953 | 283.7375183 | -30.4624958 | 5048 | 2.49 | 137.9 | -0.90 | -0.14 | Sgr |
| 1031659 | 283.7920227 | -30.4277306 | 5002 | 2.38 | 161.6 | -1.15 | -0.07 | Sgr |
| 1031785 | 283.7452393 | -30.5135555 | 5030 | 2.40 | 136.6 | -1.12 | 0.03 | Sgr |
| 1032003 | 283.8471985 | -30.3341923 | 5012 | 2.39 | 140.1 | -0.71 | 0.21 | Sgr |
| 1032576 | 283.7683716 | -30.4011650 | 4995 | 2.39 | 177.8 | -1.25 | -0.29 | Sgr |
| 1032677 | 283.6716309 | -30.3297195 | 5033 | 2.41 | 151.0 | -0.86 | -0.15 | Sgr |
| 1033129 | 283.5857239 | -30.4534187 | 4878 | 2.34 | 150.6 | -0.79 | — | Sgr |
| 1033207 | 283.7309570 | -30.5093040 | 5077 | 2.43 | 137.6 | -0.90 | -0.50 | Sgr |
| 1033253 | 283.7126770 | -30.3716583 | 4864 | 2.33 | 145.8 | -0.88 | -0.71 | Sgr |
| 1033431 | 283.7608337 | -30.6025276 | 4897 | 2.35 | 165.9 | -1.14 | -0.05 | Sgr |
| 1033794 | 283.8335571 | -30.6086063 | 4953 | 2.38 | 142.7 | — | — | Sgr |
| 1033808 | 283.6697998 | -30.5691261 | 4975 | 2.39 | 144.7 | -0.91 | 0.03 | Sgr |
| 1034001 | 283.7369385 | -30.4347324 | 4914 | 2.37 | 146.6 | -1.68 | -0.48 | M54 |
| 1034068 | 283.7054138 | -30.4942036 | 4982 | 2.40 | 141.2 | -1.67 | 0.54 | M54 |
| 1034166 | 283.6147766 | -30.5109158 | 5074 | 2.44 | 102.8 | -0.95 | 0.44 | Sgr |
| 1034215 | 283.6256104 | -30.4640865 | 4883 | 2.35 | 162.6 | -0.56 | -0.49 | Sgr |
| 1034363 | 283.7250061 | -30.4443989 | 4980 | 2.40 | 146.5 | -1.48 | 0.24 | M54 |
| 1034592 | 283.8386841 | -30.4815445 | 4878 | 2.36 | 159.7 | -0.47 | -0.68 | Sgr |
| 1034628 | 283.8795471 | -30.3539162 | 4990 | 2.41 | 144.3 | -1.00 | -0.62 | Sgr |
| 1034807 | 283.7220154 | -30.3370037 | 4627 | 2.32 | 147.1 | -0.46 | -0.49 | Sgr |
| 1034871 | 283.6983032 | -30.4932556 | 5002 | 2.42 | 148.2 | -1.74 | 0.77 | M54 |
| 1035051 | 283.5896912 | -30.4579124 | 4975 | 2.41 | 149.7 | -0.94 | -0.98 | Sgr |
| 1035061 | 283.8948059 | -30.4827633 | 4678 | 2.36 | 155.8 | -0.83 | -0.55 | Sgr |
| 1035450 | 283.7792969 | -30.5218792 | 5074 | 2.46 | 142.8 | -0.94 | 0.33 | Sgr |
| 1035614 | 283.6965637 | -30.4720631 | 4706 | 2.38 | 141.5 | -0.55 | -0.71 | Sgr |
| 1035639 | 283.9363708 | -30.3593540 | 4777 | 2.42 | 138.1 | -0.55 | — | Sgr |
| 1035659 | 283.8937683 | -30.5231647 | 5015 | 2.44 | 143.6 | -1.77 | -0.15 | M54 |
| 1035689 | 283.6646118 | -30.4083195 | 4892 | 2.38 | 125.6 | -1.75 | 0.24 | M54 |
Identification numbers, coordinates, effective temperature, surface gravity, radial velocity, [Fe/H] and [Na/Fe] abundances. Final flag indicates the membership to M54 or to Sgr. ID RA Dec log g RV [Fe/H] [Na/Fe] flag (J2000) (J2000) (K) (km/s) (dex) (dex) 1035733 283.6871338 -30.5677834 5074 2.46 140.8 -0.90 0.23 Sgr 1035834 283.7239990 -30.4563236 4985 2.43 141.3 -1.55 -0.27 M54 1035938 283.7536316 -30.4476051 4997 2.43 123.1 -1.74 -0.32 M54 1035965 283.6389771 -30.5077534 4670 2.36 147.7 -0.39 — Sgr 1036018 283.7001953 -30.5760975 4738 2.40 140.0 0.07 -0.40 Sgr 1036558 283.7184753 -30.4782505 4933 2.41 138.1 -1.66 -0.03 M54 1036741 283.7993469 -30.4916420 5015 2.45 137.5 -1.66 0.06 M54 1036890 283.8543091 -30.5144444 4716 2.40 116.0 -1.04 -0.24 Sgr 1037256 283.9817505 -30.4822559 4660 2.38 146.0 -0.56 -0.43 Sgr 1037298 283.7445984 -30.5185242 4911 2.41 158.1 -0.96 0.15 Sgr 1037347 283.5868835 -30.5343914 4747 2.43 151.9 0.24 0.15 Sgr 1037357 283.7287598 -30.3941364 4938 2.42 144.0 -1.55 0.27 M54 1037383 283.7582397 -30.4474907 5007 2.46 151.0 -1.58 0.38 M54 1037405 283.8029785 -30.6097832 4972 2.44 145.7 -1.40 — M54 1037499 283.9023132 -30.5804310 5082 2.49 132.9 -1.15 — Sgr 1037755 283.8068848 -30.4766140 5023 2.47 143.1 -1.50 0.27 M54 1037842 283.6522827 -30.4114075 4773 2.45 149.4 -0.84 -0.16 Sgr 1037956 283.7883301 -30.5176754 5087 2.50 129.4 -1.62 0.51 M54 1038371 283.7473450 -30.4219704 4687 2.41 130.4 -0.82 -0.78 Sgr 1038827 283.7271729 -30.4614105 5018 2.48 145.7 -1.64 0.07 M54 1038900 283.9519348 -30.5770645 4682 2.41 143.3 -0.30 -0.47 Sgr 1039247 283.7293701 -30.5351334 4972 2.46 146.1 -1.52 0.34 M54 1039380 283.6416626 -30.4188614 4764 2.46 123.5 -0.65 -0.26 Sgr 1039482 283.9963989 -30.4818535 4782 2.47 138.4 -0.64 — Sgr 1039645 283.7586670 -30.5772209 4800 2.48 133.7 -0.27 -0.47 Sgr 1040277 283.8876648 -30.4286728 4807 2.49 142.9 -0.61 -0.49 Sgr 1040695 283.8935852 -30.6129131 4775 2.48 159.6 -0.10 — Sgr 1040996 283.7201233 -30.5874443 4716 2.45 143.2 -0.47 -0.87 Sgr 1041212 283.7241211 -30.5361309 5043 2.52 144.3 -1.03 -0.09 Sgr 1041214 284.0014343 -30.5138874 4816 2.51 142.7 -0.06 — Sgr 1041231 283.7814636 -30.6557369 4682 2.44 140.2 — — Sgr 1041308 283.8000793 -30.4399662 5046 2.52 149.8 -1.75 0.06 M54 1041392 283.7596741 -30.6370296 4798 2.50 160.3 0.52 -0.78 Sgr 1041896 283.8808899 -30.4472752 4718 2.47 133.9 -0.66 -0.52 Sgr 1041905 283.8525391 -30.4917564 4784 2.50 146.9 -0.61 -0.56 Sgr 1042086 283.8047180 -30.4664555 5020 2.52 142.2 -1.99 0.59 M54 1042102 283.7253723 -30.4827061 5085 2.55 143.9 -0.92 — Sgr 1042123 283.7680359 -30.4397469 4916 2.47 141.1 -1.77 -0.11 M54 1042352 283.6452942 -30.4793129 4904 2.47 165.3 -1.25 -0.03 Sgr 1042739 283.7419739 -30.4234066 4950 2.49 146.3 -1.47 -0.22 M54 1043020 283.7697144 -30.5278034 4987 2.52 141.2 -1.87 — M54 1043447 283.7137451 -30.3280296 4995 2.52 154.8 -1.51 -0.21 M54