The Luminous Convolution Model as an alternative to dark matter in spiral galaxies
Abstract
The Luminous Convolution Model (LCM) demonstrates that it is possible to predict the rotation curves of spiral galaxies directly from estimates of the luminous matter. We consider two frame-dependent effects on the light observed from other galaxies: relative velocity and relative curvature. With one free parameter, we predict the rotation curves of twenty-three (23) galaxies represented in forty-two (42) data sets. Relative curvature effects rely upon knowledge of both the gravitational potential from luminous mass of the emitting galaxy and the receiving galaxy, and so each emitter galaxy is compared to four (4) different Milky Way luminous mass models. On average in this sample, the LCM is more successful than either dark matter or modified gravity models in fitting the observed rotation curve data.
Implications of LCM constraints on populations synthesis modeling are discussed in this paper. This paper substantially expands the results in arXiv:1309.7370.
keywords:
cosmology: dark matter, theory; galaxies: distances and redshifts, Dark matter - galaxies: Stellar dynamics and kinematics - galaxies: Modified theories of gravity: Spiral Galaxies1 INTRODUCTION
Flat rotation-curve observations from spiral galaxies have been the smoking gun for theories of missing mass or new laws of gravity since the 1970’s (Rubin
et al., 1978; Bosma, 1978). There are two fundamental observables involved in the flat rotation-curve problem: photometry and spectra.
Photometry is the measurement of the total light, in a specific wavelength band, which is interpreted as mass through a population synthesis model. The visible mass then yields orbital velocities by Newton’s second law and the expected Keplerian fall-off at large radii. The second observable is Doppler-shifted spectra from characteristic atomic transitions, which imply the dynamical
mass by the relation between the orbital velocities (from the Lorentz Doppler-shift formula) and the Poisson equation. These two observables predict very different mass content, since rotation curves from spectra do not fall off in a Keplerian sense at large radii. The most popular theories to explain the conflicting observations are missing mass or new laws of gravity.
The missing mass, commonly called dark matter, invokes a new particle which does not interact electromagnetically, and hence is “dark.” New laws of physics commonly work on the principle that our understanding of gravity, via General Relativity, is incomplete on extra-galactic distance scales.
Examples of dark matter theories include the psuedo-isothermal dark matter halo model (ISO) (Kamionkowski &
Kinkhabwala, 1998) and the Navarro, Frenk & White (NFW) (Navarro
et al., 1997) dark matter halo model. Examples of new laws of gravity include modified Newtonian dynamics (MOND) (Milgrom, 1983), non-local gravity (Rahvar &
Mashoon, 2014) and conformal relativity (Mannheim &
O’Brien, 1997). For a full review of NFW or MOND approaches see Sanders &
McGaugh (2002); Gianfranco
et al. (2005). MOND successfully predicts core densities, the baryonic Tully-Fisher relation, and rotation curves. Dark matter theories are the standard for interpreting flat rotation-curves and form the basis of a comprehensive
cosmology. But the fact remains that neither class of theory, dark particles or deviations from General Relativity, has been observed in decisive terrestrial experiments and neither has resulted in a full and rigorously computed set of population synthesis models (de Blok
et al., 2008). Dark matter may have been observed in the DAMA (Bernabei
et al., 2010), CoGeNT (Aalseth
et al., 2013), and CDMS (Agnese et al., 2013) experiments, although these results are in some conflict with the limits of XENON100 (Angle et al., 2008).
It is a common feature of rotation curves that galaxies smaller than the Milky Way are ‘dark-matter dominated’ (ascending rotation curves) and galaxies larger than the Milky Way have minimal dark matter halos (descending rotation curves). Classification of galaxies based on the relative size of the dark matter halo is called the universal rotation curve (Rubin
et al., 1980; Persic &
Salucci, 1988, 1990). Since a priori there appears to be no physical reason for the Milky Way to occupy the median point in this dark matter halo distribution, we interpret the universal rotation curve as indicating frame-dependent effects in rotation curve observations.
Currently the Doppler-shifted spectra are interpreted to imply only frame-dependent effects from relative velocity. However, it is known from classical electrodynamic theory that effects on light naturally divide mathematically between those from relative velocity and those from relative acceleration111of the emitter with respect to the receiver frame (see Jackson, 1999, Eqs. (14.13) & (14.14)). In the context of Relativistic kinematics we replace the word “acceleration” with “curvature.” The Luminous Convolution Model (LCM) is an empirical formula for predicting flat rotation curves based on interpreting the Doppler-shifted spectra as having two contributions: relative velocity and relative curvature. LCM curvature effects are quantified via the gravitational redshifts for the respective luminous matter content of the emitter and receiver galaxies, and rephrased in kinematical terms using equivalent Doppler-shifts.
A sample of twenty-three galaxies from forty-two different data sets, and four different Milky Way luminous mass models will be used to demonstrate the utility of the LCM to constrain luminous mass modeling. Comparisons are made to reported mass-to-light ratios from dark matter and MOND models, and differing distance indicators are noted. The highest resolution rotation curve data are presented here along with the older standards in the field of spiral-galaxy rotation-curve studies. The LCM has one free parameter that is dimensionless and does not yet have a physical interpretation. The LCM successfully predicts rotation curves across a broad range of galaxy sizes and morphologies. In this paper we allow the fits to scale the given mass-to-light ratios and gas fractions reported by the reference data sets, within a fixed range. Our analysis is focused on the high symmetry case of spiral galaxies in the plane of the galactic disk. While the LCM mapping can be extended to an arbitrary metric (Cisneros et al., 2013) to predict other astrophysical observations, such studies are beyond the scope of the current paper. On average for the data studied in this paper, the LCM rotation curve fits are better than MOND or dark matter model fits, returning reasonable estimates of stellar and gas masses.
2 ROTATION CURVES OF SPIRAL GALAXIES
2.1 Velocity addition formulae
In dark matter halo theories the total dynamical mass as a function of radius is a sum of the luminous mass and the dark matter halo mass :
| (1) |
The mass components are then related to Poisson law forces for the appropriate geometry. Stellar disks and gas distributions are generally modeled as exponential profiles and dark matter halos and stellar bulges are modeled as spherical. The associated sum of forces then yields a sum of centripetal accelerations, , attributed to each component. Orbital velocities are generally treated as those experienced by a test particle at some radius from the center of the mass distribution, assumed to be in a stable, circular orbit. The total velocity is taken to be a quadratic sum of the contributions from the luminous and the dark halo velocities:
| (2) |
All velocities are functions of the radius. The predicted total velocity is fit to the observed rotation curve .
For a rotation curve observation made using a well-known atomic transition, having a frequency in the observer’s rest-frame and Doppler-shifted frequency , the observed rotation curve is:
| (3) |
This is the standard Lorentz Doppler-shift formula.
2.1.1 Assumption of spherical symmetry as a final approximation
Forces associated with each of the mass components in Eq. 1 (gas, stellar disk and bulge, and dark matter halo) come individually from the solution to a classical Poisson equation for a given geometry. Dark matter halos and stellar bulges are generally modeled as spherical, whereas stellar disks and gas distributions are modeled as exponential disks with Bessel functions. Since the mass sum and the resulting sum of centripetal accelerations are not functionally dependent on in the same way (Binney & Tremaine, 2008), the quadratic velocity sum in Eq. 2 is a simplifying assumption of spherical symmetry.
Rotation curve derivations based on concentric rings also employ the assumption of spherical symmetry, so that the Gaussian shell technique can be used (Fraternali et al., 2011). Luminous mass modeling relies on the assumption of spherical symmetry as a final approximation as well, to sum the contributions to the gravitational potential from the terms calculated in their respective geometries (Xue et al., 2008; Klypin et al., 2002). The logic of invoking this assumption is that the error introduced by assuming spherical geometry for gravitational potentials calculated with disk geometries is a difference in magnitudes, not functional line shape with respect to radius (Chatterjee, 1987).
The spherical assumption is beneficial computationally and conceptually. Since the flat rotation-curve problem is clearly a functional difference at large radii, this approximation cannot be responsible for the rotation curve velocities. Since the assumption of spherical symmetry is commonly used as a final approximation in evaluating spiral galaxies, we will use this assumption in the LCM derivation (section 3) in the same ways .
2.1.2 LCM velocity addition formula
In the LCM, the observed Doppler-shifted frequencies in Eq. 3 are posited to include two contributions: relative velocity and relative curvature. Since these frequency shifts are reported as the total rotation velocity, , we phrase our arguments kinematically, including contributions to the relative curvature in terms of equivalent Doppler-shifts. It is clear from the work of Cisneros et al. (2012) and Radosz et al. (2013) that curvature effects on light can be cast in purely kinematical terms.
Since dark matter theories are based on classical Newtonian and Relativistic gravity, we co-op the dark matter halo velocity addition formula in Eq. 2, to represent the contributions from relative velocity and relative curvature to the total frequency shifts by replacing the dark matter contribution with a relative curvature term :
| (4) |
for , the relative velocity contribution; is a dimensionless, free parameter (see Fig. 7), and is the total rotation velocity.
Relative velocity and relative curvature effects are calculated using only the luminous matter as reported in the cited literature, consistent with photometry and population synthesis modeling. In this way, by recasting the curvature contributions, using the associated gravitational redshifts as a function of radius to get the equivalent Doppler-shifts, the relative velocity and relative curvature are represented by the kinematics of the Lorentz group.
2.2 Luminous mass modeling
Luminous matter modeling in spiral galaxies is an under-constrained field of study (Conroy et al., 2009). Dark matter models and MOND are commonly used as constraints on luminous matter modeling. Fig. 1 compares original reported luminous profiles, fit with dark matter and MOND models, from fourteen () of the galaxies in our sample. As can be seen in the figure, neither class of model demonstrates consistent predictions of the luminous mass in a given galaxy.
Estimates of the total luminous galaxy mass, , commonly include the masses of gas and dust, , stellar bulge, and disk, ,
| (5) |
Measurements of the individual component come from a variety of observations for the surface brightness profiles at many wavelengths. The dominant gas mass is contributed by atomic hydrogen, H I, observed at -cm and by molecular gas, observed through CO rotational lines in the mm-regime. Generally, it is assumed that the -cm line is optically thin in which case it can be translated directly into a column density of H I. Estimates of the effects of optical depth (e.g. Braun et al. (2009)) imply that the actual H I column density could be higher by up to , but this likely is dependent on the inclination of the galaxy. In the case of CO, various elaborate calibration methods have led to a conversion factor of CO intensity to a molecular hydrogen column density. This has an associated uncertainty of up to a factor of two. Generally, molecular gas surface densities are higher in the inner disks of galaxies and H I column densities in the outer disks of galaxies. In terms of ionized gas, the only substantial mass is contributed by a diffuse ionized medium. The column density of this ionized medium is about of that of the H I column in the solar neighborhood. Because it is only possible to obtain column density estimates in the Milky Way for this gas (from pulsar dispersion measurements), it is usually ignored in rotation curve modeling. Other ionized gas phases in H II regions and hot X-ray emitting plasmas contribute little mass. The derived gas column densities are generally corrected for the presence of helium, by a factor of approximately 1.4. Lastly, the dust-to-gas ratio in the interstellar gas is only about so dust masses may be ignored in rotation curve modeling. (R. A. M. Walterbos, personal communication, 2014)
Associating a mass surface density with the observed light profiles of the stellar components involves a suite of modeling assumptions used to reproduce the observed light intensity in various bands. The conversion of light into stellar mass generally depends on the age(s) of the stellar populations present, their metallicities, corrections for obscuration by dust and the inclination of the galaxy. The stellar populations present are a consequence of the star formation history, the initial mass function, and the evolutionary history of the galaxy. The most important of these factors are included in a population synthesis model (PSM) that is matched to the observed light distribution in various colors to yield a mass-to-light ratio (M/L). Conversion of light into masses by the M/L is the largest uncertainty in luminous matter modeling (Randriamampandry & Carignan, 2014) as evidenced by the variations in Fig. 1.
After the appropriate Poisson’s law forces are calculated for each galaxy component in Eq. (5), the orbital velocities are added in quadrature by the assumption of spherical symmetry:
| (6) |
The orbital rotation velocity associated with the gas mass is , with the stellar bulge mass is and with the stellar disk mass is .
3 Lorentz kinematics and the LCM derivation
The LCM construction is based upon a careful identification of the relationship between the local flat frames where physical measurements are made and the underlying curved manifolds. It is known from the differential geometry of General Relativity, that sufficiently precise measurements in the local flat frames can completely specify the underlying curved manifold’s metric.
In the flat rotation-curve problem, we assume spectra are such sufficiently precise measurements, and that our local observations of the visible extent of spiral galaxies gives enough information to determine the underlying global curvatures of the emitter and receiver galaxies from their baryonic masses.
3.1 Curvatures from luminous mass
Curvatures in Schwarzschild metric space-times are indicated by gravitational redshift effects on photon frequencies:
| (7) |
where is the characteristic photon frequency as defined in section 2, is the shifted frequency222 as received by a stationary observer at asymptotic infinity. The time coefficient of the Schwarzschild metric is :
| (8) |
where is Newton’s constant of gravity, is the enclosed mass at some radial distance from the center of the mass distribution, and is the vacuum light speed.
In the weak field limit (Hartle, 2003) the metric coefficient becomes:
| (9) |
where is the Newtonian scalar gravitational potential.
Spiral galaxies are treated as weak fields due to the diffuse nature of the luminous mass distributions, such that dark matter theories are based on Newtonian kinematics and Special Relativistic interpretations of spectra. To extend these flat space-time concepts to the slightly curved frames of spiral galaxies, we will make the following two caveats.
3.1.1 Assumption
The exterior Schwarzschild metric is a vacuum solution to Einstein’s equations, intended for use outside the central mass that is generating the curvature. By invoking the simplifying assumption of spherical symmetry generally used in galaxy analysis (see section 2), Gauss’s law for spherical mass distributions (Fowles & Cassidy, 2005) becomes a valid approximation. Therefore, at each radius , all mass elements external to cancel by symmetry, such that the exterior Schwarzschild metric exactly satisfies the Einstein equations as a vacuum solution. Note that any theory using this approximation necessarily loses information at small radii where tidal forces dominate or in the presence of severe symmetry breaking features. Since the flat rotation-curve problem is one of large radii, we find this to be an acceptable approximation to first order. Each galaxy manifold can be viewed as foliations of Schwarzschild solutions with increasing radii.
In practice this assumption results in summing the stellar and gas contributions to the gravitational potential in Eq. 9 under the assumption of spherical symmetry, though the contributions are individually calculated in the correct geometric Poisson equation. This approach is consistent with the standard treatment of gravitational potentials in rotation curve calculations (Xue et al., 2008; Klypin et al., 2002) because, to good approximation, deviations from spherical symmetry are higher order corrections to the gravitational potential (Binney & Tremaine, 2008; Chatterjee, 1987).
3.1.2 Assumption
The gravitational potential, , which parametrizes the curvatures of interest in Eq. 9, is defined as an integral over the Newtonian force :
| (10) |
where is the force per unit mass for each individual luminous mass component, and is the integration constant of interest.
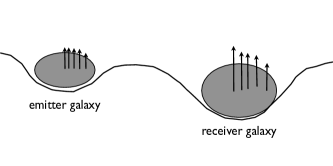
This integration constant is generally set such that the potential as . However, when considering two arbitrary galaxies333the emitter galaxy and the receiver galaxy (Milky Way), connected by a single photon, it is a violation of energy conservation to set the respective integration constants to different values. We select a single universal value for the integration constant, taken to be zero, though a more physical choice may be found in future dark energy research. Physically, this means that at large the gravitational potentials go to small but non-zero values.
3.2 The convolution function
The LCM mapping term, , is composed of three terms:
| (11) |
where is the curvature ratio, and and are successive Lorentz transformations.
We then normalize the mapping, , by its value as , , such that the relative curvature term in Eq. 4 is:
| (12) |
3.2.1 The LCM curvature ratio:
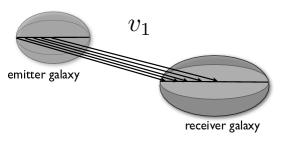
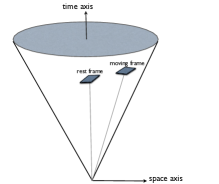
In traditional Lorentz transformations all frames are symmetric with respect to the coordinate time for the rapidity angle, . Since Lorentz transformation are used to interpret spectra with respect to the coordinate time of the Milky Way, we need a rule to re-express the coordinate time of the emitting galaxy in terms of that of the Milky Way. This is done with the curvature ratio , which is based upon the idea of coordinate light speeds . Fig. 2 shows how time is affected by the underlying curvature of space.
Coordinate light speeds are a physical indicator of curvature; the degree to which indicate the increase in path length due to curvature (Narayan et al., 1997). As viewed by an external observer at asymptotic infinity, who can not see manifest curvature but has knowledge of the line-of-sight travel distance of the light, curvature is indicated by the difference between the vacuum light speed and the measured coordinate light speed, .
Coordinate light speeds arise in the solution to the wave equation for light (Cisneros et al., 2012). In the Schwarzschild case, the effective index of refraction, , relates the two light speeds:
| (13) |
by the gravitational redshift (Eq. 7).
The ratio scales the coordinate time of the emitter galaxy relative to that of the Milky Way in terms of deviations from flatness as a function of radius:
| (14) |
where and are the respective coordinate light speeds of the emitter and receiver galaxies. The value of the ratio at the limit of the data, , approximates the value when when all the luminous mass is enclosed.
3.2.2 Equivalent Lorentz Doppler-shift formula
The most general form of the Lorentz transformation is the exponential mapping:
| (15) |
where is the product of the rapidity angle and the generator of the rotation . The rapidity angle defines the relationship between two frames in the hyperbolic space-time of Special Relativity.
The Doppler-shift formula in Eq. 3 comes from such a Lorentz transformation. In hyperbolic form, the Lorentz transformation matrix for a boost in the direction is
| (20) | ||||
| (25) |
This form yields the Lorentz Doppler-shift formula by rotating a photon’s 4-vector through , where , is the wavelength, and the indices of the spatial basis are . The hyperbolic form of the Lorentz Doppler-shift formula for line of sight photons is:
| (26) |
We can extend this formalism to the mapping of the small relative curvatures between a pair of emitter and receiver galaxies. The resulting parameter from Eq. 26 will relate the emitter to receiver galaxy, and should not to be confused with a physical speed.
To generalize the Doppler formula as given in Eq. 26, we identify the mapping factor with the ratio of the received to emitted frequencies, . In Special Relativity the two frames are symmetric, so it is meaningless to pin frequencies to specific frames. However, transitioning to gently curved frames it becomes necessary to consistently identify the mapping factor.
In what follows, we always identify the numerator with the receiver’s reference frame and the denominator with the emitter’s reference frame:
| (27) |
3.2.3 Mapping
The first LCM term, , looks at the gravitational redshift frequencies (Eq. 7) and rephrases them in terms of an equivalent Doppler-shift formula via Lorentz transformations. This term is a 2-frame map of the emitting and receiving galaxies, created by their respective gravitational potentials from luminous mass.
By the convention in Eq. 27, the curved 2-frame mapping factor is:
| (28) |
for the redshift frequencies of the emitter galaxy, , and the receiver galaxy, .
3.2.4 Mapping
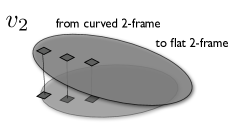
The second LCM term, , looks at the requisite transformation from the curved 2-frame (indicated by Eq. 28) to the flat 2-frame where physical measurements are made. Fig. 4 gives a visual of such a mapping. The term is also phrased in terms of an equivalent Doppler-shift via Lorentz transformations. That observations are always made in flat frames is demonstrated by the constancy of the local speed of light as measured by all observers.
We define the flat frames by those frequencies which wouldhave been measured if the Keplerian rotation curve velocities from the luminous mass in Eq. 6 were observed. Keplerian velocities are calculated in a purely Newtonian context and so describe our best understanding of the absence of all curvature. The shifted frequencies are defined by:
| (30) |
for the characteristic frequency defined in Eq. 3. Consistent with in Eq. 27, the flat 2-frame mapping factor is:
| (31) |
The mapping involves four frames instead of two, since the two curved frames and the two flat frames have already been mapped onto each other. To generalize the mapping factor used in the standard Lorentz boost formula (Eq. 27) for the mapping factor, we write the ratio of the receiver 2-frame (flat) to emitter 2-frame (curved) as a square:
| (32) |
where and are functions of .
Before we write the final form of the 4-frame map, we consider the idea of relative motion invoked in the Lorentz transformation. In Special Relativity, Lorentz boosts are always defined as positive rotations away from the rest frame, which is aligned with the vertical time axis of the light cone (see Fig. 5). Since all frames are symmetric in Special Relativity, specific identification of which frame is the rest frame is meaningless. However in the LCM we have included small deviations from flatness, and so we identify the moving frame with the curved 2-frame mapping factor and the rest frame with the flat 2-frame mapping factor . This identification is made based upon the respective clocks (i.e. the coordinate times in each map), which reflect our concepts of the moving and rest frames.
Once this identification is made, we note that we are transforming from the moving frame to the rest frame — effectively a reverse boost. We characterize the reverse boost by the reciprocal of the Lorentz transformation in Eq. 26:
| (33) |
Re-written for algebraic convenience, to accommodate a 4-frame map, the final LCM mapping is:
| (34) |
where all quantities are functions of radius except for the vacuum speed of light and the characteristic frequency .
4 LCM Sample and Results
In this section we describe the four Milky Way luminous mass distributions (section 4.1), the rotation curve fitting protocol (section 4.2), the sample of emitter galaxies (section 4.3), and the results of the LCM fits (section 4.4).
4.1 Milky Way luminous mass models
As previously describe, in the LCM we map each emitter galaxy onto the receiver galaxy (i.e. the Milky Way) to derive the relative curvature term . The luminous matter profile of the Milky Way is notoriously difficult to determine because we are observing the system from the inside (e.g. interpreting H I outside the solar radius is particularly difficult (Carignan & Chemin, 2006)). We compare each of the emitter galaxies to four different Milky Way luminous mass models to accommodate for the variations in the Milky Way luminous mass modeling.
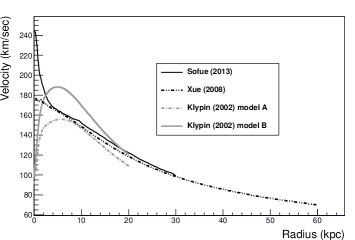
The four models differ in key features: inner rise rate, asymptotic velocity at large , and coverage. Mass components and total coverage are described in Table 1 and the total luminous profiles of each Milky Way model are plotted in Fig. 6, in terms of the resulting orbital velocities for a test particle.
The Milky Ways from Sofue (2013) and Xue et al. (2008) differ in the inner rise rates of the orbital velocities, and the Keplerian fall-offs at large differ only in magnitude. The Sofue model has the largest luminous mass of all four Milky Ways. The two Milky Ways from Klypin et al. (2002) (models A and B) differ in that model B includes angular momentum sharing for in-falling baryons to the disk, and so the Keplerian rotation curve from model B is globally higher than model A.
| Galaxy | coverage | ||
|---|---|---|---|
| Sofue | 30 kpc | ||
| Xue | 60 kpc | ||
| Klypin, A | 15 kpc | ||
| Klypin, B | 15 kpc |
Masses in units of
4.2 LCM rotation curve fitting protocol
In this paper we fit the predicted LCM rotation curve velocity (Eq.4) to the reported rotation curve data (Eq. 3). The LCM prediction and fit are calculated using the MINUIT minimization software as implemented in the ROOT data-analysis package (Brun & Rademakers, 1997).
The fit procedure is as follows:
-
1.
The luminous mass components reported in each reference are digitized using the software package Graph Click (GraphClick, 2013);
-
2.
The associated Newtonian gravitational potential is calculated for each component and the components are summed (Eq 10);
-
3.
We parametrize the Schwarzschild metric as a function of radius and calculate the convolution function, , for the selected Milky Way mass model, (Eq. 12)
-
4.
The minimization procedure explores the parameter space to find an optimal fit of to ; the parameter space includes the stellar disk and bulge M/L constrained (separately) to be between and , reported gas fraction constrained between and , and free;
- 5.
The initial luminous mass profiles used in the LCM fits come from four different fitting models: NFW, ISO, MOND and Maximum Light (MaxLight). In all of these model fits M/L was free, with the notable exception of those galaxies sampled from Ref. 8 (de Blok et al., 2008). Comparisons between the original fitting models’ reported M/L and the values to those of the LCM fits are reported in Table 2. The NFW, ISO, MOND or MaxLight values reported here have been recalculated using the same MINUIT software used for the LCM fits so that the values can be compared appropriately.
The ranges used to constrain M/L are motivated by significant variations for a given galaxy’s luminous mass profile, even when fit reports for the M/L are done with the same model, see Fig. 1. Reported gas profiles endure less variation than stellar M/L, but still vary significantly for a single system (Fraternali et al., 2011; de Blok et al., 2008). The M/L reported in the literature, which are used as the LCM starting mass estimates, are reported in Table 2.
4.2.1 Error estimates and reduced values
All figures reported here indicate the uncertainties as reported in the literature. There is currently no standard practice as to how to quantify the uncertainties associated with rotation curve data (Gentile et al., 2011; de Blok et al., 2008; Navarro, 1998; Sanders, 1996), such that resulting values can not be interpreted in a uniform way. Often the uncertainty comes from a fit of the tilted ring model to the H I velocity field. In other analyses uncertainty estimates come from differences between the approaching- and receding-side velocity fields (de Blok et al., 2008; Gentile et al., 2011; Randriamampandry & Carignan, 2014) .
4.3 The sample
The LCM sample reported in this paper represents twenty-three galaxies, in forty-two different data sets. The galaxies were randomly selected, with the only selection criteria being some effort to represent both galaxies smaller and larger than the Milky Way and to compare different model-based assumptions of the luminous mass profiles. We report the different galaxies in roughly decreasing order of size. In Table 2 average results (over the four different Milky Way luminous mass models) are reported as well as the original model contexts, M/L values, associated wavelength bands, and values. The values reported here for the originating models (NFW, MOND, ISO or MaxLight, from which we use the reported stellar and gas profiles as starting estimates for LCM luminous profiles) have been calculated using the same points and in the same fitting code as the associated LCM fits.
In sections 4.3.1-4.3.4 we describe some features and basic assumptions from some of the references for the emitter galaxies.
| Galaxy | Ref. | Band M/L | Model | Model Fit Results | LCM Fit Results (average) | |||||
|---|---|---|---|---|---|---|---|---|---|---|
| F 563-1 | 2 | I | NFW | 2.3 | – | 0.05 | 12.92 | – | 0.16 | |
| F 563-1 | 13 | B | NFW | 2.6 | – | 0.14 | 4.40 | – | 0.22 | |
| M 31 | 12 | B | ISO | 7.5 | 3.5 | 0.36 | 13.0 | 2.17 | 0.30 | |
| M 31 | 15 | R | NFW | 0.93 | 3.0 | 13.45 | 1.26 | 2.10 | 10.6 | |
| M 33 | 5 | K | NFW | 0.70 | – | 2.46 | 0.46 | – | 0.84 | |
| M 33 | 6 | B | MIdma | 0.80 | – | 0.16 | 0.70 | – | 0.18 | |
| NGC 891* | 11 | 3.6m | MOND | 0.5 | 2.0 | 5.30 | 0.92 | 1.40 | 1.06 | |
| NGC 891 | 11 | 3.6m | MaxLight | 0.9 | 1.64 | 1.10 | 1.03 | 1.49 | 1.15 | |
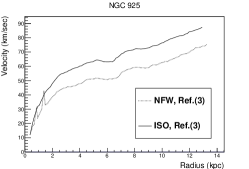
| NGC 925* | 3 | 3.6m | NFW | 0.65 | – | 2.94 | 0.36 | – | 6.45 | |
| NGC 925* | 3 | 3.6m | ISO | 0.18 | – | 2.40 | 0.003 | – | 3.81 | |
| NGC 2403 | 3 | 3.6m | NFW | 0.41 | – | 4.56 | 0.41 | – | 0.88 | |
| NGC 2403 | 9 | B | MOND | 1.60 | – | 3.67 | 0.99 | – | 2.30 | |
| NGC 2841 | 3 | 3.6m | NFW | 0.74 | 0.84 | 0.45 | 0.99 | 1.29 | 0.44 | |
| NGC 2841* | 8 | 3.6m | MOND | 0.89 | 1.04 | 0.87 | 0.84 | 1.09 | 0.43 | |
| NGC 2841 | 9 | B | MOND | 8.3 | 0.83 | 34.7 | 5.10 | 2.91 | 1.94 | |
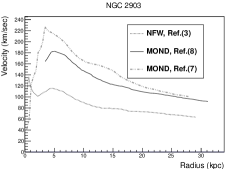
| NGC 2903 | 3 | 3.6m | NFW | 0.61 | 1.3 | 0.55 | 2.07 | 0.65 | 0.75 | |
| NGC 2903 | 8 | 3.6m | MOND | 1.71 | – | 0.61 | 2.03 | – | 0.76 | |
| NGC 2903 | 10 | B | MOND | 3.60 | – | 10.71 | 2.94 | – | 2.10 | |
| NGC 3198 | 1 | r | NFW | 3.8 | – | 1.34 | 3.26 | – | 1.65 | |
| NGC 3198 | 2 | r | NFW | 1.4 | – | 0.67 | 2.87 | – | 1.38 | |
| NGC 3198 | 3 | 3.6m | NFW | 0.80 | – | 5.40 | 0.64 | – | 4.61 | |
| NGC 3198 | 4 | 3.6m | MOND | 0.33 | – | 3.50 | 0.61 | – | 3.39 | |
| NGC 3521 | 8 | 3.6m | MOND | 0.71 | – | 0.97 | 0.72 | – | 0.80 | |
| NGC 3726 | 10 | B | MOND | 1.00 | – | 3.57 | 1.15 | – | 3.12 | |
| NGC 3953 | 10 | B | MOND | 2.7 | – | 1.35 | 1.72 | – | 0.62 | |
| NGC 3992 | 10 | B | MOND | 4.93 | – | 0.50 | 4.04 | – | 0.37 | |
| NGC 4088 | 10 | B | MOND | 1.16 | – | 1.70 | 1.64 | – | 1.39 | |
| NGC 4138 | 10 | B | MOND | 3.5 | – | 2.12 | 3.21 | – | 2.34 | |
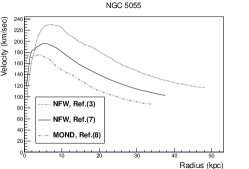
| NGC 5055 | 3 | 3.6m | NFW | 0.79 | 0.11 | 17.23 | 0.49 | 0.44 | 2.85 | |
| NGC 5055 | 7 | B | NFW | 3.20 | – | 3.27 | 2.51 | – | 2.55 | |
| NGC 5055 | 8 | 3.6m | MOND | 0.55 | 0.56 | 1.12 | 0.56 | 0.36 | 1.16 | |
| NGC 5533 | 10 | B | MOND | 0.6 | 7.2 | 1.57 | 3.00 | 6.67 | 0.73 | |
| NGC 5907 | 10 | B | MOND | 1.6 | 6.8 | 0.44 | 1.41 | 4.29 | 0.24 | |
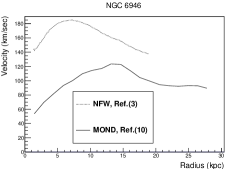
| NGC 6946 | 3 | 3.6m | NFW | 0.64 | 1.00 | 4.34 | 0.35 | 0.66 | 1.42 | |
| NGC 6946 | 10 | B | MOND | 0.5 | – | 3.03 | 0.70 | – | 0.46 | |
| NGC 7331 | 8 | 3.6m | MOND | 0.4 | 1.22 | 0.45 | 0.40 | 0.95 | 0.27 | |
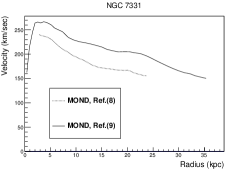
| NGC 7331* | 9 | B | MOND | 2.0 | 1.8 | 9.32 | 1.41 | 1.29 | 4.47 | |
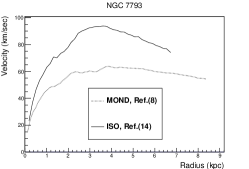
| NGC 7793 | 8 | 3.6m | MOND | 0.28 | – | 4.61 | 0.13 | – | 7.99 | |
| NGC 7793* | 14 | B | ISO | 2.6 | – | 1.08 | 2.55 | – | 0.59 | |
| NGC 7814 | 11 | 3.6m | ISO | 0.68 | 0.71 | 0.25 | 3.17 | 0.54 | 0.44 | |
| NGC 7814* | 11 | 3.6m | MaxLight | 9.25 | 0.64 | 6.11 | 3.81 | 0.56 | 0.50 | |
| UGC 6973 | 10 | B | MOND | 2.7 | – | 23.5 | 1.49 | – | 0.07 | |
Notes:
Values in this table are averaged over the four emitter-receiver (Milky Way) galaxy pairings. Galaxies for which one LCM fit-pair failed is indicated by (*). MIdma is a model independent dark matter fit.
Mass-to-light ratios in units of . Reduced per degree of freedom indicated by .
References: 1. Begeman (1989), 2. Navarro (1998), 3. de Blok et al. (2008) , 4. Gentile et al. (2013), 5. Corbelli (2003), 6. Corbelli & Salucci (2000), 7. Battaglia et al. (2006), 8. Gentile et al. (2011), 9. Bottema et al. (2002), 10. Sanders & McGaugh (2002), 11. Fraternali et al. (2011), 12. Carignan & Chemin (2006), 13. Giraud (2000), 14. Dicaire et al. (2008), 15. Klypin et al. (2002).
4.3.1 Ref. 3 parameters de Blok et al. (2008), NFW
From Ref. 3 (de Blok et al., 2008) we sample seven galaxies: NGC 3198, NGC 5055, NGC 2403, NGC 2841, NGC 6946, NGC 2903 and NGC 925. These galaxies are reported in the context of NFW fits with fixed M/L, consistent with the PSM of Bell & de Jong (2001) with a Salpeter (Salpeter, 1955) initial mass function. For NGC 925 we sample both the NFW and the ISO fits, both with M/L fixed.
The Ref. 3 rotation curve data comes from the H I THINGS survey (Walter et al., 1985). The THINGS data is generally considered to be the highest resolution rotation curve data available. The Ref. 3 sample is chosen based on favorable inclination angles and regular rotations. Rotation curve derivations are based on tilted-ring rotation curve analysis, fit with third-order Gauss-Hermite polynomials. Gas estimates are based on a thin gas disk geometry from the H I flux maps reported by Walter et al. (1985), scaled by to account for helium and metals. Molecular gas is included as a slight increase in the M/L of the stellar disk. Stellar M/L are reported in the m band to avoid the uncertainties prevalent in B-band from hot dust and young stars. Ref. 3 decomposes the stellar light into a bulge and disk with a double exponential disk model, avoiding the canonical bulge distribution.
4.3.2 Ref. 8 parameters Gentile et al. (2011), MOND
From Ref. 8 (Gentile et al., 2011) we sample six galaxies: NGC 2903, NGC 2841, NGC 5055, NGC 7331, NGC 7793 & NGC 3521. These galaxies are reported in the context of MOND fits and all galaxy rotation curves come from Ref. 3 (de Blok et al., 2008). Ref. 8 uses the Ref. 3 geometry and gas assumptions (above), with stellar M/L of the disk and bulge free, distances constrained, and the “simple” interpolating function. They report M/L in the m band.
Of those galaxies sampled here, they report that all are consistent with the PSMs of Bell & de Jong (2001) with the exception of NGC 2903 and NGC 7331. As evidenced in Fig. 1, while NGC 2841 velocities associated with the luminous profiles reported in Ref. 3 and Ref. 8 differ by approximately and those for NGC 5055 by about , both sets of luminous models are reported as consistent with the same PSMs, demonstrating the degree of freedom within current PSMs.
4.3.3 Ref. 10 parameters Sanders & McGaugh (2002), MOND
From Ref. 10 (Sanders & McGaugh, 2002) we sample ten galaxies: NGC 5533, NGC 4138, NGC 5907, NGC 3992, NGC 2903, NGC 3953, UGC 6973, NGC 4088, NGC 3726, and NGC 6946. These galaxies are reported in the context of MOND fits, at Ursa Major distances. In Ref. 10 the distance to the Ursa Major system is reported as Mpc, but Cepheid based recalibration indicates Mpc (Tully & Pierce, 2000). They model the luminous mass with thin stellar and gaseous disks and a spheroidal stellar bulge, for M/L free. Most systems are treated with coplanar circular motions, but, when appropriate, complexities for bars and warping of the gas layer are modeled. M/L is reported in the B-band. Neutral hydrogen is scaled by to account for primordial helium.
4.3.4 Ref. 9 parameters Bottema et al. (2002), MOND
From Bottema et al. (2002) we sample three galaxies: NGC 2841, NGC 7331, and NGC 2403. These galaxies are reported in the context of MOND fits at Cepheid distances. The only geometry assumption they report is a thing stellar disk. M/L is free and reported in the B-band. Ref. 9 gas is reported from a surface density distribution equal to the observed H I scaled by a factor of to account for primordial helium. The contribution of the gas to the rotation curve is fixed and does not depend on the distance to the galaxy.
4.4 Results
In this section we make notes on individual galaxies and groups of galaxies with interesting features that constrain PSM and imply an interpretation of the LCM free parameter .
In Table 2 we report the LCM average results for M/L and reduced values from the LCM fits plus a comparison to fits using the originating models (NFW, ISO, MOND, or MaxLight). Individual emitter galaxy fit results for each Milky Way luminous mass model are reported in Table 3. LCM fits for seven () out of emitter-receiver galaxy pairings failed; these failures indicate problems with the initial luminous mass profiles.
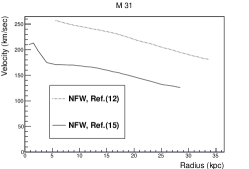
Figs. 8-11 show LCM fits using the Xue et al. (2008) Milky Way. We selected the Xue Milky Way for the figures because it has the largest radial coverage. In the one case where the LCM fit with the Xue Milky Way failed, we instead show the Sofue (2013) Milky Way pairing, as indicated in the figure caption.
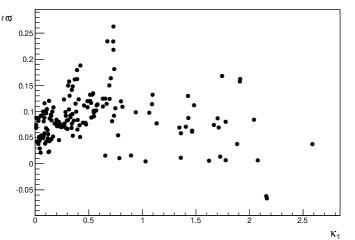
The distribution of values for , has a mean value of and does not exhibit an obvious dependence on the relative curvature ratio, , as indicated in Fig. 7. In section 4.4.3 we present a conjecture regarding a possible physical correlation between and density gradients in the luminous matter.
| emitter | receiver Milky Way | gas scaling | |||||
|---|---|---|---|---|---|---|---|
| F 563-1 Ref. 2 | Sofue | 0.04 | 0.03 | 1.5 | 9.59 | – | 0.15 |
| Klypin A | 0.07 | 0.06 | 1.5 | 9.37 | – | 0.16 | |
| Klypin B | 0.08 | 0.05 | 1.5 | 9.45 | – | 0.16 | |
| Xue | 0.10 | 0.07 | 1.5 | 9.33 | – | 0.16 | |
| F 563-1 Ref. 13 | Sofue | 0.05 | 0.02 | 1.5 | 4.48 | – | 0.21 |
| Klypin A | .10 | 0.04 | 1.5 | 4.36 | – | 0.22 | |
| Klypin B | 0.09 | 0.04 | 1.5 | 4.40 | – | 0.22 | |
| Xue | 0.11 | 0.05 | 1.5 | 4.34 | – | 0.22 | |
| M 31 Ref. 12 | Sofue | 0.89 | 0.02 | 0.75 | 8.98 | 1.88 | 0.30 |
| Klypin A | 2.16 | -0.07 | 0.75 | 17.90 | 1.94 | 0.28 | |
| Klypin B | 2.16 | -0.06 | 0.75 | 17.67 | 2.22 | 0.28 | |
| Xue | 2.59 | 0.04 | 0.75 | 7.41 | 2.63 | 0.33 | |
| M 31 Ref. 15 | Sofue | 0.94 | 0.10 | – | 0.55 | 3.18 | 9.52 |
| Klypin A | 1.88 | 0.04 | – | 2.02 | 2.44 | 13.8 | |
| Klypin B | 1.10 | 0.13 | – | 1.61 | 1.39 | 9.48 | |
| Xue | 1.43 | 0.13 | – | 0.85 | 1.38 | 9.53 | |
| M 33 Ref. 5 | Sofue | 0.04 | 0.04 | 1.5 | 0.47 | – | 0.78 |
| Klypin A | 0.09 | 0.09 | 1.5 | 0.45 | – | 0.87 | |
| Klypin B | 0.08 | 0.08 | 1.5 | 0.46 | – | 0.87 | |
| Xue | 0.10 | 0.10 | 1.5 | 0.46 | – | 0.83 | |
| M 33 Ref. 6 | Sofue | 0.04 | 0.05 | 0. 89 | 0.72 | – | 0.19 |
| Klypin A | 0.07 | 0.10 | 1.00 | 0.70 | – | 0.18 | |
| Klypin B | 0.07 | 0.09 | 1.02 | 0.70 | – | 0.18 | |
| Xue | 0.09 | 0.12 | 1.05 | 0.69 | – | 0.18 | |
| NGC 891 Ref. 11 444Citation’s M/L assumptions from MOND fit | Sofue | 0.65 | 0.02 | 0.75 | 0.86 | 1.24 | 0.95 |
| Klypin A* | – | – | – | – | – | – | |
| Klypin B | 1.36 | 0.01 | 0.75 | 0.93 | 1.40 | 1.06 | |
| Xue | 1.73 | 0.01 | 0.75 | 0.92 | 1.39 | 1.06 | |
| NGC 891 Ref. 11 555Citation’s M/L assumptions from MaxLight fit | Sofue | 0.79 | 0.01 | 0.75 | 0.98 | 1.37 | 1.08 |
| Klypin A | 1.78 | 0.01 | 0.75 | 1.04 | 1.55 | 1.16 | |
| Klypin B | 1.62 | 0.01 | 0.75 | 1.05 | 1.53 | 1.17 | |
| Xue | 2.08 | 0.01 | 0.75 | 1.04 | 1.53 | 1.17 | |
| NGC 925 Ref. 3666original citation M/L assumptions: NFW | Sofue* | – | – | – | – | – | – |
| Klypin A | 0.03 | 0.04 | 1.5 | 0.36 | – | 6.44 | |
| Klypin B | 0.03 | 0.04 | 1.5 | 0.37 | – | 6.43 | |
| Xue | 0.04 | 0.05 | 1.5 | 0.36 | – | 6.48 | |
| NGC 925 Ref. 3777original citation M/L assumptions: ISO | Sofue* | – | – | – | – | – | – |
| Klypin A | 0.01 | 0.07 | 1.5 | 0.003 | – | 3.80 | |
| Klypin B | 0.01 | 0.07 | 1.5 | 0.003 | – | 3.80 | |
| Xue | 0.01 | 0.09 | 1.5 | 0.003 | – | 3.83 | |
| NGC 2403 Ref. 3 | Sofue | 0.06 | 0.05 | 1.5 | 0. 42 | – | 0.87 |
| Klypin A | 0.11 | 0.10 | 1.5 | 0.40 | – | 0.88 | |
| Klypin B | 0.10 | 0.10 | 1.5 | 0.41 | – | 0.88 | |
| Xue | 0.13 | 0.12 | 1.5 | 0.41 | – | 0.88 | |
| NGC 2403 Ref. 9 | Sofue | 0.07 | 0.05 | 1.5 | 1.01 | – | 2.24 |
| Klypin A | 0.15 | 0.09 | 1.5 | 0.98 | – | 2.30 | |
| Klypin B | 0.14 | 0.09 | 1.5 | 0. 99 | – | 2.30 | |
| Xue | 0.17 | 0.11 | 1.5 | 0.98 | – | 2.35 |
| emitter | receiver Milky Way | gas scaling | |||||
|---|---|---|---|---|---|---|---|
| NGC 2841 Ref. 3 | Sofue | 1.13 | 0.08 | 0.75 | 1.40 | 2.50 | 0.48 |
| Klypin A | 0.73 | 0.26 | 1.5 | 0.63 | 0.60 | 0.19 | |
| Klypin B | 0.73 | 0.23 | 1.5 | 0.67 | 0.69 | 0.16 | |
| Xue | 1.91 | 0.16 | 1.5 | 1.24 | 1.36 | 0.96 | |
| NGC 2841 Ref. 8 | Sofue | 0.51 | 0.13 | 1.50 | 0.76 | 1.12 | 0.10 |
| Klypin A* | – | – | – | – | – | – | |
| Klypin B | 0.67 | 0.23 | 1.50 | 0.55 | 0.95 | 0.10 | |
| Xue | 1.74 | 0.17 | 1.50 | 1.20 | 1.21 | 1.10 | |
| NGC 2841 Ref. 9 | Sofue | 0.58 | 0.11 | 1.50 | 3.73 | 2.56 | 0.28 |
| Klypin A | 1.46 | 0.06 | 0.75 | 5.46 | 3.13 | 1.28 | |
| Klypin B | 1.36 | 0.06 | 0.75 | 5.53 | 3.17 | 1.36 | |
| Xue | 1.91 | 0.16 | 1.50 | 5.70 | 2.80 | 4.82 | |
| NGC 2903 Ref. 3 | Sofue | 0.28 | 0.07 | 1.5 | 2.27 | 0 | 1.14 |
| Klypin A | 0.49 | 0.12 | 1.5 | 2.00 | 0 | 0.72 | |
| Klypin B | 0.46 | 0.11 | 1.5 | 2.04 | 0 | 0.74 | |
| Xue | 1.06 | 0.10 | 0.75 | 1.97 | 2.57 | 0.38 | |
| NGC 2903 Ref. 8 | Sofue | 0.24 | 0.07 | 1.5 | 2.17 | – | 1.02 |
| Klypin A | 0.41 | 0.12 | 1.5 | 1.94 | – | 0.53 | |
| Klypin B | 0.38 | 0.12 | 1.5 | 1.96 | – | 0.54 | |
| Xue | 0.53 | 0.13 | 1.5 | 2.07 | – | 0.95 | |
| NGC 2903 Ref. 10 | Sofue | 0.30 | 0.07 | 1.5 | 3.16 | – | 2.99 |
| Klypin A | 0.52 | 0.12 | 1.5 | 2.78 | – | 1.00 | |
| Klypin B | 0.49 | 0.11 | 1.5 | 2.85 | – | 1.04 | |
| Xue | 0.65 | 0.12 | 1.5 | 2.95 | – | 3.39 | |
| NGC 3198 Ref. 1 | Sofue | 0.15 | 0.05 | 1.5 | 3.34 | – | 1.45 |
| Klypin A | 0.27 | 0.08 | 1.5 | 3.21 | – | 1.83 | |
| Klypin B | 0.25 | 0.07 | 1.5 | 3.24 | – | 1.84 | |
| Xue | 0.33 | 0.09 | 1.5 | 3.24 | – | 1.47 | |
| NGC 3198 Ref. 2 | Sofue | 0.15 | 0.05 | 1.5 | 2.91 | – | 1.27 |
| Klypin A | 0.30 | 0.08 | 1.5 | 2.84 | – | 1.42 | |
| Klypin B | 0.27 | 0.08 | 1.5 | 2.87 | – | 1.43 | |
| Xue | 0.35 | 0.10 | 1.5 | 2.84 | – | 1.39 | |
| NGC 3198 Ref. 3 | Sofue | 0.12 | 0.05 | 1.5 | 0.73 | – | 3.94 |
| Klypin A | 0.16 | 0.10 | 1.5 | 0.53 | – | 5.44 | |
| Klypin B | 0.15 | 0.09 | 1.5 | 0.55 | – | 5.35 | |
| Xue | 0.29 | 0.09 | 1.5 | 0.75 | – | 3.69 | |
| NGC 3198 Ref. 4 | Sofue | 0.13 | 0.04 | 1.5 | 0.65 | – | 2.94 |
| Klypin A | 0.22 | 0.08 | 1.5 | 0.57 | – | 4.36 | |
| Klypin B | 0.20 | 0.07 | 1.5 | 0.58 | – | 4.31 | |
| Xue | 0.32 | 0.10 | 1.5 | 0.64 | – | 1.95 | |
| NGC 3521 Ref. 8 | Sofue | 0.42 | 0.05 | 1.50 | 0.79 | – | 0.68 |
| Klypin A | 0.74 | 0.09 | 1.50 | 0.69 | – | 0.85 | |
| Klypin B | 0.72 | 0.08 | 1.50 | 0.74 | – | 0.86 | |
| Xue | 0.81 | 0.11 | 1.50 | 0.65 | – | 0.83 | |
| NGC 3726 Ref. 10 | Sofue | 0.12 | 0.06 | 0.75 | 1.15 | – | 2.40 |
| Klypin A | 0.23 | 0.08 | 1.5 | 1.17 | – | 3.86 | |
| Klypin B | 0.20 | 0.08 | 0.75 | 1.17 | – | 3.46 | |
| Xue | 0.27 | 0.12 | 1.50 | 1.10 | – | 2.76 | |
| NGC 3953 Ref. 10 | Sofue | 0.20 | 0.08 | 0.75 | 1.86 | – | 0.63 |
| Klypin A | 0.37 | 0.16 | 0.75 | 1.68 | – | 0.61 | |
| Klypin B | 0.35 | 0.15 | 0.75 | 1.73 | – | 0.62 | |
| Xue | 0.42 | 0.19 | 0.75 | 1.63 | – | 0.61 | |
| NGC 3992 Ref. 10 | Sofue | 0.36 | 0.08 | 1.00 | 4.52 | – | 0.29 |
| Klypin A | 0.54 | 0.13 | 0.75 | 3.86 | – | 0.45 | |
| Klypin B | 0.51 | 0.12 | 0.75 | 3.99 | – | 0.48 | |
| Xue | 0.71 | 0.16 | 1.50 | 3.79 | – | 0.27 |
| emitter | receiver Milky Way | gas scaling | |||||
|---|---|---|---|---|---|---|---|
| NGC 4088 Ref. 10 | Sofue | 0.17 | 0.05 | 0.75 | 1.15 | – | 1.38 |
| Klypin A | 0.33 | 0.09 | 1.11 | 1.10 | – | 1.39 | |
| Klypin B | 0.31 | 0.08 | 1.06 | 1.12 | – | 1.40 | |
| Xue | 0.38 | 0.10 | 1.20 | 1.09 | – | 1.40 | |
| NGC 4138 Ref. 10 | Sofue | 0.22 | 0.05 | 1.50 | 3.24 | – | 2.40 |
| Klypin A | 0.45 | 0.08 | 1.50 | 3.20 | – | 2.26 | |
| Klypin B | 0.41 | 0.07 | 1.50 | 3.23 | – | 2.34 | |
| Xue | 0.52 | 0.09 | 1.50 | 3.19 | – | 2.31 | |
| NGC 5055 Ref. 3 | Sofue | 0.34 | 0.07 | 0.90 | 0.39 | 4.83 | 1.46 |
| Klypin A | 1.03 | 0.004 | 1.50 | 0.66 | 6.50 | 5.21 | |
| Klypin B | 0.55 | 0.10 | 0.75 | 0.35 | 4.40 | 1.87 | |
| Xue* | – | – | – | – | – | – | |
| NGC 5055 Ref. 7 | Sofue | 0.35 | 0.05 | 1.5 | 2.77 | – | 2.93 |
| Klypin A | 0.57 | 0.10 | 1.5 | 2.31 | – | 1.76 | |
| Klypin B | 0.55 | 0.09 | 1.5 | 2.43 | – | 1.68 | |
| Xue | 0.75 | 0.11 | 1.5 | 2.51 | – | 3.83 | |
| NGC 5055 Ref. 8 | Sofue | 0.39 | 0.07 | 1.5 | 0.62 | 0.42 | 1.26 |
| Klypin A | 0.63 | 0.12 | 1.5 | 0.50 | 0.33 | 0.88 | |
| Klypin B | 0.63 | 0.11 | 1.5 | 0.54 | 0.37 | 0.96 | |
| Xue | 0.80 | 0.12 | 1.5 | 0.58 | 0.31 | 1.53 | |
| NGC 5533 Ref. 10 | Xue | 2.04 | 0.08 | 1.50 | 3.0 | 6.67 | 0.73 |
| NGC 5907 Ref. 10 | Sofue | 0.34 | 0.08 | 0.75 | 1.54 | 4.72 | 0.20 |
| Klypin A | 0.57 | 0.11 | 0.75 | 1.34 | 4.27 | 0.30 | |
| Klypin B | 0.55 | 0.10 | 0.75 | 1.39 | 4.43 | 0.29 | |
| Xue | 0.69 | 0.15 | 0.95 | 1.37 | 3.75 | 0.19 | |
| NGC 6946 Ref. 3 | Sofue | 0.18 | 0.08 | 1.5 | 0.38 | 0.70 | 1.37 |
| Klypin A | 0.34 | 0.14 | 1.5 | 0.34 | 0.65 | 1.44 | |
| Klypin B | 0.32 | 0.13 | 1.50 | 0.35 | 0.67 | 1.42 | |
| Xue | 0.39 | 0.16 | 1.50 | 0.33 | 0.64 | 1.46 | |
| NGC 6946 Ref. 10 | Sofue | 0.12 | 0.06 | 0.75 | 0.71 | – | 0.46 |
| Klypin A | 0.22 | 0.08 | 0.75 | 0.71 | – | 0.36 | |
| Klypin B | 0.20 | 0.07 | 0.75 | 0.72 | – | 0.38 | |
| Xue | 0.28 | 0.10 | 1.5 | 0.67 | – | 0.62 | |
| NGC 7331 Ref. 8 | Sofue | 0.40 | 0.08 | 0.75 | 0.44 | 1.04 | 0.34 |
| Klypin A | 0.69 | 0.12 | 1.07 | 0.41 | 0.88 | 0.17 | |
| Klypin B | 0.67 | 0.11 | 0.75 | 0.44 | 0.88 | 0.17 | |
| Xue | 0.74 | 0.18 | 0.75 | 0.31 | 1.01 | 0.40 | |
| NGC 7331 Ref. 9 | Sofue | 0.48 | 0.08 | 0.75 | 1.90 | 0.25 | 6.63 |
| Klypin A* | – | – | – | – | – | – | |
| Klypin B | 1.09 | 0.11 | 0.75 | 0.21 | 1.64 | 1.50 | |
| Xue | 1.48 | 0.11 | 0.75 | 2.13 | 1.32 | 5.28 | |
| NGC 7793 Ref. 8 | Sofue | 0.02 | 0.04 | 0.75 | 0.12 | – | 7.93 |
| Klypin A | 0.03 | 0.09 | 0.75 | 0.12 | – | 8.12 | |
| Klypin B | 0.03 | 0.08 | 0.75 | 0.12 | – | 8.11 | |
| Xue | 0.05 | 0.09 | 1.50 | 0.15 | – | 7.81 | |
| NGC 7793 Ref. 14 | Sofue* | – | – | – | – | – | – |
| Klypin A | 0.13 | 0.02 | 1.5 | 2.55 | – | 0.56 | |
| Klypin B | 0.12 | 0.02 | 1.5 | 2.55 | – | 0.58 | |
| Xue | 0.16 | 0.03 | 1.5 | 2.55 | – | 0.60 | |
| NGC 7814 Ref. 11888Citation’s M/L assumptions from ISO fit | Sofue | 0.77 | 0.05 | 0.75 | 3.32 | 0.55 | 0.23 |
| Klypin A | 1.67 | 0.07 | 0.75 | 2.81 | 0.60 | 0.41 | |
| Klypin B | 1.41 | 0.07 | 1.5 | 3.4 | 0.53 | 0.82 | |
| Xue | 1.70 | 0.09 | 0.75 | 3.17 | 0.51 | 0.32 | |
| NGC 7814 Ref. 11 999Citation’s M/L assumptions from MaxLight fit | Sofue* | – | – | – | – | – | – |
| Klypin A | 1.71 | 0.07 | 0.75 | 3.28 | 0.61 | 0.45 | |
| Klypin B | 1.46 | 0.06 | 1.50 | 4.50 | 0.54 | 0.70 | |
| Xue | 1.78 | 0.08 | 0.75 | 3.63 | 0.53 | 0.36 | |
| UGC 6973 Ref. 10 | Sofue | 0.15 | 0.08 | 0.75 | 1.51 | – | 0.07 |
| Klypin A | 0.32 | 0.16 | 0.75 | 1.47 | – | 0.06 | |
| Klypin B | 0.31 | 0.15 | 0.91 | 1.50 | – | 0.07 | |
| Xue | 0.39 | 0.18 | 1.13 | 1.48 | – | 0.07 |
4.4.1 M 31
M 31 is an early-type spiral galaxy of large angular size, in our Local group. The proximity of M 31 to the Milky Way presents difficulties in disentangling the gas kinematics of the two galaxies. It remains an open question if M 31 or the Milky Way is the largest member of the Local Group. There is general agreement on the M 31 rotation curve between and kpc (Sofue & Kato, 1981). The bulge of M 31 is thought to be an old stellar population which is almost twice as massive and more compact than that of the Milky Way (Klypin et al., 2002).
We compare rotation curves as reported in Ref. 12 (Carignan & Chemin, 2006) and Ref. 15 (Klypin et al., 2002). Both Ref. 12 and Ref. 15 luminous profiles are from dark matter fits. The luminous matter profile in Ref. 12 is from an ISO fit and that in Ref. 15 is from an NFW fit with concentration taken from N-body simulation (consistent with ). Ref. 12 disentangles M 31 and Milky Way gas velocities by using only the approaching side kinematics of the rotation curve data reported in Carignan (1985). Both references use the stellar parameters as reported in (Walterbos & Kennicutt, 1987, 1988).
Comparison of the Ref. 12 and Ref. 15 M/L results reflect the under-constrained nature of PSM, reflected in the two reported luminous profiles shown in Fig. 1. The Ref. 12 ISO fit returns an anomalously high disk and a bulge consistent with Walterbos & Kennicutt (1987, 1988) of . Most fit results for M 31 return a M/L of the disk twice that of the bulge (Kent, 1989), however Ref. 15 disputes this trend with their varying concentration treatment, which returns M/L respectively of and for the disk and bulge, consistent with PSM of Bell & de Jong (2001). Ref. 15 attributes the difference to dark matter treatments which use constant density dark halos and do not account for absorption. Widrow et al. (2003) also notes extinction effects from dust in the disk. While the LCM fits for M 31 in Fig. 8 do not obviously favor one luminous model over the other, the stability of individual pairing results reported in Table 3 indicate the Ref. 15 luminous profile is more physically acceptable. As will be discussed in section 4.4.3, the M 31 values are consistent with a conjecture relating to density gradients in the luminous matter. Based on that conjecture, the Ref. 15 luminous profile is again more physically representative an old, heavy stellar bulge.
4.4.2 NGC 5533
NGC 5533 is an early-type galaxy at an estimated distance of Mpc. NGC 5533 has significant side-to-side asymmetries and a warp.
We sample NGC 5533 as reported in Ref. 10 (Sanders & McGaugh, 2002) with an associated luminous profile from a MOND fit. The Ref. 10 rotation curve data is from Sanders (1996). The luminous profile geometry reported by Ref. 10 is calculated using a double exponential model similar to those used in all Ref. 3 and Ref. 8 galaxies. The Ref. 10 gas is from H I surface densities, reported as . Ref. 10 notes that a large fraction of total light is in the central bulge and that higher bulge M/L are consistent with expectations for older, less actively star forming spheroidal sub-systems.
Unfortunately, only one Milky Way luminous mass model in our sample has sufficient radial coverage to adequately fit this galaxy (Xue et al., 2008). However, NGC 5533 is retained because there are so few galaxies larger than the Milky Way. We return M/L of the bulge a little lower than reported in Ref. 10, and maximal gas scalings of . The Ref. 10 bulge M/L is about ten times that of the disk. Our LCM fits reduce this proportion to about a factor of two (). Fit results are shown in Fig. 8. As will be discussed in the conjecture in section 4.4.3, the NGC 5533 values (in Table 3) indicate a stellar bulge for NGC 5533 which is less dense than that of M 31 as reported in Ref. 15.
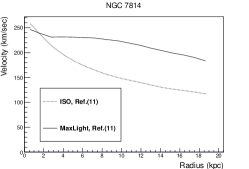
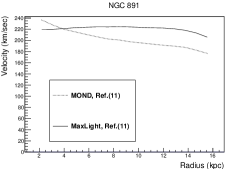
4.4.3 NGC 891 & NGC 7814
The comparisons between the NGC 891 and NGC 7814 as reported in Ref. 11 (Fraternali et al., 2011) are probably the most important in our sample. NGC 891 and NGC 7814 are edge-on spiral galaxies at respective distances of and Mpc. The Ref. 11 rotation curves are from Oosterloo et al. (2007), with a velocity resolution of , derived from concentric rings and Gaussian fits to the velocity field. M/L is reported in the m band, and the geometries of an exponential disk and spherical bulge are used. Because these two galaxies have similar total enclosed luminous mass at the limit of the data as indicated by (see section 3.2.1), very similar rotation curves beyond , and similar inclinations, the direct comparison of their free parameter values in Table 3 can be tied to morphology. NGC 891 is disk-dominated and NGC 7814 is bulge-dominated.
The comparison of the LCM results for NGC 891 and NGC 7814 are the most direct indication of a physical interpretation for . The lower density gradient in the luminous matter associated with the disk-dominated galaxy NGC 891 is associated with low values as compared to those for the higher density gradient bulge-dominated NGC 7814. We see this trend throughout the sample, with one possible exception; therefore we make the following conjecture: increases with increasing density gradients in the luminous matter.
We note that it remains possible that instead implies a relation between the dark matter halo and the luminous matter profile, because NGC 891 is commonly referred to as having a minimal dark matter halo, consistent with vanishingly small values.
Ref. 11 reports rotation curves fits for NGC 7814 and NGC 891 in three different model contexts: Maximum light (MaxLight), ISO and MOND. For NGC 7814, we sample the ISO and MaxLight luminous profiles. For NGC 891, we sample the MOND and MaxLight luminous profiles. Ref. 11 MOND fits are based on the -simple interpolating function as described in Gentile et al. (2011). The LCM results for both galaxies demonstrate convergence of the reported M/L from very different starting estimates. The NGC 7814 MaxLight fit result M/L of the bulge was unrealistically high, taken to indicate the necessity of a dark matter halo. The LCM lowers that M/L without a halo. In Fig. 8 we report only one of the NGC 891 LCM fits (from MOND starting estimates of M/L) in the interest of space, given that the two LCM luminous profiles and fits were essentially the same, and for NGC 7814 LCM results from the starting assumptions of M/L from ISO are indicated by (A) and those from MaxLight are indicated by (B).
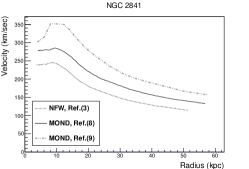
4.4.4 NGC 2841
NGC 2841 is an early-type, large spiral galaxy larger in radial extent than the Milky Way. The controversial distance estimates to this galaxy are the Cepheid distance of Mpc versus that indicated by MOND fits of Mpc. The larger MOND distance is supported by the lowest luminosity supernova type IA event ever observed (Gentile et al., 2011; Bottema et al., 2002), which would be of standard luminosity at the MOND distance. The Cepheid based distance is considered the most precise distance measure, though some unresolved issues persist (Freedman et al., 2001).
We sample three different references for NGC 2841: an NFW fit from Ref. 3 (de Blok et al., 2008) and MOND fits from Ref. 8 (Gentile et al., 2011) and Ref. 9 (Bottema et al., 2002). The fits in Ref. 3 and 9 are at the Cepheid distance, and that from Ref. 8 is at the constrained Cepheid distance of Mpc. Ref. 3 and Ref. 8 rotation curve derivations and modeling assumptions are described in sections 4.3.1 and 4.3.2. The Ref. 3 and Ref. 8 rotation curves agree with that in Ref. 9 within the error. The Ref. 9 rotation curves is from Begeman (1987). Ref. 3 notes excess surface brightness in the central radii of NGC 2841, not accounted for by their exponential model.
The major difference between these three luminous profiles as reported is the stellar mass decomposition. In Ref. 3 and Ref. 8 the disk M/L is slightly smaller than that of the bulge. In Ref. 9, the disk M/L is ten times that of the bulge. The M/L reported in Ref. 3 are fixed consistent with Bell & de Jong (2001) PSM. As shown in Fig. 8, the LCM returns three luminous profiles and associated rotation curve fits which are very similar in all features. However, what distinguishes these three LCM fits are the resulting values. The luminous assumptions in Ref. 3 and Ref. 8 return the largest values in the sample, versus those from Ref. 9 which are very close to the mean value (Fig. 7). The scaling of with steeper density gradients in the luminous matter (section 4.4.3) indicates that future directed photometric investigation of NGC 2841 can identify which model is most physically representative.
4.4.5 NGC 7331
NGC 7331 is an early-type spiral with strong spiral arm structure.
We sample two NGC 7331 rotation curves and associated MOND fits, using different distance estimates and associated luminous profiles. Ref. 9 (Bottema et al., 2002) uses the cepheid based distance ( Mpc) and and Ref. 8 (Gentile et al., 2011) the constrained distance ( Mpc). The Ref. 8 rotation curve is higher resolution, and shows a rise in the final radii which is not observed in Ref. 9. The difference is attributed to differing assumptions of the galaxy’s inclination (de Blok et al., 2008) .
The major difference between these two data sets are the luminous profiles; in Ref. 9 the M/L of the bulge and disk are approximately equal, and in Ref. 8 the M/L of the bulge is about three () times that of the disk. PSM (Bell & de Jong, 2001) for this galaxy indicate a M/L of the bulge which is bigger by a factor of approximately (de Blok et al., 2008). As can be seen in Fig. 8, the two LCM fits are roughly equivalent past kpc, though differing coverage makes the two data sets difficult to directly compare, though the LCM fits from Ref. 8 assumptions are more stable. Consistent with the conjecture in section 4.4.3, the larger values are associated with fits using the larger bulge assumptions in Ref. 8. The total gas reported in Ref. 9 is , with associated rotation curve velocities approximately higher than those for the gas reported in Ref. 8. The majority of LCM pairings for both data sets return minimal gas scalings for this galaxy. A comparison to NGC 3521 is made in the next section.
4.4.6 NGC 3521
NGC 3521 was one of the first cases of a genuinely declining H I rotation curve, although not a Keplerian descent. However, we sample data from Ref. 8 (Gentile et al., 2011) which does not confirm the descending rotation curve. There is a small decrease in circular velocity at high radii, but not as previously reported.
Ref. 8 reports MOND fit results for M/L free and the constrained distance of Mpc, from the Hubble flow distance of Mpc. See section 4.3.2 for a description of the associated assumptions for rotation curve derivations and luminous mass modeling. In de Blok et al. (2008) the fixed PSM of the disk M/L is . Ref. 8 returns a value of . The LCM fit return an average value of . LCM fits returns maximal gas scalings of .
An interesting feature for this analysis is the distribution of the luminous mass. While the total enclosed luminous mass at the farthest extent of the data (indicated by ) for NGC 3521 and NGC 7331 (as reported in Ref. 8) are approximately equal, the average values of the free parameter for NGC 3521 are about smaller. With no reported bulge component for NGC 3521 as compared to NGC 7331, this is consistent with the conjecture in section 4.4.3. Fit results are shown in Fig. 8.
4.4.7 NGC 5055
NGC 5055 is a rotationally dominated spiral galaxy at a favorable inclination for kinematic study. It has a nearby companion galaxy UGC 8313, at a projected distance of kpc (Battaglia et al., 2006).
We sample three rotation curves: Ref. 3 (de Blok et al., 2008), Ref. 7 (Battaglia et al., 2006), and Ref. 8 (Gentile et al., 2011). The rotation curves in Ref. 3 and Ref. 8, as compared to Ref. 7, have a more pronounced rise rate and higher velocities at large radii. Ref. 3 and Ref. 8 derive their rotation curves as described in Sections 4.3.1 and 4.3.2. Ref. 7 derives their rotation curve velocity using the conventional intensity-weighted mean Gaussian profile fits. Distance indicators for the three authors are: Ref. 3 uses the Hubble flow distance of Mpc, Ref. 7 uses a Cepheid distance of Mpc (Pierce et al., 1994) and Ref. 8 uses a constrained fit distance of Mpc. The gas mass reported in Ref. 7. (Battaglia et al., 2006) is the total H I mass of , scaled for helium abundances.
The luminous profile reported in Ref. 3 is fixed by PSM, that in Ref. 7 is from a NFW fits and in Ref. 8 from a MOND fit. All three authors report their resulting M/L are consistent with PSM, though in Fig. 1 they appear geometrically different. In Ref. 3, the M/L of the bulge is seven times smaller than that of the disk. In Ref. 8, the M/L of the bulge and disk are approximately equal. In Ref. 7 there is no stellar bulge.
LCM fits from the Ref. 3 luminous profile are highly unstable, see Table 3. The LCM fits using the Ref. 7 and Ref. 8 luminous profiles (both at essentially the same estimated distance) are visually (see Fig. 9) difficult to compare given the higher resolution data from Ref. 8 and different extents of the coverage. However, if we hope to address the question of whether or not mass models should include a bulge, it is necessary to agree on a set of rotation curves, associated uncertainties, and luminous M/L in the same wavelength bands. Consistent with the conjecture in section 4.4.3, the LCM fit results from Ref. 8 assumptions (with a bulge component) have larger values than those from Ref. 7 assumptions. The LCM fits (from Ref. 8) do return a bulge M/L which is smaller than that of the disk, by a factor of approximately .
4.4.8 NGC 4138, NGC 5907 and NGC 3992
The rotation curves for Ursa Major galaxies NGC 4138, NGC 5907 and NGC 3992 as reported in Ref. 10 (Sanders & McGaugh, 2002), are associated with luminous profiles from MOND fits. The rotation curve data is from Sanders & Verheijen (1998); Sanders (1996). The Ref. 10 rotation curve derivation and luminous mass modeling assumptions are described in section 4.3.3. These three galaxies are grouped because they have similar enclosed mass at the limit of the data (indicated by ).
Comparison of these three galaxies, and their associated , may challenge the conjecture in section 4.4.3. The ranking, in increasing order is: NGC 4138, NGC 5907, NGC 3992. Correlating increasing with increasing density gradients in the luminous matter is challenged by the fact that in the Ref. 10 analysis, NGC 5907 has a bulge, whereas the high surface brightness galaxy NGC 3992 does not. The NGC 5907 bulge M/L is proportionally smaller than that of the disk, by about a factor of two, so it remains possible that NGC 3992 has a steeper density gradient. Bottema & Verheijen (2002) reports that NGC 3992 is a highly non-exponential, extreme Freeman type II galaxy. The LCM fits for NGC 4138 indicates that Ref. 10 over-estimates the luminous mass at small radii. Fits for NGC 4138, NGC 5907 and NGC 3992 are shown in Fig. 9.
4.4.9 NGC 2903
NGC 2903 is a high surface brightness galaxy, for which we sample the reported rotation curves and associated luminous profiles from Ref. 3 (de Blok et al., 2008), Ref. 8 (Gentile et al., 2011) and Ref. 10 (Sanders & McGaugh, 2002). Distance indicators for the three authors are: Ref. 3 (NFW fit) uses the brightest stars distance of Mpc, Ref. 8 (MOND fit) uses the constrained brightest stars distance of Mpc, and Ref. 10 (MOND fit) uses the Hubble flow distance Mpc from Begeman (1987). The Ref. 3 and Ref. 8 rotation curve agree with that reported in Begeman (1987), though Begeman’s rotation curve rises more steeply in the inner radii. Ref. 3 attributes this difference to Begeman not using a full tilted-ring model in the inner parts of the galaxy, therefore not accounting for the sudden changes in the P.A. and inclination in his analysis. See sections 4.3.1, 4.3.2 and 4.3.3 for details of the total light decomposition and rotation curve derivations for these three references. Due to non-circular motions and the presence of a bar, constraints on the inner radii of NGC 2903 remain open questions. The gas profile used in Ref. 10 is from Begeman (1987), of . Out to a radius of kpc, the Ref. 3 and Ref. 8 gas profiles agree with Ref. 10. However at larger radii, the gas profiles of Ref. 3 and 8 are far larger than that in Ref. 10.
The major distinguishing feature between the Ref. 3 luminous profile and those in Ref. 8 and Ref. 10 is that Ref. 3 includes a bulge. Since the errors and rotation curves from Ref. 3 and Ref. 8 are essentially identical, it is telling that the two separate luminous profiles returned essentially equivalent LCM values. However, visually the Ref. 3 luminous profile with a bulge, as compare to Xue Milky Way in Fig. 9 is slightly better than that for Ref. 8. However, the Ref. 3 LCM results are unstable, as all the other Milky Way pairings returned a bulge M/L value of zero. This is an ambiguous result, because the chi-square for the Xue pairing is easily twice as good as any of the other pairs, see Table 3. Additionally, this is the only pairing in the group of nine () pairs which returns a minimal gas scaling. These three data sets do indicate consistency with the conjecture in section 4.4.3 because the total light profile reported from Ref. 8 is steeper in the density gradient in the inner kpc than either Ref. 3 or Ref. 10. This can be seen in the Keplerian profiles in Fig. 9.
4.4.10 NGC 3953, UGC 6973, NGC 4088 and NGC 3726
The rotation curves for Ursa Major Galaxies NGC 3953, UGC 6973 NGC 4088 and NGC 3726 are reported in Ref. 10 (Sanders & McGaugh, 2002), with luminous profiles resulting from MOND fits. Rotation curve data is reported from Sanders & Verheijen (1998); Sanders (1996). Rotation curve and modeling assumptions are described in section 4.3.3. UGC 6973 and NGC 4088 are reported as being kinematically disturbed. Fit results for all three galaxies are reported as consistent with PSM predictions. Reported gas masses, in H I are: for N3953 , for U6973 , for NGC 4088 and for NGC 3726 .
These four galaxies are found to have approximately the same enclosed mass at the limit of the data (), but two distinct sets of . Averaged over the Milky Way pairings, these are: for NGC 3953 & UGC 6973 and for N4088 & N3726 . As is clear in Fig. 10, the more central mass distributions of NGC 3953 and UGC 6973, as compared to NGC 3953 and UGC 6973, are consistent with the conjecture in section 4.4.3.
4.4.11 NGC 6946
NGC 6946 is a late-type spiral at the limit of low inclinations which can feasibly be studied kinematically. The two rotation curves we sample are from Ref. 3 (de Blok et al., 2008) and Ref. 10 (Sanders & McGaugh, 2002). Their rotation curves differ enormously, both in magnitude and functional line shape with respect to , see Fig. 9. The rotation curve data in Ref. 10 comes from Carignan et al. (1990) and they report a MOND fit with luminous matter modeling estimates reported in Sanders (1996). Ref. 3 notes that the differences in their reported rotation curves is most likely due to the assumption of inclination angle; Ref. 3 uses versus that of Ref. 10 . They also use different distance estimates: Ref. 3 uses Mpc (Walter et al., 1985) and Ref. 10 uses Mpc (Carignan et al., 1990). Ref. 3 notes for NGC 6946 the large galaxy size relative to the beam size.
Since the error budget on the Ref. 3 rotation curve is easily twice that of Ref. 10, it is significant that the LCM fits to from Ref. 10 assumptions are three times better than those from the Ref. 3 assumptions. Physically, Ref. 3 and Ref. 10 provide very different NGC 6946s. Ref. 3 gives a fixed bulge and disk M/L from PSM, and Ref. 10 gives only a stellar disk, with M/L free. The LCM decreases the M/L reported in Ref. 3 by approximately , and increases that reported by Ref. 10 by about the same margin. The galaxy, as reported by Ref. 3, yields maximal gas scalings, whereas the galaxy as reported by Ref. 10 returns minimal gas scalings.
4.4.12 NGC 3198
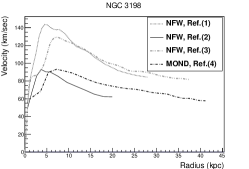
For the high surface brightness spiral galaxy NGC 3198 we sample four different data sets. NGC 3198 is a moderately-inclined, late-type galaxy with a small central bar and is one of the standards for flat rotation-curve studies due to its high symmetry and regular rotations. We compare the best gas measurements from Ref. 4 (Gentile et al., 2013), the best rotation curve data Ref. 3 (de Blok et al., 2008), the older standard from Ref. 1 (Begeman, 1989), and an alternate interpretation of the Ref. 1 rotation curve in Ref. 2 (Navarro, 1998). Ref. 1-3 report NFW fits and Ref. 4 a MOND fit. Ref. 1 and 2 use the distance of Mpc (Hubble Flow), Ref. 3 uses Mpc (Cepheids), and Ref. 4 uses Mpc (constrained from the Cepheids). Ref. 1 and Ref. 2 use the Begeman (1987) rotation curve, based on a tilted-ring model derivation. The Ref. 3 rotation curve derivation is described in section 4.3.1. The Ref. 4 rotation curve is from the HALOGAS (Heald et al., 2011) survey of the extra-planar gas in 22 spiral galaxies using very deep H I observations, , augmented by observations. The rotation curve derivation reported in Ref. 4 is from a tilted-ring model with intensity-weighted velocity fields, treating each side of the galaxy separately. Ref. 4 uses a 3D model of the H I layers, giving attention to variable inclinations for the rings, position angles, and the features of variable rotation speeds as a function of distance from the plane. They find previously unreported gas features and show a lag on the rotation velocities of the extra planar gas. They analyze the H emission to detect stellar light out to the end of the extra planar gas. Ref. 4 reports H I gas mass of which is higher than reported in Ref. 3. They attribute the difference to amplitude calibrations and detection of extra planar gas. Ref. 1 and 2 report gas mass of . All four citations return maximal LCM gas scalings of . In Ref. 4, the authors show all the NGC 3198 rotation curves compared here, plotted on an arc second scale. On that scale, all the rotation curves are similar, modulo the noise. However, as can be seen in Fig. 10, the conversion to the assumed distance scales causes projection differences in the rotation curves.
As can be seen in Fig. 1, the reported luminous mass profiles vary significantly for this galaxy in geometry and magnitude. Modulo fixed geometry assumptions, the LCM returns similar luminous profiles for all four data sets, as shown in Fig. 10. Ref. 4 uses the same geometry as Ref. 3, but a lower M/L ratio. Ref. 1 and Ref. 2 respectively report M/L of and in the r-band, in solar mass units. The resulting LCM average M/L were respectively and , demonstrating convergence. Ref. 3 and Ref. 4 respectively report M/L of and in the band, in solar mass units. The resulting LCM average M/L were respectively and , again demonstrating convergence. Visually, the LCM fit values for Ref. 2 are basically equivalent to those of Ref. 1 and those of Ref. 4 are superior to Ref. 3. The Ref. 3 assumptions over-predict the luminous profile at small radius.
The values are very consistent across all four of these posited luminous NGC 3198 profiles, despite differences in the posited distances.
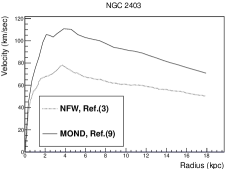
4.4.13 NGC 2403
Fig. 10 NGC 2403 is a late-type Sc spiral in the M81 group, dominated by regular rotations. We sample two data sets: Ref. 3 (de Blok et al., 2008) and Ref. 9 (Bottema et al., 2002). The Ref. 3 luminous profile is fixed by PSMs, and that of Ref. 9 is from a MOND fit; both using the Cepheid based distance of Mpc. Ref. 3 reports an NFW fit to the rotation curve data. The reported rotation curves are identical, modulo noise, as are the gas profiles. Ref. 9 reports a total gas mass of , which is H I multiplied by to account for primordial Helium abundances. Ref. 3 notes that the velocity in the inner kiloparsecs are suspect to beam smearing effects, given the steep increase in velocity.
Both Ref. 3 and 9 use exponential disk geometries, respectively reporting stellar disk M/L in Ref. 9 of and Ref. 3 of . As can be seen in Fig. 1, this results in higher Keplerian velocities due to the stellar disk in Ref. 9 than in Ref. 3, by approximately . The LCM scales down the stellar disk M/L from Ref. 9 and maintains that reported in Ref. 3. Both sets of fits return maximal gas scalings.
That the values from Ref. 3 assumptions are slightly higher than those for Ref. 9, consistent with the conjecture in section 4.4.3, given that the geometry assumptions for the exponential disk in Ref. 3 indicates the same inner rise rate as in Ref. 10, but a much faster decline in the light, and associated mass, profile – and thereby a steeper density gradient.
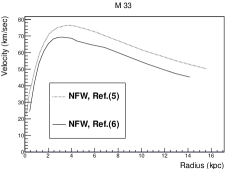
4.4.14 M 33
The galaxy M 33 in our Local group is used as a standard distance calibrator, measured independent of the Hubble flow to be at a distance of Mpc. It is a low-luminosity, very blue, active star forming spiral galaxy with major implications for galaxy evolution and formation models. M33 is smaller than the Milky Way and hence tends to be denoted as being dark matter dominated (Salucci & Burkert, 2000). The LCM successfully fits this galaxy without a dark matter halo in two reports: Ref. 5 (Corbelli, 2003)and Ref. 6 (Corbelli & Salucci, 2000). These two rotation curve are respectively observed in: molecular gas (Ref. 5) and -cm (Ref. 6). The two rotation curves differ only in fine detail and have essentially the same error budgets. Ref. 5 reports their luminous profile in the context of an NFW fit, and Ref. 6 in the context of a model independent dark matter fit, consistent with CDM models.
Including molecular gas in Ref. 5 results in total gas mass of Ref. 5 as compared to that previously reported in Ref. 6 of ). This mass is predominantly added to M 33 past the radius of kpc, which taken with the two different scale lengths used for the exponential disk geometries, results in slight modifications in the overall geometries implied in the two models. The LCM values indicate that the Ref. 6 luminous distribution is approximately five times better than that of Ref. 5. Since the gas observations are more complete in Ref. 5, we assume the difference between these two fits is based upon the choice of scale length. Ref. 5 uses an exponential scale length of kpc and Ref. 6 uses kpc, both in the K-band.
Consistent with the conjecture in section 4.4.3, values for are larger for Ref. 6 assumptions with a steeper density gradient. Ref. 5 notes that after subtracting the disk profile from the total light, there remains excess central emission which motivates the interpretation given here.
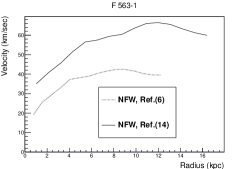
4.4.15 F 563-1 and NGC 925 and NGC 7793
The smallest galaxies in our sample are F 563-1, NGC 925 and NGC 7793. For each galaxy we compare two reports in the literature (rotation curve and luminous assumptions). For F 563-1, we compare NFW fits in Ref. 2 (Navarro, 1998) and Ref. 13 (Giraud, 2000). Ref. 2 is rotation curve data reported by de Blok & McGaugh (1997) and Ref. 13 is rotation curve data reported by McGaugh & De Blok (1998). For NGC 925, we compare the fits from Ref. 3 (de Blok et al., 2008), reported in the context of NFW and ISO models and both reporting M/L fixed by PSM. For NGC 7793, we compare a MOND fit in Ref. 8 (Gentile et al., 2011) and an ISO fit in Ref. 14 (Dicaire et al., 2008).
The low surface brightness galaxy F 563-1 reported in Ref. 2 and Ref. 13 is at a distance of 45 Mpc. Both references use an exponential disk. Visually, in Fig. 11, the LCM fits using the luminous mass assumptions from Ref. 2 are slightly better than those from Ref. 13, but the resulting M/L from Ref. 13 assumptions are more physically acceptable. Ref. 13 uses a similar disk profile to that reported in Ref. 2, but on average resulting in associated orbital velocities which are about higher(see Fig. 1). Both sets of fits require maximal LCM gas scalings.
NGC 925, late-type barred spiral at a reported distance of Mpc, is a very interesting example, as it indicates something physical about the LCM mapping. From Ref. 3 we sample two very different luminous profiles, consistent with the ISO and NFW, bot fits for M/L fixed by PSM. The ISO fit returns a significantly lower M/L than reported for the NFW fits, based on observations of the rotation curve. The LCM fit lowers the ISO M/L substantially, but does not set it to zero as is done in Ref. 3 for their NFW fit with M/L free. The fascinating feature from the ISO starting assumptions is that the luminous mass features (in ISO) are constructed to mimic the bumps in the rotation curve, but in the LCM fits shows it is actually the mirror image of these features that is reflected in the rotation curve. We interpret this as a lens-type effect, where small luminous mass features in galaxies that map mostly onto the bulge of the Milky Way are magnified and inverted. This key feature could lead to refinement of the luminous mass modeling of low luminosity and dwarf galaxies, based exclusively on the rotation curve data. LCM fits using both the ISO and the NFW luminous profiles failed when paired to the Sofue (2013) Milky Way.
NGC 7793 is a late-type spiral in the Sculptor group. The two rotation curves compared here come from -cm observations reported in Ref. 8 and observations in Ref. 14. They differ outside of kpc, where Ref. 14 rotation velocities begin to decline faster than those reported in Ref. 8. The two luminous profiles use slightly different distance estimates, which may account for the differing rotation curves. Ref. 8 uses distance of Mpc from the tip of the red giant branch indicator and Ref. 14 uses the distance of Mpc from Carignan & Puche (1990). Ref. 14 fails when compared to Milky Way Sofue (2013), but is otherwise very stable in the other three pairings. Ref. 8 notes that redder galaxies generally require higher stellar M/L, but they report MOND best-fit . The M/L reported in Ref. 14 is much larger, but in a different wavelength band. However, visually the LCM fits indicate that the luminous assumptions in Ref. 14 are clearly preferable (Fig. 11).
The average values for F 563-1, NGC 925 and NGC 7793 are consistent with the conjecture in section 4.4.3.
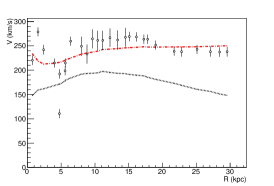
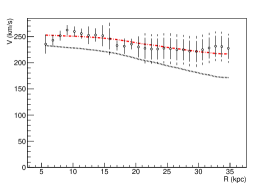
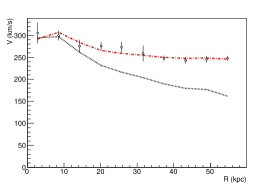
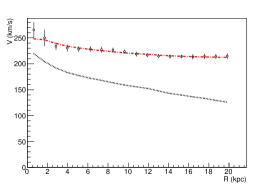
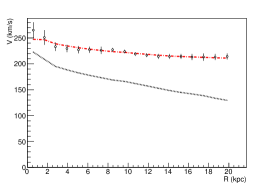
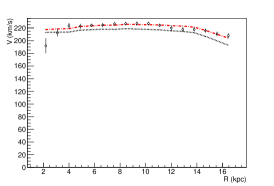
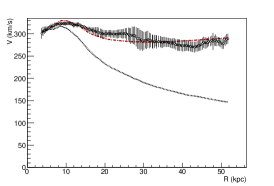
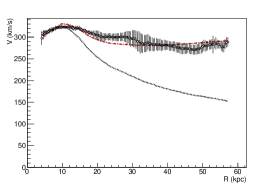
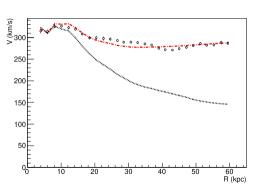
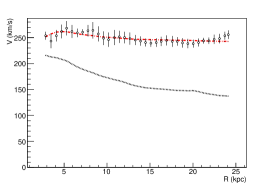
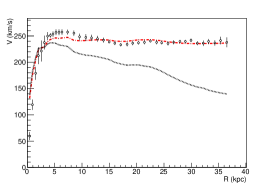
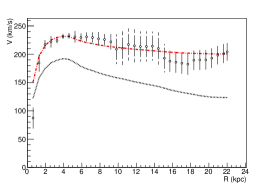
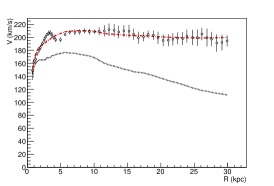
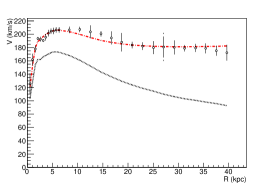
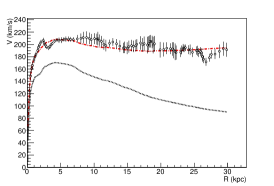
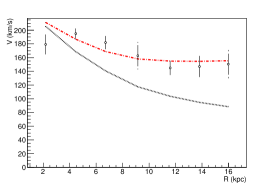
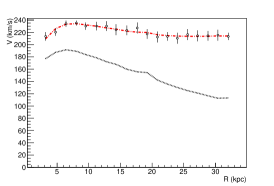
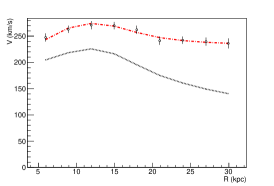
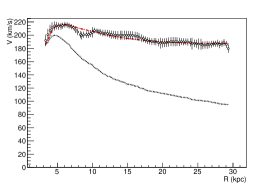
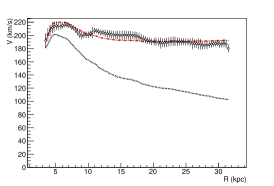
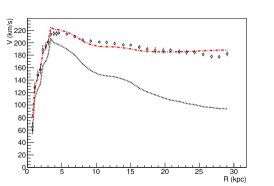
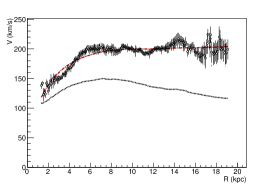
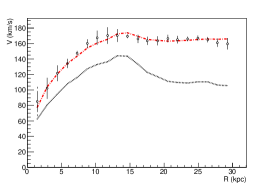
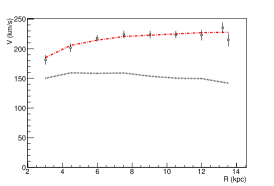
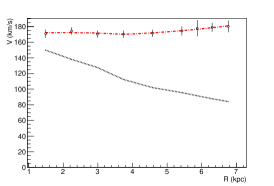
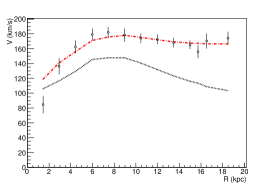
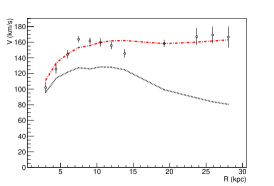
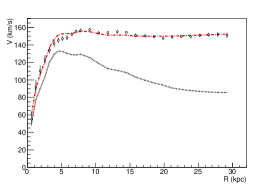
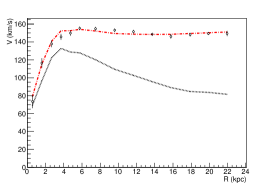
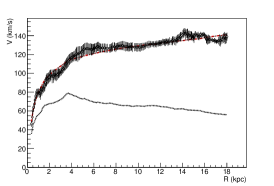
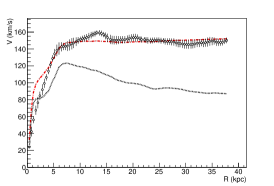
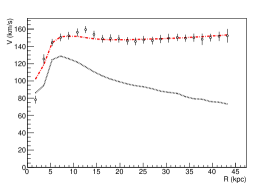
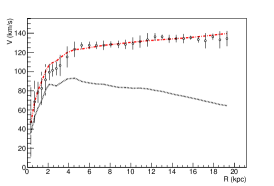
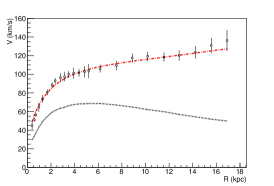
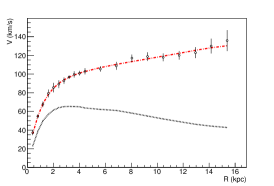
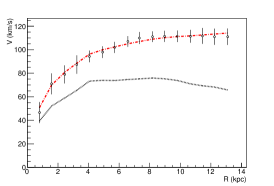
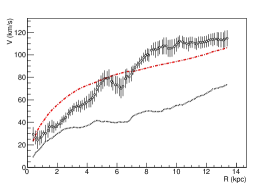
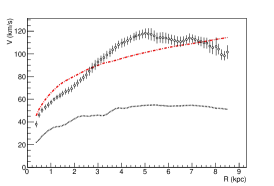
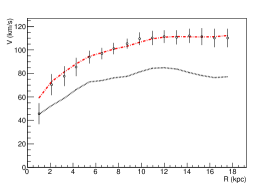
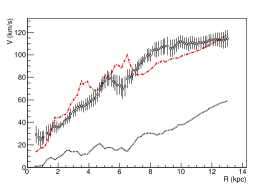
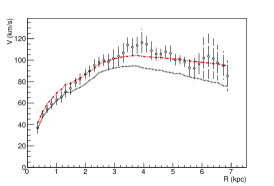
5 Conclusions
It has been noted by Bottema et al. (2002) that a credible, empirical alternative to dark matter must:
-
•
successfully predict rotation curves with reasonable estimates of the stellar mass-to-light ratios and gas fractions,
-
•
make sense within our physics framework,
-
•
predict various other astrophysical observations,
-
•
and have one universal parameter.
At this stage, the LCM does the following:
-
•
Successfully predict rotation curves for the sample of galaxies reported here as evidenced by the average reduced . For the MOND subset of 21 data sets: the MOND vs. the LCM . For the dark matter model subset of 19 data sets: the dark matter model whereas that for the LCM fits was . LCM fits resulted in reasonable estimates of the luminous matter reported in Table 2.
-
•
Makes sense in our physical framework: the LCM is based on classical physics and luminous matter, and it fits galactic rotation curves based on the postulate that observed frequency shifts include both relative velocity and relative curvature components. Both effects are phrased in terms of the equivalent Lorentz Doppler-shifts, by the kinematics of the Lorentz group.
In future investigations, the LCM can be extended to:
-
•
Predict other astrophysical phenomena by analytical extension to other metric geometries and dynamics;
-
•
Include a physical interpretation of the free parameter . There is some evidence of a correlation between and the steepness of the density gradient (section 4.4.3), but further theoretical developments and tests on a larger sample of galaxies are needed. This would constitute the single universal parameter discussed by Bottema et al. (2002).
Our fits indicate that it may be possible to constrain population synthesis modeling directly from rotation curve data in the cases of M 33 and NGC 925. For M 33 the LCM makes a direct constraint to the two reported disk scale lengths, which differ by about . In the case of NGC 925, the resulting LCM fits demonstrate the galaxy’s luminous profile appears to be magnified and flipped in small spatial features in the rotation curve, much as would be done by an optical lens. In both cases, the defining feature that allows the LCM to constrain population synthesis modeling is the compatibility of rotation curves, uncertainties, distances, M/L bands, scale lengths, etc.
In many of the LCM fits it is clear that the gas scalings are maximal or minimal, which is not to be taken as indication that the gas observations are at fault, but rather that the gas profiles are compensating for stellar models that are not appropriate. In the view of the authors, once the stellar profiles and rotation curves have been constrained to best approximation, gas scalings will be indicative of real features. This is already the case for the M 33 fit using Ref. 6.
In the future, as the LCM sample size increases, trends in the fits will indicate which Milky Way luminous mass model most closely represents the true mass distribution. At this stage of the analysis there is not a statistical preference in the fits for one model over another. One particularly interesting question for future work is how to construct the LCM for the rotation curve of the Milky Way itself; in this case the receiver frame is imbedded in the emitter frame. Weak lensing problems are another place to which investigations can easily be extended, as weak lensing has already been phrased in the geometric terms of Schwarzschild coordinate light speeds and effective indices of refraction by Narayan et al. (1997).
Given the role that the luminous matter of galaxies plays in the our understanding of dark energy and the Hubble flow, indications from free parameters are critical to the big picture. Initial investigations into relations between the free parameter and the scale lengths are beyond the scope of the present paper. Once the physical significance of the parameter has been identified, it will be possible to directly report the luminous matter distribution from the observed shifted spectra. It remains possible that the LCM free parameter indicates scaling relations between the dark matter halo and the luminous matter distribution; if that is so, the LCM offers an alternate method for luminous matter modeling with fewer parameter constraints on such a relationship.
6 Acknowledgments
The authors would like to thank R. A. M. Walterbos, V. P. Nair, M. Inzunza II, J. Conrad, V. Papavassiliou, T. Boyer, P. Fisher, E. Bertschinger and I. Cisneros.
S. Cisneros is supported by the MIT Martin Luther King Jr. Fellowship, while J. A. Formaggio and N. A. Oblath are supported by the United States Department of Energy under Grant No. DE-FG02-06ER- 41420.
References
- Aalseth et al. (2013) Aalseth C., et al., 2013, Phys.Rev., D88, 012002
- Agnese et al. (2013) Agnese R., et al., 2013, Phys.Rev.Lett.
- Angle et al. (2008) Angle J., et al., 2008, Phys.Rev.Lett., 100, 021303
- Battaglia et al. (2006) Battaglia G., Fraternali F., Oosterloo T., Sancisi R., 2006, A& A, 447, 49
- Begeman (1987) Begeman K., 1987, PhD thesis, University of Groningen, Rijksuniversiteit Groningen
- Begeman (1989) Begeman K., 1989, A&A, 223, 47
- Bell & de Jong (2001) Bell E. F., de Jong R. S., 2001, ApJ, 550, 212
- Bernabei et al. (2010) Bernabei R., et al., 2010, Eur.Phys.J., C67, 39
- Binney & Tremaine (2008) Binney J., Tremaine S., 2008, Galactic Dynamics, 2nd edn. Princeton University Press: Princeton, NJ
- Bosma (1978) Bosma A., 1978, PhD thesis, PhD Thesis, Groningen Univ., (1978)
- Bottema et al. (2002) Bottema R., Pestana J., Rothberg B., Sanders R., 2002, A&A, 393, 453
- Bottema & Verheijen (2002) Bottema R., Verheijen M. A., 2002, A&A, 388, 793
- Braun et al. (2009) Braun R., Thilker D. A., Walterbos R. A. M., Corbelli E., 2009, ApJ, 695, 937
- Brun & Rademakers (1997) Brun R., Rademakers F., 1997, Nucl. Inst. & Meth. in Phys. Res. A, 389, 81
- Carignan (1985) Carignan C., 1985, ApJ, 299, 59
- Carignan et al. (1990) Carignan C., Charbonneau P., Boulanger F., Viallefond F., 1990, AAP, 234, 43
- Carignan & Chemin (2006) Carignan C., Chemin L., 2006, ApJ, 641, L109
- Carignan & Puche (1990) Carignan C., Puche D., 1990, AJ, 100, 394
- Chatterjee (1987) Chatterjee T., 1987, Ap&SS, 139, 243
- Cisneros et al. (2012) Cisneros S., Goedecke G., Beetle C., Engelhardt M., 2012, arxiv:1203.2502
- Cisneros et al. (2013) Cisneros S., Oblath N., Formaggio J., Goedecke G., Chester D., et al., 2013, ARXIV:1309.7370
- Conroy et al. (2009) Conroy C., Gunn J., White M., 2009, ApJ, 699, 486
- Corbelli (2003) Corbelli E., 2003, MNRAS, 342, 199
- Corbelli & Salucci (2000) Corbelli E., Salucci P., 2000, MNRAS, 311, 441
- de Blok & McGaugh (1997) de Blok W., McGaugh S., 1997, MNRAS., 290, 533
- de Blok et al. (2008) de Blok W., Walter F., Brinks E., 2008, AJ, 136, 2648
- Dicaire et al. (2008) Dicaire I., Carignan C., Amram P., Marcelin M., Hlavacek-Larrondo J., et al., 2008, AJ, 135
- Fowles & Cassidy (2005) Fowles G., Cassidy G., 2005, Analytical Mechanics, 7th edn. Thomson Brooks & Cole: Belmont, CA, USA
- Fraternali et al. (2011) Fraternali F., Sancisi R., Kamphuis P., 2011, A&A, http://arxiv.org/abs/1105.3867
- Freedman et al. (2001) Freedman W. L., Madore B. F., Gibson B. K., Ferrarese L., Kelson D. D., Sakai S., Mould J. R., Kennicutt Jr. R. C., Ford H. C., Graham J. A., Huchra J. P., Hughes S. M. G., Illingworth G. D., Macri L. M., Stetson P. B., 2001, ApJ, 553, 47
- Gentile et al. (2011) Gentile G., Farnaey B., de Blok W., 2011, A&A, 527, A76
- Gentile et al. (2013) Gentile G., Józsa G. I. G., Serra P., Heald G. H., de Blok W. J. G., Fraternali F., Patterson M. T., Walterbos R. A. M., Oosterloo T., 2013, AAP, 554, A125
- Gianfranco et al. (2005) Gianfranco B., Hooper D., Silk J., 2005, Physics Reports, 405, 279
- Giraud (2000) Giraud E., 2000, AJ, 531, 701
- GraphClick (2013) GraphClick 2013, Arizona Software. http://www.arizona-software.ch/graphclick/
- Hartle (2003) Hartle J., 2003, Gravity. Addison-Wesley
- Heald et al. (2011) Heald G., Józsa G., Serra P., Zschaechner L., Rand R., Fraternali F., Oosterloo T., Walterbos R., Jütte E., Gentile G., 2011, AAP, 526, A118
- Jackson (1999) Jackson J., 1999, Classical Electrodynamics, 3rd edn. John Wiley & Sons, Inc., New Jersey, USA
- Kamionkowski & Kinkhabwala (1998) Kamionkowski M., Kinkhabwala A., 1998, Phys.Rev., D57, 3256
- Kent (1989) Kent S. M., 1989, PASP, 101, 489
- Klypin et al. (2002) Klypin A., Zhao H., Somerville R., 2002, ApJ, 573, 597
- McGaugh & De Blok (1998) McGaugh S. S., De Blok W., 1998, ApJ, 499, 66
- Mannheim & O’Brien (1997) Mannheim P., O’Brien J., 1997, Journal of Physics: Conference Series 437 (2013) 012002
- Milgrom (1983) Milgrom M., 1983, ApJ, 270, 371
- Narayan et al. (1997) Narayan R., Bartelman M., 1997, Formation of Structure in the Universe: Lectures on Gravitational Lensing. A. Dekel & J. P. Ostriker
- Navarro (1998) Navarro J., 1998, arxiv:astro-ph/9807084
- Navarro et al. (1997) Navarro J., Frenk C., White S., 1997, ApJ, 462, 563
- Oosterloo et al. (2007) Oosterloo T., Fraternali F., Sancisi R., 2007, Astron.J., 134, 1019
- Persic & Salucci (1988) Persic M., Salucci P., 1988, MNRAS, 234, 131
- Persic & Salucci (1990) Persic M., Salucci P., 1990, MNRAS, 245, 577
- Pierce et al. (1994) Pierce M., Welch D., McClure R., van den Bergh S., Racine R., et al., 1994, Nature, 371, 385
- Radosz et al. (2013) Radosz A., Augousti A. T., Siwek A., 2013, Gen.Rel.Grav., 45, 705
- Rahvar & Mashoon (2014) Rahvar S., Mashoon B., 2014, arXiv:1401.4819v1
- Randriamampandry & Carignan (2014) Randriamampandry T. H., Carignan C., 2014, MNRAS, 439, 2132
- Rubin et al. (1980) Rubin V., Ford W., Thonnard N., 1980, ApJ, 238, 471
- Rubin et al. (1978) Rubin V. C., Thonnard N., Ford Jr. W. K., 1978, ApJ, 225, L107
- Salpeter (1955) Salpeter E. E., 1955, ApJ, 121, 161
- Salucci & Burkert (2000) Salucci P., Burkert A., 2000, ApJ, 537, L9
- Sanders (1996) Sanders R., 1996, ApJ, 473, 117
- Sanders & McGaugh (2002) Sanders R., McGaugh S., 2002, ARA&A, 40, 263
- Sanders & Verheijen (1998) Sanders R., Verheijen M., 1998, AJ, 503, 97
- Sofue (2013) Sofue Y., 2013, Mass Distribution and Rotation Curve in the Galaxy. Oswalt, T. D. and Gilmore, G., p. 985
- Sofue & Kato (1981) Sofue Y., Kato T., 1981, PASJ, 33, 449
- Tully & Pierce (2000) Tully R. B., Pierce M. J., 2000, ApJ, 533, 744
- Walter et al. (1985) Walter F., Brinks E., de Blok W., Bigiel F., Kennicutt R., et al., 1985, AJ, 136, 2563
- Walterbos & Kennicutt (1987) Walterbos R. A. M., Kennicutt R. C., 1987, A&A, 69, 311
- Walterbos & Kennicutt (1988) Walterbos R. A. M., Kennicutt R. C., 1988, A&A, 198, 61
- Widrow et al. (2003) Widrow L. M., Perrett K. M., Suyu S. H., 2003, AJ, 588, 311
- Xue et al. (2008) Xue X., et al., 2008, AJ., 684, 1143