11email: lghou@nao.cas.cn, hjl@nao.cas.cn
The observed spiral structure of the Milky Way††thanks: Appendix A is available in electronic form at httpwww.aanda.org. ††thanks: Full Tables A.1–A.3 are only available at the CDS via anonymous ftp to cdsarc.u-strasbg.fr (130.79.128.5) or via httpcdsarc.u-strasbg.fr/viz-bin/qcat?J/A+A/569/A125 and also at the authors’ webpage: httpzmtt.bao.ac.cn/milkyway/
Abstract
Context. The spiral structure of the Milky Way is not yet well determined. The keys to understanding this structure are to increase the number of reliable spiral tracers and to determine their distances as accurately as possible. HII regions, giant molecular clouds (GMCs), and 6.7 GHz methanol masers are closely related to high mass star formation, and hence they are excellent spiral tracers. The distances for many of them have been determined in the literature with trigonometric, photometric and/or kinematic methods.
Aims. We update the catalogs of Galactic HII regions, GMCs, and 6.7 GHz methanol masers, and then outline the spiral structure of the Milky Way.
Methods. We collected data for more than 2500 known HII regions, 1300 GMCs, and 900 6.7 GHz methanol masers. If the photometric or trigonometric distance was not yet available, we determined the kinematic distance using a Galaxy rotation curve with the current IAU standard, = 8.5 kpc and = 220 km s-1, and the most recent updated values of = 8.3 kpc and = 239 km s-1, after velocities of tracers are modified with the adopted solar motions. With the weight factors based on the excitation parameters of HII regions or the masses of GMCs, we get the distributions of these spiral tracers.
Results. The distribution of tracers shows at least four segments of arms in the first Galactic quadrant, and three segments in the fourth quadrant. The Perseus Arm and the Local Arm are also delineated by many bright HII regions. The arm segments traced by massive star forming regions and GMCs are able to match the HI arms in the outer Galaxy. We found that the models of three-arm and four-arm logarithmic spirals are able to connect most spiral tracers. A model of polynomial-logarithmic spirals is also proposed, which not only delineates the tracer distribution, but also matches the observed tangential directions.
Key Words.:
Galaxy: disk – Galaxy: structure – Galaxy: kinematics and dynamics – HII regions – ISM: clouds1 Introduction
The Milky Way is known to be a barred spiral galaxy, as shown by surveys of molecular gas (Dame et al. 2001), neutral gas (Burton 1988), and by infrared star counts (Benjamin et al. 2005). We do not know its precise structure, e.g., the number and position of spiral arms, the location and length of the Galactic bar, however. The obstacle is that the Sun is located on the edge of the Galactic disk close to the Galactic plane, so that we can only see the superposition of various structure features (e.g., spiral arms, spurs, arm branches, and Galactic bars) along the observed line of sight. It is difficult to disentangle the features and determine the relative position of spiral tracers accurately.
To outline the precise structure of the Galaxy, a large number of spiral tracers should be detected over the disk with distances determined as accurately as possible. Observationally, it has been shown that the narrow and sharply defined spiral arms of a galaxy could be well delineated by the distribution of massive star forming regions or giant molecular clouds (GMCs; e.g., Israel et al. 1975; Georgelin & Georgelin 1976; Downes et al. 1980; Grabelsky et al. 1988; Garcia-Burillo et al. 1993; Russeil 2003; Binney & Tremaine 2008; Hou et al. 2009). HII regions and 6.7 GHz methanol masers are situated in massive star forming regions, and closely related to massive young stars. GMCs are the birthplace of massive stars, and have been widely used to reveal bright spiral arms and the gas arms of galaxies (Binney & Tremaine 2008). In the Milky Way, they are particularly useful in mapping the spiral pattern, because they are bright and can be widely detected throughout the Galactic plane (as far as 20 kpc away from the Sun, e.g., Anderson et al. 2011; Dame & Thaddeus 2011). The radio recombination lines from HII regions, the methanol maser lines near 6.7 GHz, and the molecular rotational transitions are almost unabsorbed by the interstellar medium.
Much effort has been dedicated to search for Galactic HII regions, GMCs, or masers, then to determine their distances to infer the spiral structure of our Galaxy. A good amount of observational data exist in literature (e.g., Downes et al. 1980; Caswell & Haynes 1987; Solomon et al. 1987; Grabelsky et al. 1988; Araya et al. 2002; Russeil 2003; Paladini et al. 2004; Sewilo et al. 2004). We have cataloged from the literature 815 HII regions and 963 GMCs with known trigonometric, photometric, or kinematic distances, and combined all these data to delineate the spiral structure of the Milky Way (Hou et al. 2009). A polynomial-logarithmic model of spiral arms was proposed to fit the data distribution and match the observed tangential directions of spiral arms.
In the last few years, much progress toward understanding the spiral structure of our Galaxy has been made. First of all, a large number of new spiral tracers have been detected (e.g., Rathborne et al. 2009; Anderson et al. 2011; Green & McClure-Griffiths 2011; García et al. 2014). Some newly discovered HII regions or GMCs even as far as 20 kpc from the Sun (Anderson et al. 2011; Dame & Thaddeus 2011) provide important data to reveal the spiral structure in the outer Galaxy. The kinematic distance ambiguity for many HII regions, GMCs, and 6.7 GHz methanol masers has been solved (e.g., Roman-Duval et al. 2009; Lépine et al. 2011; Green & McClure-Griffiths 2011; Anderson et al. 2012; Urquhart et al. 2012; Jones & Dickey 2012), which enables us to estimate their kinematic distances. In addition, the more reliable trigonometric or photometric distances of a number of HII regions or masers have been measured (e.g., Rygl et al. 2010; Sato et al. 2010a; Moisés et al. 2011; Xu et al. 2011, 2013; Russeil et al. 2012; Zhang et al. 2014; Foster & Brunt 2014). The available spiral tracers have almost doubled as compared to those listed in Hou et al. (2009).
Second, some fundamental parameters of the Galaxy have been observationally modified. Based on the stellar kinematics in the solar neighborhood, Schönrich et al. (2010) revised the solar motions with respect to the Local Standard of Rest (LSR) as km s-1 (radially inward), km s-1 (in the direction of Galactic rotation), and km s-1 (vertically upward, all in J2000), which are inherently incorporated in the LSR velocities of spiral tracers, hence influence the estimation of their kinematic distances. A consistent value of the distance of the Sun to the Galactic center (GC), kpc, was proposed by Brunthaler et al. (2011), who incorporated studies on stellar orbits in the GC (Ghez et al. 2008; Gillessen et al. 2009) and trigonometric parallax measurements toward Sgr B2 (Reid et al. 2009c) and massive star forming regions (Reid et al. 2009b; Brunthaler et al. 2011). The circular rotation of the LSR, , was estimated to be 239 km s-1 (Brunthaler et al. 2011). Some recent papers (e.g., Schönrich 2012; Reid et al. 2014) confirmed the results of Brunthaler et al. (2011). The values of both and are different from the IAU recommended values, 8.5 kpc and 220 km s-1.
The exciting new progress mentioned above motivates us to update the catalogs of the spiral tracers in Hou et al. (2009), namely, the HII regions, GMCs, and also to add the 6.7 GHz methanol masers in this paper, and then to delineate the spiral structure of the Milky Way. This work is organized as follows. In Sect. 2, we update the catalogs of spiral tracers and make them publicly available. In Sect. 3, we discuss the distributions of different kinds of spiral tracers and their combination. Then, we use the models of three- and four-logarithmic spiral arms and a model of polynomial-logarithmic spirals to connect the identified arm segments. Discussions and conclusions are given in Sect. 4.
2 Tracers for the Galactic spiral structure
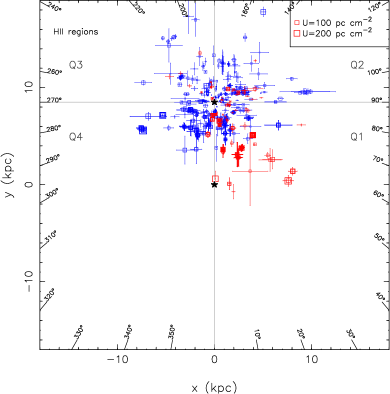
The primary tracers for spiral arms are HII regions, GMCs, and 6.7 GHz methanol masers. To outline a precise spiral pattern, the distances of spiral tracers should be determined as accurately as possible. At present, the most reliable measurements come from the trigonometric parallax observations (e.g., Xu et al. 2006; Honma et al. 2012; Reid et al. 2014) and the photometric method (e.g., Russeil et al. 2007; Foster & Brunt 2014). The HII regions with known photometric or trigonometric distances are shown in Fig. 1, which cannot be used to infer the large-scale spiral pattern of our Galaxy because data are sparse and limited within about 6 kpc from the Sun.
To uncover the spiral pattern of the Milky Way, we have to involve the large number of spiral tracers with kinematic distances at present. The spiral tracers in the inner Galaxy (i.e., the distances to the GC less than ) have two possible kinematic distances corresponding to one , which is known as the kinematic distance ambiguity. The ambiguity of a HII region can be solved by the HI/H2CO emission/absorption observations (e.g., Watson et al. 2003; Sewilo et al. 2004; Anderson & Bania 2009) and by the HI self-absorption method (e.g., Tian & Leahy 2008; Anderson & Bania 2009). The latter was also applied to solve the distance ambiguity for GMCs (e.g., Roman-Duval et al. 2009) and 6.7 GHz methanol masers (e.g., Green & McClure-Griffiths 2011).
2.1 Tracer data
2.1.1 HII regions:
Based on the distribution of 100 complexes of H and/or H109 emission sources, i.e., bright HII regions, Georgelin & Georgelin (1976, hereafter GG76) first proposed a Galactic spiral pattern with four arm segments. Downes et al. (1980) and Caswell & Haynes (1987) discovered more HII regions in the first and fourth Galactic quadrants, which improved the model of GG76. Araya et al. (2002), Watson et al. (2003), and Sewilo et al. (2004) observed H110 and H2CO 4.8 GHz lines simultaneously toward many ultracompact HII (UCHII) regions, and resolved their kinematic distance ambiguity. The distribution of UCHII regions traces three arm segments in the first Galactic quadrant. Russeil (2003) compiled a large sample of 400 star forming complexes, and fitted the data with models of two-, three- and four-logarithmic spirals. She found that the four-arm model is more appropriate to represent the data distribution. Paladini et al. (2004) collected 180 HII regions with known distances and found that the distribution is consistent with the model of GG76.
In the past few years, there have been many HII region measurements. Notably, Green Bank Telescope HII Region Discovery Survey111httpwww.cv.nrao.edu/hrds/(Bania et al. 2010; Anderson et al. 2011) and its extension (Anderson et al. 2014) detected 603 discrete hydrogen radio recombination line components toward 448 targets. About 60 of them have negative velocities in the first Galactic quadrant or have positive velocities in the fourth Galactic quadrant, implying that they are located in the outer Milky Way or in the 3 kpc Arms (Dame & Thaddeus 2008). The kinematic distance ambiguity for the 149 newly discovered HII regions was solved by Anderson et al. (2012). The Arecibo HII Region Discovery Survey (Bania et al. 2012) has detected 37 new HII regions, kinematic distances were derived for 23 of them. Du et al. (2011) and Han et al. (2011) observed H110 and H2CO 4.8 GHz lines simultaneously toward more than 200 candidates of UCHII regions with the Urumqi 25 m telescope, and obtained kinematic distances for about 20 HII regions. Lépine et al. (2011) solved the kinematic distance ambiguity problem for more than 800 CS (21) emission sources (Bronfman et al. 1996), which are associated with the confident candidates of UCHII regions (Wood & Churchwell 1989). By analyzing the HI absorption data toward a sample of compact HII regions identified from the Red MSX Source Survey (Hoare et al. 2005), Urquhart et al. (2012) solved the kinematic distance ambiguity for about 105 HII regions. Similar work was conducted by Jones & Dickey (2012) for 75 HII regions. In addition, the relative accurate photometric or trigonometric distances have been measured or revised for some HII regions. Pinheiro et al. (2010) identified the ionizing stars in nine HII regions, and derived their photometric distances. Moisés et al. (2011) used the near-infrared color images to study the stellar content of 35 HII regions, and estimated their spectrophotometric distances. Russeil et al. (2012) analyzed the data of OB stars in two star forming complexes (see Russeil 2003), NGC 6334 and NGC 6357, and revised their photometric distances. Foster & Brunt (2014) obtained the spectrophotometric distances for 103 HII regions in the second and third Galactic quadrants. By measuring the trigonometric parallax of associated masers (e.g., Rygl et al. 2010; Oh et al. 2010; Sato et al. 2010a; Niinuma et al. 2011; Shiozaki et al. 2011; Sanna et al. 2012; Immer et al. 2013; Xu et al. 2013; Zhang et al. 2013; Wu et al. 2014), the distances of about 30 HII regions have been determined with high accuracy222The Bar and Spiral Structure Legacy (BeSSeL) Survey. httpbessel.vlbi-astrometry.org,333The Japanese VLBI Exploration of Radio Astrometry (VERA). httpveraserver.mtk.nao.ac.jp.
We collect the HII regions with line measurements from the references. The catalog contains about 4500 line measurements toward more than 2500 HII regions or confident candidates. More than 1800 of them have their distances determined. The photometric or trigonometric distance and the solutions of the kinematic distance ambiguity if available are collected from literature and listed in Table A.
2.1.2 GMCs
Giant molecular clouds have proven to be good tracers of the spiral structure (Cohen et al. 1986; Dame et al. 1986; Grabelsky et al. 1988). The famous Sagittarius-Carina Arm was clearly delineated by the distribution of GMCs (Grabelsky et al. 1988). Solomon et al. (1987) identified 268 GMCs in the first Galactic quadrant and outlined three arm segments. Efremov (1998) collected the known GMCs and fitted the data with a four-arm model. Roman-Duval et al. (2009) solved the kinematic distance ambiguity of 750 GMCs identified from the Galactic Ring Survey of 13CO (10) (Jackson et al. 2006; Rathborne et al. 2009), and showed three arm segments in the distribution of GMCs. Dame & Thaddeus (2011) identified ten 12CO (10) emission components having negative in the first Galactic quadrant, which are probably located in a spiral arm lying outside the Outer Arm. For the fourth Galactic quadrants, a preliminary identification of GMCs in the inner Galaxy was made by Bronfman et al. (1989). Recently, García et al. (2014) reanalyzed the Columbia U. de Chile Survey data of CO, and identified 92 GMCs. The kinematic distance ambiguity for 87 of them has been solved.
The GMC catalog in Hou et al. (2009) is now updated to include these new results. Molecular clouds with a mass greater than 104 are regarded to be massive enough and considered as GMCs in this work. We collect about 1300 GMCs as listed in Table A, and more than 1200 of them have distances determined.
2.1.3 6.7 GHz methanol Masers
The 6.7 GHz methanol masers (Menten 1991) have been widely detected from massive star forming regions in our Galaxy (e.g., Pestalozzi et al. 2005; Ellingsen 2006; Green et al. 2010, 2012). Early detections of 519 6.7 GHz methanol masers were summarized by Pestalozzi et al. (2005). Since then, Pandian et al. (2007) detected 86 masers in a 18.2 deg2 area with the Arecibo, and 48 of them are new detections. Ellingsen (2007) observed 200 Spitzer/GLIMPSE sources with Mt Pleasant 26 m and Ceduna 30 m radio telescopes, and they detected methanol masers in 38 sites, nine of which are new. Xu et al. (2008) searched for 6.7 GHz methanol masers toward a sample of 22 GHz water maser sources with the Effelsberg 100 m telescope, and got ten new detections. Cyganowski et al. (2009) measured 18 methanol masers toward a sample of young stellar objects with the VLA. The most important progress of the 6.7 GHz methanol maser discovery is the Methanol Multibeam (MMB) Survey of the entire Galactic plane (e.g., Green et al. 2009, 2010, 2012; Caswell et al. 2010, 2011). Fontani et al. (2010) searched for the 6.7 GHz methanol masers toward 296 massive star forming regions, and detected 55 masers, 12 of which are new. Olmi et al. (2014) performed a sensitive search of methanol masers toward 107 sources discovered in the Herschel Infrared Galactic Plane Survey (Molinari et al. 2010), and detected 32 masers, 22 of which are new. Sun et al. (2014) searched for 6.7 GHz methanol masers toward 318 dust clumps, and found 29 masers, 12 of which are new. In addition, the distances for many 6.7 GHz methanol masers have been determined. Pandian et al. (2009) solved the kinematic distance ambiguity for 86 masers with the HI self-absorption method. Green & McClure-Griffiths (2011) collected a large sample of 6.7 GHz methanol masers from references and new detections from the MMB survey. Their database covers the longitude ranges of 270 358∘, 5 67∘, and the latitude range of 1.5∘. The kinematic distance ambiguity for more than 400 methanol masers was solved by the HI self-absorption method.
We collect more than 900 methanol masers from the references above (see Table A), about 750 of which have distances determined, mostly kinematic, though some were measured by the trigonometric parallax or the photometric method. The observed spectra of 6.7 GHz methanol masers toward massive star forming regions always have multicomponents. The velocities of the maser spots toward a source are in a range of typically a few km s-1, sometimes more than 10 km s-1 (e.g., see Green et al. 2010). The median velocity instead of the peak velocity was suggested to be a better proxy of the systematic velocity of the source (Green & McClure-Griffiths 2011). Therefore, in our work, we use the median velocities to calculate the kinematic distances of masers. The systematic velocities and hence the distances determined from the observed maser spectra may be affected by noncircular motions and therefore have large uncertainties.
2.1.4 Longitude-velocity diagram of spiral tracers
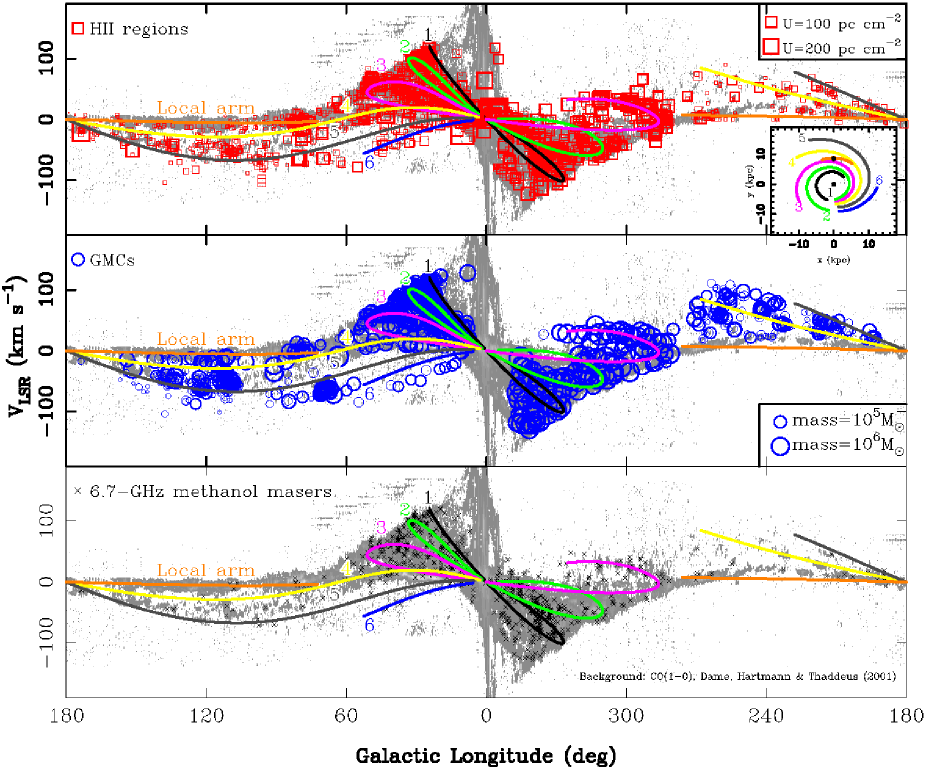
The gas component in the Milky Way has been systematically observed with the CO rotational transitions or the HI 21cm line. The longitude-velocity diagrams represent the kinematic and dynamic features of interstellar gas, which offer observational constraints on the spiral structure (e.g., Dame et al. 2001). The key step in mapping the gaseous spiral arms is to reconstruct the gas distribution from the observed longitude-velocity maps. In the inner Galaxy, the distances of gas components are difficult to determine. The spiral structure derived from diffuse HI and CO distributions is far from clear at present (e.g., see Nakanishi & Sofue 2003, 2006).
In contrast, HII regions, GMCs, and masers serve as excellent tracers of spiral arms. Their distances can be obtained by trigonometric, photometric, or kinematic method. As shown in Fig. 2, almost all features in the longitude-velocity map of 12CO (10) (Dame et al. 2001)444httpwww.cfa.harvard.edu/mmw/MilkyWayinMolClouds.html have counterparts in the distributions of collected HII regions and masers. With distances, one can reveal the unknown spiral arms.
2.2 Fundamental parameter , , and solar motions
For most of the spiral tracers without photometric or trigonometric distances, we have to obtain their kinematic distances, which depend on the adopted rotation curve and the fundamental parameters of the Galaxy, including the distance to the GC, , the circular orbital speed at the Sun, , and the solar motions with respect to the LSR.
According to the IAU standard, the distance to the GC is kpc, and the circular orbital speed at the Sun is km s-1. By measuring the S-star orbits in the GC regions, Ghez et al. (2008) obtained kpc, and Gillessen et al. (2009) estimated kpc. By measuring the trigonometric parallax toward Sgr B2, Reid et al. (2009c) obtained a value of kpc. Reid et al. (2009b) and Brunthaler et al. (2011) fitted the parallax measurements of massive star forming regions and derived the best fitted value of kpc and km s-1. A weighted average of kpc was derived from the above measurements by Brunthaler et al. (2011), and the fitted value of is in the range of 223280 km s-1 for different rotation curves. The ratio of has been well constrained to be km s-1 kpc-1. Brunthaler et al. (2011) suggested a value of km s-1. Schönrich (2012) obtained kpc and km s-1 by analyzing the stellar kinematics. Honma et al. (2012) found kpc and km s-1, using the VLBI astrometry data of 52 Galactic masers. Reid et al. (2014) estimated that kpc and km s-1 by analyzing the new parallax measurements toward massive star forming regions. Chatzopoulos et al. (2014) found kpc with a statistical study on star cluster dynamics and S-star orbits.


The IAU standards of solar motions with respect to the LSR are km s-1, km s-1, and km s-1 in J2000. The values of and do not change considerably in the recent research. But the solar motion in the direction of Galactic rotation, , is under debate. By analyzing the Hipparcos data, Dehnen & Binney (1998) obtained the solar motions km s-1, km s-1, and km s-1. According to these parameters, Reid et al. (2009b) analyzed the parallax measurements toward 18 massive star forming regions, and they found a velocity difference of 15 km s-1 in rotation, which may be induced by an erroneous value of . Higher values of km s-1 are also suggested by some recent studies (e.g., Francis & Anderson 2009; Schönrich et al. 2010; Coşkunoǧlu et al. 2011; Reid et al. 2014). Based on the solar motion parameters given by Schönrich et al. (2010), Brunthaler et al. (2011) reanalyzed the trigonometric parallax data of massive star forming regions, and found the peculiar rotation velocity of km s-1.
Throughout this work, we adopt two sets of , , and solar motions: one is the IAU standard kpc and km s-1, and solar motions of km s-1, km s-1, and km s-1; the other is kpc and km s-1 (Brunthaler et al. 2011; Reid et al. 2014), and solar motions of km s-1, km s-1 and km s-1 (Schönrich et al. 2010). A flat rotation curve (Reid et al. 2009b, 2014; Brunthaler et al. 2011) and the rotation curve of Brand & Blitz (1993, hereafter BB93) are adopted in calculating the kinematic distances.
2.3 Distances of the Galactic spiral tracers
If the photometric or trigonometric distance is available for a tracer, we adopt it directly. Otherwise, the kinematic distance is estimated using the observed and a rotation curve with the adopted , , and solar motions. For GMCs and 6.7 GHz methanol masers, their kinematic distances are calculated in the same way as that for HII regions.
Some HII regions have more than one measurement of from the same or different emission lines (Table A). Here, the mean velocity (=) is adopted. We revise the mean according to the adopted solar motions, then calculate the kinematic distance with a flat rotation curve (Reid et al. 2009b, 2014; Brunthaler et al. 2011) or the rotation curve of BB93. The FORTRAN package kindly provided by Reid et al. (2009b) was modified and used in our calculations. The sources in the range of Galactic longitudes of 15∘ to 15∘ should be carefully calculated for their kinematic distances (Tian & Leahy 2014) because of the Near and Far 3 kpc Arms (e.g., Dame & Thaddeus 2008; Green et al. 2011; Jones et al. 2013) and the Galactic bar(s) (Hammersley et al. 2000; Churchwell et al. 2009). We first inspect their possible associations with the Near and Far 3 kpc Arms according to the arm parameters given by Dame & Thaddeus (2008), and then calculate their distances.
Some HII regions, GMCs, and/or 6.7 GHz methanol masers are probably associated with each other. To remove the redundancy, the associations are identified following these criteria: (1) if an association was identified in literature, we adopted it directly; (2) if a HII region/maser is located within a GMC in projection considering its measured angular size, and their velocity difference is 10 km s-1 (Fich et al. 1990), we regard them as an association; (3) if the coordinates of a HII region and a maser are closer than 2′, and their velocity difference is 10 km s-1 (Green & McClure-Griffiths 2011), they are regarded as association. We checked the associations one by one, and adopted the distances of the HII regions or GMCs in the associations preferentially for the distributions because of the larger uncertainties of the systematic velocities derived from the 6.7 GHz methanol maser spectra. For the associations of HII regions and GMCs, we adopted the parameters of HII regions (coordinates and weights) for the distributions.
2.4 Weights for tracers of Galactic spiral structure

In order to use available tracers to outline the spiral structure, an appropriate weight factor should be used (Hou et al. 2009) to represent the relative importance of a tracer for the spiral structure. Reasonably, the brighter a HII region, or more massive a GMC, the more important a tracer for spiral structure, and therefore a larger weight is assigned.
For HII regions, we adopt the excitation parameter (Schraml & Mezger 1969) as the weight. The excitation parameter (in pc cm-2) is defined as:
| (1) |
here, is the electron temperature in K; is the radio flux density in Jy, collected from literature (e.g., Downes et al. 1980; Caswell & Haynes 1987; Griffith et al. 1995; Kuchar & Clark 1997) if available; is the observed frequency in GHz; is the distance to the tracer in kpc; and is a parameter close to 1 (Schraml & Mezger 1969), and for simplicity, we adopt . For a HII region, if is given in the literature, we adopt it directly. The mean value is used if there is more than one measurement, see Table A. Otherwise, we adopt the most probable value of 6500 K (see Fig. 3). The excitation parameter is calculated via Eq. 1, and the distribution of is shown in Fig. 4, which ranges from 1 pc cm-2 to 300 pc cm-2 with a peak near 50 pc cm-2. The ranges of size or luminosity of the Galactic HII regions are comparable to those in other spiral galaxies (e.g., M31, M51, Azimlu et al. 2011). In the catalog of Galactic HII regions in Table A, ultracompact HII regions are included, though they have much smaller sizes and radio flux density, but they are important to indicate spiral structure in some regions.
The weight of a HII region is defined as , here pc cm-2. Clearly, has a value in the range of 0.03.0. For those HII regions without measurements of , a weight factor is assigned to exploit the distribution of entire HII region dataset.
For GMCs, we use their masses as the weight factor (see Hou et al. 2009). The mass of each molecular cloud from literature was re-scaled with the adopted distances in Table A, and the distribution of in the ranges of 1 to 10 is shown in the lower panel of Fig. 4. The range of GMC mass in our Galaxy is comparable to nearby spiral galaxies, e.g., M31 (Kirk et al. 2013). Here, we adopt as the weight, and their values are in the ranges from 0.03.0. For the methanol masers, we simply assign the weight factor for each of them.
We also consider the weight due to the distance uncertainty of each tracer. A weight factor and is assigned to each tracer (Hou et al. 2009). If the uncertainty of the photometric or trigonometric distance is available in reference, we adopt it directly. If the kinematic distance is used, we assume a systematic velocity uncertainty of 7 km s-1, and then the distance uncertainty is calculated via the adopted rotation curve and the Galaxy fundamental parameters. Furthermore, if a tracer has a distance accuracy better than 0.5 kpc in or direction, the weight is assigned to be 1.0, i.e., = 1.0 if kpc; and/or = 1.0 if kpc.
3 The spiral structure of the Milky Way
3.1 Spiral structure revealed by different tracers
3.1.1 HII regions
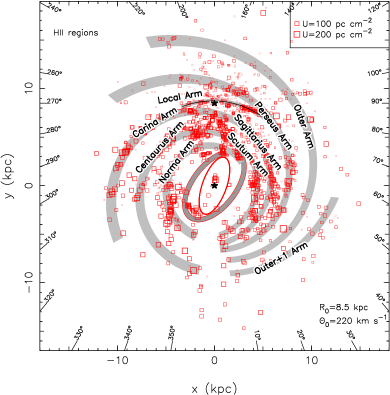
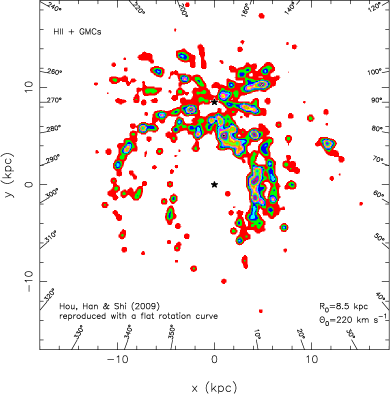
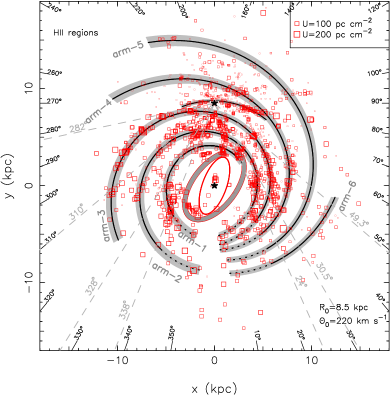
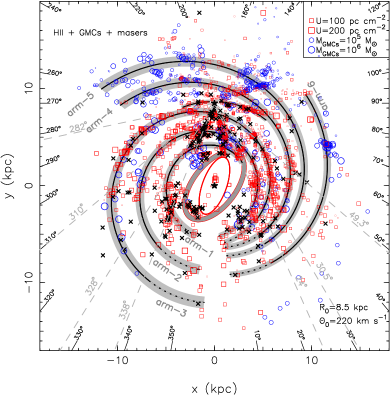
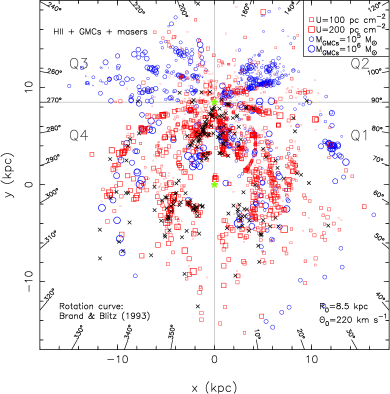
The large dataset of HII regions gives a clear presentation of the spiral pattern, see Fig. 5. Some remarkable features are discussed below.
The Local Arm, where the Sun is located, is a remarkable arm segment as indicated by a black-solid line in the lower-right panel of Fig. 5. It starts near the Perseus Arm (5 kpc, 7.5 kpc), and seems to have two branch-like structures near the Sun, one to 1 kpc and 9 kpc close to the Perseus Arm, above the fitted position of the Local Arm (see Fig. 5), the other to 1.5 kpc and 8.5 kpc close to the Carina Arm and overlapped with the fitted Local Arm. Xu et al. (2013) suggested that the Local Arm is closer to the Perseus Arm than to the Sagittarius Arm, and very likely is an arm branch from the Perseus Arm.
In the first Galactic quadrant (Q1), there are three obvious arm segments. From the inside out, they are the Scutum Arm, the Sagittarius Arm and the Perseus Arm. In the outer Galaxy regions ( from 7 kpc to kpc, from 10 kpc to 1 kpc), there are indications for the Outer Arm and even the Outer+1 Arm. In the inner Galaxy (2 kpc, 3 kpc), the assemblies of HII regions may be related with the near ends of the Galactic bar and/or the 3 kpc Arms.
In the second (Q2) and third (Q3) Galactic quadrants, i.e., the anticentral regions, a remarkable arm segment ( from 4 kpc to 4 kpc, 10 kpc) is the Perseus Arm. Outside the Perseus Arm, there are the extension of the Outer Arm or even that of the Outer+1 Arm. The kinematic distance anomalies (Roberts 1972) in the second and third Galactic quadrants do not significantly influence the structure features shown in Fig. 5 because most of the bright HII regions have photometric or trigonometric distances (cf. Fig. 1).
In the fourth Galactic quadrant (Q4), three arm segments are obvious. From the outside in, they are the Carina Arm, the Centaurus Arm and the Norma Arm. The assemblies of HII regions in the inner Galaxy ( 2 kpc, 3 kpc) maybe related to the far ends of the Galactic bar and/or the 3 kpc Arms.
The large uncertainties of kinematic distances of HII regions may result in some fuzzy structure features. In the lower left panel of Fig. 5, only the HII regions with position uncertainties better than 1 kpc are plotted. The separation between the adjacent arm segments is clearer, typically larger than the position uncertainties of spiral tracers, which confirms the existence of the arm segments discussed above.
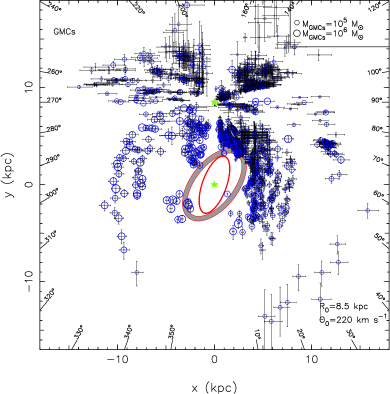
3.1.2 GMCs
Arm features traced by GMCs are shown in Fig. 6. Most of the arm features recognized in the distribution of HII regions have their counterparts in the distribution of GMCs.
In the first Galactic quadrant, we find three arm segments, which are the Scutum Arm, the Sagittarius Arm and the Perseus Arm from the inside out. In the distant regions of the first quadrant ( 20 kpc, ), several CO emission features were revealed by Dame & Thaddeus (2011). One fully mapped CO emission source has a mass of 5 104 . Other CO emission features are not yet fully mapped, but are also probably from GMCs. These GMCs may indicate the arm segment(s) beyond the Outer Arm. Some GMCs (12 kpc, 4 kpc) identified by Digel et al. (1990) may trace the Outer Arm or the Outer+1 Arm.
In the second and third Galactic quadrants many GMCs exist that were identified by May et al. (1997), Heyer et al. (2001), and Nakagawa et al. (2005). But arm-like features are not obvious probably due to the anomalies of kinematic distances (Roberts 1972), as most of their distances are kinematic.
In the fourth quadrant, there are two obvious arm segments. From the outside in, they are the Carina Arm and the Centaurus Arm. The assemblies of GMCs near 2 kpc and 3 kpc may trace part of the Norma Arm. The GMCs near 3 kpc and 2 kpc may be related to the extension of the Norma Arm and/or with the Near 3 kpc Arm.
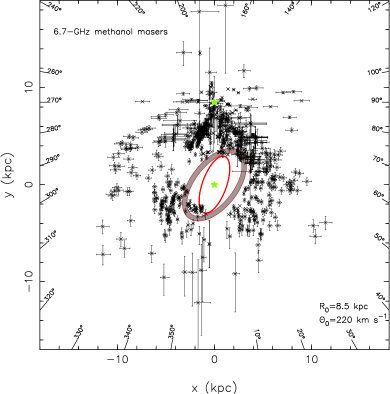
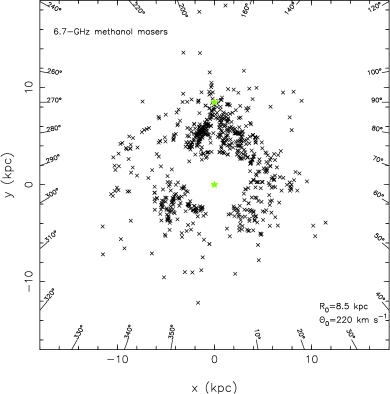
3.1.3 6.7 GHz methanol masers
The distribution of 6.7 GHz methanol masers (Fig. 6) resembles that of HII regions or GMCs but with a much larger data scatter. Most of their distances are kinematic, which depends on the measured . As discussed in Sect. 2.1.3, the systematic velocity derived from the observed maser lines may be significantly affected by noncircular motions of the maser spots, and hence has larger uncertainties of derived distances than those for HII regions and GMCs.
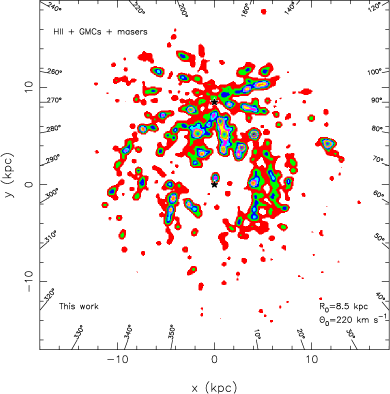
3.1.4 Spiral structure seen from tracers
The distribution of three kinds of spiral tracers is shown in Fig. 7, after removing the redundancy, as described in Sect. 2.3. To better indicate spiral arms, following Hou et al. (2009), we use a Gaussian function to brighten each tracer:
| (2) |
Here, or or is the weight factor discussed in Sect. 2.4; and are the coordinates of the th spiral tracer. A color intensity map is shown in the lower left panel of Fig. 7, in which = 0.2 is adopted as the Gaussian width. Different values of in a suitable range (e.g., 0.050.4) yield a similar result. Several distinct arm segments are clearly shown. Comparing to the previous arm structure in Hou et al. (2009, see the lower right panel of Fig. 7), we found that the Outer Arm, part of the Outer+1 Arm, the Local Arm, the Centaurus Arm and the Norma Arm are significantly better outlined by more tracers.
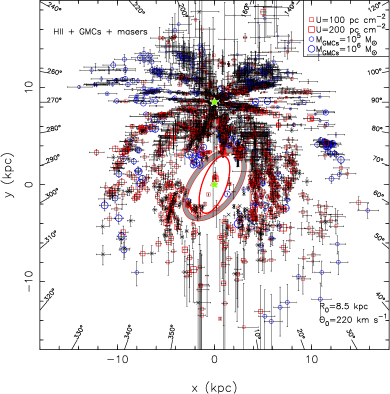
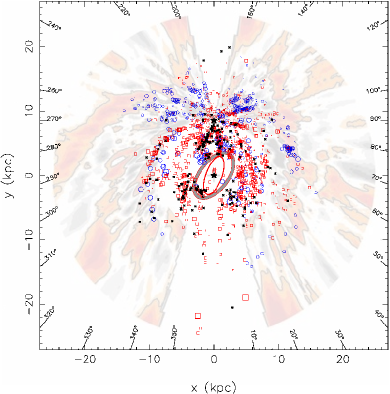
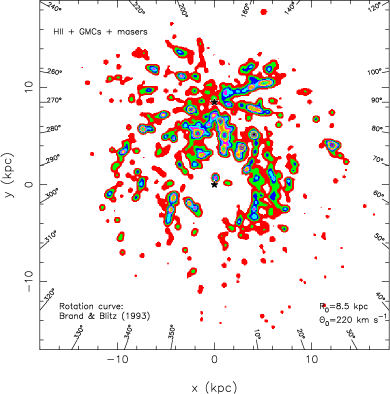
Comparison of the tracer distribution with the distribution of HI gas is shown in Fig. 8, which gives us an intuitive feeling about the extension of the identified arm segments. In the outer regions of the first quadrant (12 kpc, 8 kpc), tens of newly discovered HII regions (Anderson et al. 2011) and GMCs (Dame & Thaddeus 2011) are consistent with an HI arm-like feature, and then connected to a cluster of GMCs (12 kpc, 4 kpc). In the third and fourth Galactic quadrants, from the outside in, the three remarkable HI arms correspond to the extensions of the Outer Arm ( from 13 kpc to 7 kpc, 12 kpc, ), the Perseus Arm ( 7 kpc, 9 kpc, ), and the Carina Arm ( 10 kpc). In particular, the Carina Arm traced by HII regions and GMCs is well matched with distribution of HI gas.
In summary, the distribution of HII regions and GMCs do show some obvious arm segments. Particularly, these arm segments are able to match the HI arms in the outer Galaxy. However, the connections of arm segments in different Galactic quadrants are still not intuitive.
3.2 Fitting models to tracer distributions
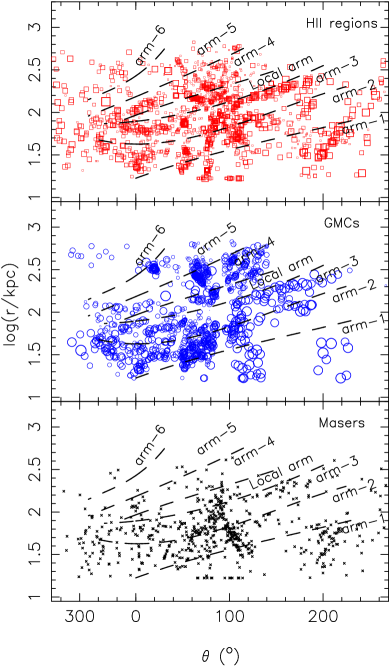
We can roughly identify the arm segments in the log() diagrams as separated by the dashed lines in Fig. 9. From the bottom up, they are the Norma Arm (arm-1), the Scutum-Centaurus Arm (arm-2), the Sagittarius-Carina Arm (arm-3), the Local Arm, the Perseus Arm (arm-4), the Outer Arm (arm-5) and the Outer+1 Arm (arm-6). Near the direction of 90∘, the spiral tracers are mixed, the Scutum-Centaurus Arm and the Sagittarius-Carina Arm can barely be distinguished. Near the direction of 320∘, where the data points are also mixed, the different arm segments cannot be separated with high confidence. In addition, there is a lack of tracers at large , the Outer Arm and the Outer+1 Arm can only be identified marginally. The Local Arm (, log() 2.1) is obviously short and has a distinctive pitch angle as recognized in the distribution of HII regions. To explore the number and position of spiral arms in our Galaxy, fitting the tracer data with models is desired.
Many models of spiral structure have been proposed (e.g., Vallée 2008, 2013). The paradigmatic model is the four arm segments first recommended by GG76, which is supported by observations later (e.g., Downes et al. 1980; Caswell & Haynes 1987; Englmaier & Gerhard 1999; Drimmel & Spergel 2001; Russeil 2003; Levine et al. 2006; Bobylev & Bajkova 2014), though other spiral patterns have been proposed to describe the structure of the Galaxy (see, e.g., Amaral & Lepine 1997; Lépine et al. 2001, 2011; Pohl et al. 2008; Hou et al. 2009). Here, we first fit the tracer data with the conventional logarithmic spirals, and then present a model with polynomial-logarithmic spiral arms to connect the tracers.
| ModelsArm parameters | ||||||||||||||||
|---|---|---|---|---|---|---|---|---|---|---|---|---|---|---|---|---|
| (kpc) | (kpc) | (kpc) | (kpc) | (kpc) | ||||||||||||
| Fitting of models to HII regions, kpc, km s-1. | ||||||||||||||||
| 3-arm model | 3.42 | 44.4 | 8.85 | 3.72 | 192.3 | 9.29 | 3.01 | 219.4 | 8.62 | 8.61 | 51.3 | 0.50 | 0.17 | |||
| 4-arm model | 3.40 | 44.9 | 11.70 | 4.41 | 190.1 | 10.82 | 3.58 | 217.6 | 10.68 | 3.60 | 320.9 | 11.06 | 8.64 | 50.4 | 0.99 | 0.16 |
| Fitting of models to all three kinds of spiral tracers (HII regions, GMCs, and 6.7 GHz methanol masers). | ||||||||||||||||
| 3-arm model | 3.40 | 45.8 | 9.12 | 3.78 | 194.7 | 9.29 | 3.47 | 230.4 | 7.61 | 8.59 | 54.7 | 0.62 | 0.20 | |||
| 4-arm model | 3.23 | 41.2 | 10.64 | 4.27 | 189.0 | 11.15 | 3.56 | 217.9 | 10.63 | 3.81 | 309.8 | 8.85 | 8.64 | 53.8 | 0.59 | 0.17 |
| Fitting of models to HII regions, kpc, km s-1. | ||||||||||||||||
| 3-arm model | 3.19 | 36.8 | 9.00 | 3.27 | 191.9 | 10.36 | 3.13 | 230.7 | 8.16 | 8.20 | 51.1 | 2.63 | 0.16 | |||
| 4-arm model | 3.35 | 44.4 | 11.43 | 4.61 | 192.4 | 9.84 | 3.56 | 218.6 | 10.38 | 3.67 | 330.3 | 10.54 | 8.21 | 55.1 | 2.77 | 0.16 |
| Fitting of models to all three kinds of spiral tracers. | ||||||||||||||||
| 3-arm model | 3.22 | 44.1 | 9.25 | 3.43 | 184.5 | 9.50 | 3.10 | 210.3 | 7.80 | 8.17 | 47.8 | 2.68 | 0.18 | |||
| 4-arm model | 3.27 | 38.5 | 9.87 | 4.29 | 189.0 | 10.51 | 3.58 | 215.2 | 10.01 | 3.98 | 320.1 | 8.14 | 8.16 | 50.6 | 2.71 | 0.16 |
| Tracers and References | Near 3 kpc | Scutum | Sagittarius | Carina | Centaurus | Norma | Far 3 kpc |
|---|---|---|---|---|---|---|---|
| HI: wea70, bs70, hen77 | 50 | 310 | 328 | ||||
| integrated 12CO: ccdt80, gcb+87 | 24 | 30.5 | 49.5 | 310 | 330 | ||
| 12CO clouds: dect86 | 25 | 32 | 51 | ||||
| warm CO clouds: ssr85 | 25 | 30 | 49 | ||||
| HII regions: loc89, dwbw80 | 24 | 30 | 47 | 305 | 332 | ||
| 26Al: cgdh96 | 46 | 310 | 325 | ||||
| Radio 408 MHz: bkb85 | 48 | 310,302 | 328 | 339 | |||
| 2.4m: hmm+81 | 332 | 339 | |||||
| 60m: bdt90 | 313 | 329 | 340 | ||||
| 12CO: bro92 | 25 | 33 | 55 | 282 | 309 | 328 | 337 |
| 12CO: bro08 | 308 | 328 | 336 | ||||
| 12CO: ban80, cd76 | 23.5 | ||||||
| 12CO: dt08 | 23 | 337 | |||||
| Median | 24 | 30.5 | 49.3 | 282 | 310 | 328 | 338 |
3.2.1 The logarithmic spiral arm models
Spiral arms of galaxies have been conventionally approximated by logarithmic spirals (e.g., Russeil 2003, and references therein). For the Milky Way, the two-arm logarithmic spirals can neither fit the distribution of massive star forming regions/GMCs nor match the observed tangential directions of spiral arms (Russeil 2003; Hou et al. 2009). The models of three- and four-arm spirals can fit data equally well (Russeil 2003; Hou et al. 2009). In this work, we focus on the spiral structure traced by massive star forming regions and GMCs. As shown in some galaxies, the spiral structure traced by the stellar component may be different from that traced by massive star forming regions or gas (e.g., Grosbol & Patsis 1998). For the Milky Way, the stellar component is commonly accepted to be dominated by a two-arm spiral pattern (Drimmel & Spergel 2001; Benjamin et al. 2005; Churchwell et al. 2009; Francis & Anderson 2012).
In polar coordinates (), the th arm can be given as logarithmic form:
| (3) |
where , are the polar coordinates centered at the GC, starts at the positive -axis and increases counterclockwise; , , and are the start azimuth angle, the initial radius, and the pitch angle for the th spiral arm, respectively. To search for the optimized values of each parameter, we minimize the factor (see Russeil 2003; Hou et al. 2009):
| (4) |
here, is the weight discussed in Sect. 2.4; and are the Cartesian coordinates of a spiral tracer, their uncertainties are represented by and , respectively; and are the coordinates of the nearest point from the fitted spiral arms to the tracer. The Minuit package, with the and search routines (Nelder & Mead 1965), is adopted to minimize the factor .
The model is first fitted to only the HII regions, and then to the all three kinds of spiral tracers (i.e., HII regions, GMCs, and 6.7 GHz methanol masers). We realized that the distances of many HII regions have been determined more credibly by photometric or trigonometric method, especially for those in the second and third Galactic quadrants where the kinematic anomalies dominate. The known HII regions are widely distributed in a large region of the disk (see Fig. 5 and 6).
| ModelsSpiral arms | Near 3 kpc | Scutum | Sagittarius | Carina | Centaurus | Norma | Far 3 kpc | /N |
|---|---|---|---|---|---|---|---|---|
| 24∘ | 30.5∘ | 49.3∘ | 282∘ | 310∘ | 328∘ | 338∘ | ||
| Best-fitted models to HII regions, kpc, km s-1. | ||||||||
| 3-arm model | 22.6 [1.4] | 34.7 [4.2] | 57.5 [8.2] | 285.0 [3.0] | 312.5 [2.5] | 327.4 [0.6] | 1.7 | |
| 4-arm model | 22.1 [1.9] | 33.6 [3.1] | 55.3 [6.0] | 284.7 [2.7] | 309.8 [0.2] | 324.2 [3.8] | 1.4 | |
| PL model | 24.3 [0.3] | 33.3 [2.8] | 51.1 [1.8] | 286.1 [4.1] | 310.2 [0.2] | 326.8 [1.2] | 0.9 | |
| Best-fitted models to all three kinds of spiral tracers. | ||||||||
| 3-arm model | 22.3 [1.7] | 37.5 [7.0] | 58.7 [9.4] | 283.7 [1.7] | 310.9 [0.9] | 327.4 [0.6] | 2.0 | |
| 4-arm model | 21.2 [2.8] | 34.9 [4.4] | 54.1 [4.8] | 286.1 [4.1] | 311.9 [1.9] | 326.8 [1.2] | 1.4 | |
| PL model | 24.9 [0.9] | 33.6 [3.1] | 50.8 [1.5] | 286.5 [4.5] | 310.1 [0.1] | 326.6 [1.4] | 1.0 | |
| Best-fitted models to HII regions, kpc, km s-1. | ||||||||
| 3-arm model | 21.9 [2.1] | 35.1 [4.6] | 54.6 [5.3] | 286.1 [4.1] | 312.8 [2.8] | 328.0 [0.0] | 1.5 | |
| 4-arm model | 22.4 [1.6] | 33.5 [3.0] | 54.7 [5.4] | 285.9 [3.9] | 310.8 [0.8] | 324.1 [3.9] | 1.4 | |
| PL model | 23.8 [0.2] | 32.5 [2.0] | 49.7 [0.4] | 288.9 [6.9] | 310.2 [0.2] | 327.3 [0.7] | 1.2 | |
| Best-fitted models to all three kinds of spiral tracers. | ||||||||
| 3-arm model | 21.6 [2.4] | 36.0 [5.5] | 55.3 [6.0] | 287.0 [5.0] | 312.3 [2.3] | 328.1 [0.1] | 1.7 | |
| 4-arm model | 22.4 [1.6] | 35.8 [5.3] | 53.9 [4.6] | 287.6 [5.6] | 311.9 [1.9] | 326.3 [1.7] | 1.6 | |
| PL model | 22.9 [1.1] | 32.7 [2.2] | 51.7 [2.4] | 288.7 [6.7] | 310.6 [0.6] | 327.9 [0.1] | 1.3 | |
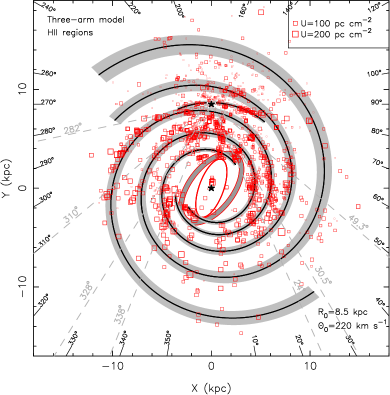
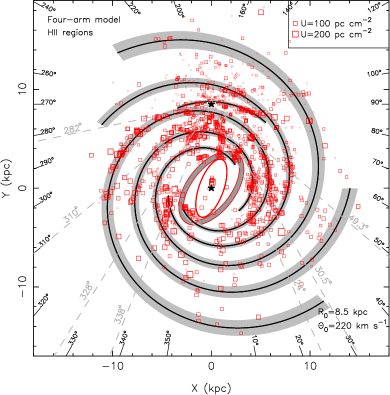
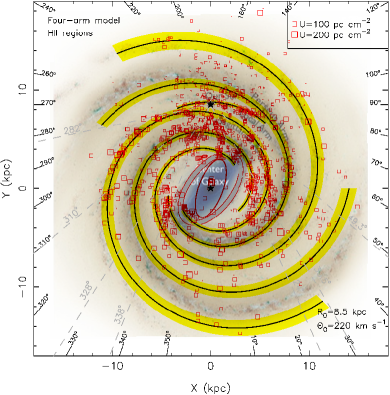
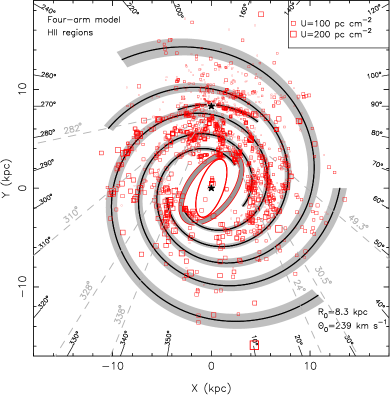
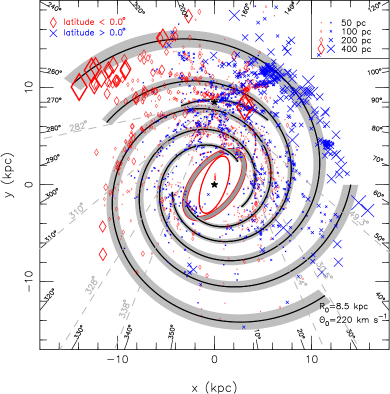
The best-fitted models to HII regions are displayed in the upper panels of Fig. 10, and the corresponding parameters of spiral arms are listed in Table 1. Both the three-arm model and the four-arm model can connect most spiral tracers. The fitting factor = 0.17 for the best-fitted three-arm model is slightly larger than that for the four-arm model ( = 0.16). However, the connections of the known arm segments differ in the two models. In the four-arm model, the Norma Arm starts from the near end of the Galactic bar, then extends to the Outer Arm. While in the three-arm model, the Norma Arm is connected to the Perseus Arm, which is fitted as an individual spiral arm in the four-arm model. The Scutum Arm in the four-arm model starts from a cluster of HII regions (4 kpc, 0 kpc) connected to the Centaurus Arm, then extends to be the Outer+1 Arm. In the three-arm model, however, the Scutum Arm starts from the far end of the Galactic bar, then connects to the Centaurus Arm, and extends to the Outer Arm. The Sagittarius-Carina Arm is well fitted in both of the two models, but their extensions are different. The Local Arm is fitted additionally in both of the two models as a short arm segment, which starts near the Perseus Arm, and then extends to the fourth quadrant until it approaches the Carina Arm.
The tangential directions of spiral arms obtained by the best-fitted four-arm model are slightly more consistent with observations than those from the three-arm model, as indicated by /N in Table 3, though the deviations can be as large as 4∘6∘ for the Norma Arm and the Sagittarius Arm. Most grand-design spiral galaxies approximate two-fold rotational symmetry (e.g, Knapen et al. 1992; Rozas et al. 1998; Binney & Tremaine 2008). For our Galaxy, a two-fold symmetry of the spiral structure has been proposed (Dame 2013), which is based on analyzing the observational data of stellar component (e.g., Benjamin et al. 2005) and the discovery of the Far 3 kpc Arm (Dame & Thaddeus 2008) and distant GMCs and HII regions (Dame & Thaddeus 2011; Anderson et al. 2011). The two-fold symmetry is more satisfied by the best-fitted four-arm model than the three-arm model.
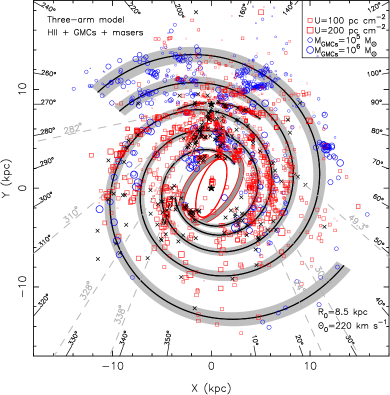
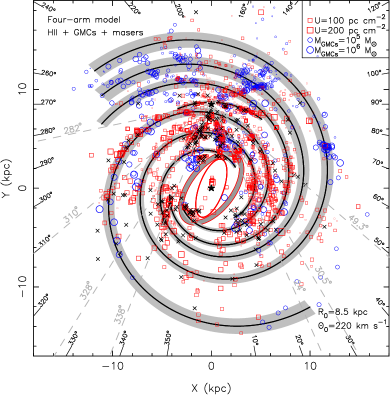
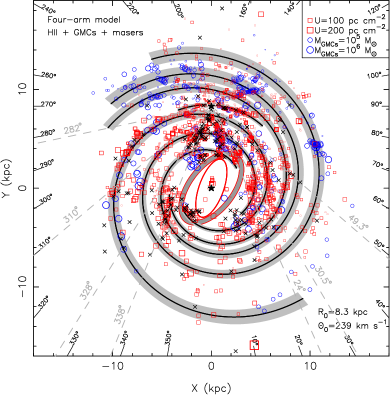
The best-fitted models to all three kinds of tracers are displayed in the lower two panels of Fig. 10. The modeled Norma Arm, Scutum-Centaurus Arm, Sagittarius-Carina Arm, and Perseus Arm are consistent with the models from the fitting to HII regions. The disagreements are found for the outer Galaxy regions, in particular in the second and third quadrants, where many GMCs exist. Their distributions are somewhat messy, because of large uncertainties in the kinematic distances. Exact distances should be measured (e.g., W3OH in the Perseus Arm, Xu et al. 2006), otherwise the structure features traced by many GMCs in the second and third quadrants are questionable. In contrast, most of the bright HII regions in the second and third quadrants have photometric or trigonometric distances (see Fig. 1). The arm features traced by HII regions are reliable, which motivates us to recommend the best-fitted four-arm model shown in the upper right panel of Fig. 10.
| th arm | ||||||
| (∘) | (∘) | |||||
| HII regions, kpc, km s-1, = 0.16. | ||||||
| arm-1 | 1.1923 | 0.1499 | -0.007056 | 0.0 | 40 | 250 |
| arm-2 | 7.4144 | -2.4119 | 0.3105 | -0.01223 | 275 | 620 |
| arm-3 | 6.8191 | -2.1630 | 0.2888 | -0.01163 | 275 | 570 |
| arm-4 | 2.6019 | -0.3315 | 0.03829 | 0.0 | 275 | 500 |
| arm-5 | 1.7840 | -0.04095 | 0.01956 | 0.0 | 280 | 475 |
| arm-6 | 3.1816 | -0.5408 | 0.07024 | 0.0 | 280 | 355 |
| (kpc) | (∘) | (∘) | ||||
| Local Arm | 8.64 | 52.0 | 1.00 | |||
| All three kinds of spiral tracers, = 0.18. | ||||||
| arm-1 | 1.2170 | 0.1442 | -0.007552 | 0.0 | 40 | 250 |
| arm-2 | 7.4413 | -2.4138 | 0.3103 | -0.01222 | 275 | 620 |
| arm-3 | 6.8185 | -2.1632 | 0.2887 | -0.01162 | 280 | 625 |
| arm-4 | 1.8419 | -0.09367 | 0.02001 | 0.0 | 280 | 500 |
| arm-5 | 1.7020 | -0.01485 | 0.01522 | 0.0 | 280 | 500 |
| arm-6 | 2.0497 | -0.05168 | 0.01807 | 0.0 | 280 | 405 |
| (kpc) | (∘) | (∘) | ||||
| Local Arm | 8.60 | 51.9 | 0.76 | |||
| HII regions, kpc, km s-1, = 0.16. | ||||||
| arm-1 | 1.1668 | 0.1198 | 0.002557 | 0.0 | 40 | 250 |
| arm-2 | 5.8002 | -1.8188 | 0.2352 | -0.008999 | 275 | 620 |
| arm-3 | 4.2300 | -1.1505 | 0.1561 | -0.005898 | 275 | 570 |
| arm-4 | 0.9744 | 0.1405 | 0.003995 | 0.0 | 280 | 500 |
| arm-5 | 0.9887 | 0.1714 | 0.004358 | 0.0 | 280 | 475 |
| arm-6 | 3.3846 | -0.6554 | 0.08170 | 0.0 | 280 | 355 |
| (kpc) | (∘) | (∘) | ||||
| Local Arm | 8.10 | 52.2 | 2.36 | |||
| All three kinds of spiral tracers, = 0.17. | ||||||
| arm-1 | 1.1320 | 0.1233 | 0.003488 | 0.0 | 40 | 250 |
| arm-2 | 5.8243 | -1.8196 | 0.2350 | -0.009011 | 275 | 620 |
| arm-3 | 4.2767 | -1.1507 | 0.1570 | -0.006078 | 275 | 575 |
| arm-4 | 1.1280 | 0.1282 | 0.002617 | 0.0 | 280 | 500 |
| arm-5 | 1.7978 | -0.04738 | 0.01684 | 0.0 | 280 | 500 |
| arm-6 | 2.4225 | -0.1636 | 0.02494 | 0.0 | 280 | 405 |
| (kpc) | (∘) | (∘) | ||||
| Local Arm | 8.17 | 57.8 | 2.84 | |||
3.2.2 The polynomial-logarithmic spiral arm model
A single value of the pitch angle cannot well describe the spiral arms for many galaxies (e.g., Seigar & James 1998; Savchenko & Reshetnikov 2013), and the variation of pitch angle can sometimes exceed 20 percent (Savchenko & Reshetnikov 2013). To fit both the data distribution and also the observed tangential directions, we proposed a polynomial-logarithmic (PL) spiral arm model (Hou et al. 2009) to connect the identified arm segments.
In polar coordinates (, ), a PL spiral arm is expressed as:
| (5) |
To search the best-fitted models, the Minuit package is adopted to minimize the fitting factor (see Eq 4). We first fit the six identified arm segments (see the log() diagrams in Fig. 9) individually by a PL spiral to obtain the initial values of arm parameters. Then, the six arm segments and the Local Arm are fitted together to derive the best model. As a purely logarithmic spiral has shown to be good enough to fit the Local Arm (Fig. 10), we adopt it here as well. The model is also fitted to the HII regions and to all three kinds of spiral tracers.
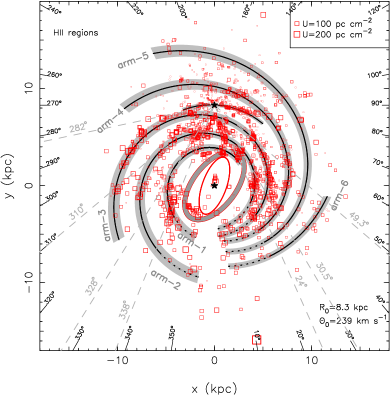
The best-fitted model to HII regions is shown in the left panel of Fig. 11, the corresponding arm parameters are listed in Table 4. This model has advantages in connecting most known spiral tracers. From the inside out, the Norma Arm (arm-1), the Scutum-Centaurus Arm (arm-2), the Sagittarius-Carina Arm (arm-3), the Perseus Arm (arm-4), and the Local Arm both are well fitted. The Outer Arm (arm-5) and the Outer+1 Arm (arm-6) are also delineated, although less spiral tracers are found for the outer Galaxy. The modeled tangential directions for the PL arm models are in better agreement with observations than those of the best-fitted four-arm model, 0.9 cf. 1.4, see Table 3.
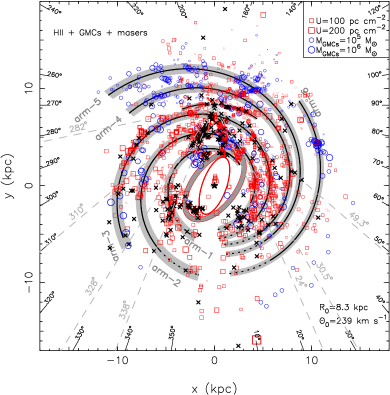
The best-fitted model to all three kinds of tracers is shown in the right panel of Fig. 11. The best-fitted arm-1 to arm-4, and also the Local Arm are consistent in the models. Large discrepancies in positions are found for the best-fitted Outer Arm and the Outer+1 Arm in this model compared with the model of HII regions partially because of the lack of HII regions in the outer Galaxy and the unreliability of the kinematic distances for many GMCs in the second and third quadrants (Sect. 3.2.1). In the distant regions of the first quadrant, the CO emission features revealed by Dame & Thaddeus (2011) may trace a more distant arm segment even beyond the Outer+1 Arm (also see Fig. 10). These CO emission features may be related with the extension of the Sagittarius-Carina Arm (arm-3), but cannot be reasonably fitted by a single spiral arm. More measurements of distant spiral tracers are necessary.
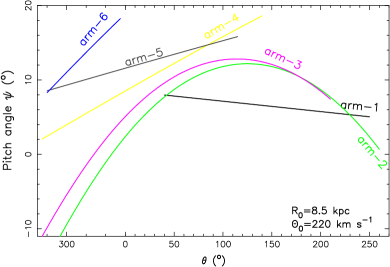
The pitch angle for a PL arm segment is expressed in the form of , which varies significantly with the azimuthal angle as shown in Fig. 12. In some galaxies, e.g., NGC 628 and NGC 6946, the variations of pitch angles are also obvious (Cedrés et al. 2012; Savchenko & Reshetnikov 2013). The relative positions of spiral tracers in our Galaxy have larger uncertainties than those in face-on galaxies. Therefore, high quality data (e.g., the trigonometric parallax) is necessary to uncover the properties of spiral arms in our Galaxy.
3.3 Comparison with the widely used image of the Galaxy spiral structure
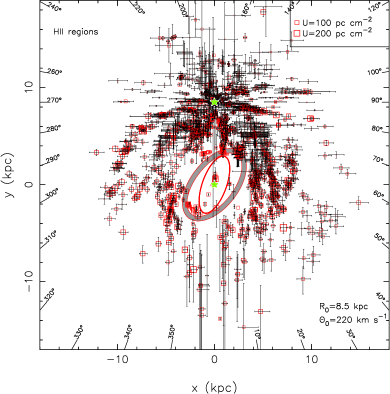
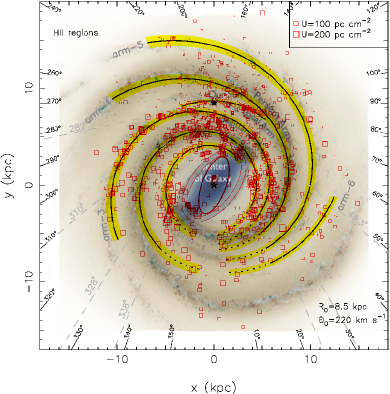
With the updated catalogs of Galactic HII regions, GMCs, and 6.7 GHz methanol masers, we explore the spiral pattern of the Galaxy. Some revealed arm features are not consistent with the well-known picture of the Galaxy spiral structure (Fig. 13):
(1) The extension of the Local Arm. In the concept map of the Galaxy structure (the background of Fig. 13), the Local Arm starts near the Perseus Arm, then extends as an independent arm segment between the Perseus Arm and the Sagittarius-Carina Arm ( 3 kpc, 9 kpc). This feature is not confirmed by the distribution of HII regions. As shown in Fig. 13, the Local Arm does not extend far from the Sun. It starts near the Perseus Arm, then extends to the fourth quadrant, and closely approaches to the Carina Arm at 1.5 kpc, 8.3 kpc, also see Fig. 14.
(2) The start point of the Scutum Arm. The Scutum Arm is commonly believed to originate from the near end of the Galactic bar. This contradicts the distribution of the cataloged spiral tracers. In the best-fitted models, the Scutum Arm is related to many bright HII regions in the distant parts of the first Galaxy quadrant around 4 kpc, 0 kpc, which is consistent with the spiral arm models of GG76 and Cordes & Lazio (2002).
(3) The demarcation of the Sagittarius-Carina Arm and the Scutum-Centaurus Arm. Around the direction of the GC ( 2 kpc, 4 kpc 7 kpc), no clear demarcation is found in the data distribution between the best-fitted Sagittarius-Carina Arm and the Scutum-Centaurus Arm, which is also shown in the distribution of HII regions with photometric or trigonometric distances (Fig. 1).
(4) The extensions of the Sagittarius-Carina Arm and the Scutum-Centaurus Arm. As seen in Fig. 13, large discrepancies are found for the extension of the Sagittarius-Carina Arm or the Scutum-Centaurus Arm (in the regions with 6 kpc) between our best-fitted models and that of the concept map.
3.4 Influence of the fundamental parameters to the derived spiral structure
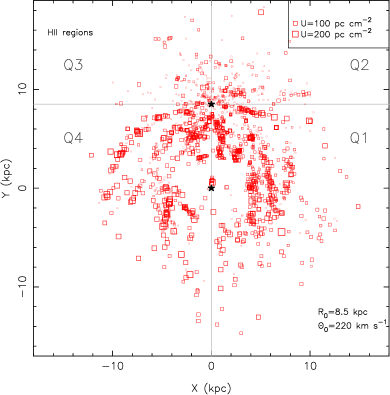
As discussed in Sect. 2.2, recent observations suggest that , , and solar motions are different from the IAU standards, which should influence the derived spiral pattern of our Galaxy from the cataloged tracers. To show the possible influence, we re-calculated the distances of spiral tracers with a flat rotation curve for = 8.3 kpc and = 239 km s-1 (Brunthaler et al. 2011) together with the new solar motions of Schönrich et al. (2010).
The results are given in Fig. 14. The arm-like features are very similar to that with the IAU standard, but slightly shrinked, especially for the outer Galaxy regions. We also fit the data distribution with the four-arm logarithmic spiral arm models and the PL arm models. The best fits are shown in Fig. 14, the corresponding arm parameters are listed in Table 1 and Table 4. The modeled tangential directions are compared with observations in Table 3.
3.5 Influence of the rotation curve on the derived spiral structure
Besides the flat rotation curve, the rotation curve of BB93 has also been widely used in previous studies. As shown by Hou et al. (2009), the BB93 rotation curve is reasonable for the whole Galaxy in comparison with that of Clemens (1985) and Fich et al. (1989). We re-calculated the kinematic distances of the collected spiral tracers with the BB93 rotation curve and the results are shown in Fig. 15. The arm-locations are very similar to those calculated with the flat rotation curve. This is reasonable because the BB93 rotation curve is almost flat in the galactocentric radii between 5 kpc and about 15 kpc.
3.6 The Galactic warp
The Galactic warp was first discovered in early surveys of HI gas (Kerr 1957; Burton 1988), which is vertically distorted even to distances larger than 3 kpc from the Galactic plane (Diplas & Savage 1991). Evidence for Galactic warp has recently been observed again from HI absorption (Dickey et al. 2009), red clump giants (López-Corredoira et al. 2010; Bobylev 2010), extended low density warm ionized medium (Cersosimo et al. 2009), 2MASS infrared stars (Reylé et al. 2009), young open clusters (Vázquez et al. 2008), molecular gas (Nakagawa et al. 2005), Galactic HII regions (Paladini et al. 2004), and also star forming complexes (Russeil 2003).
With the catalogs of Galactic HII regions, GMCs, and 6.7 GHz methanol masers, we get significant evidence of warp in the outer Galaxy as shown in Fig. 16, where the best-fitted four-arm model is overlaid. In the first and second quadrants, the Outer Arm and the Outer+1 Arm are above the Galactic plane (positive). In the third and fourth quadrants, the Outer Arm, the Perseus Arm, and the Carina Arm are below the Galactic plane (negative).
4 Discussions and conclusions
We update the catalogs of Galactic HII regions, GMCs, and 6.7 GHz methanol masers to study the large-scale spiral arm structure. Compared with our previous results in Hou et al. (2009), the samples of HII regions and GMCs are much enlarged. We include the maser data though they are marginally helpful. If the photometric or trigonometric distances of these tracers are not available in the literature, kinematic distances are estimated using a Galaxy rotation curve with two sets of , , and solar motions, where one set is the IAU standard and the other is from the new observational results. We calculate the excitation parameters of HII regions and the masses of GMCs and scale them as the weight factors, then obtain the weighted distribution of these spiral tracers and also their combinations.
We have shown that the distribution of HII regions delineates a clear spiral structure. Obvious arm segments can be identified. From the inside out, they are the Norma Arm, the Scutum-Centaurus Arm, the Sagittarius-Carina Arm, the Perseus Arm, the Outer Arm, and probably the Outer+1 Arm. The Local Arm is identified as a short arm segment. The identified arm segments traced by massive star forming regions and GMCs can match the HI arms in the outer Galaxy, suggesting that the Milky Way is a grand-design spiral galaxy.
We fit the models of three-arm and four-arm logarithmic spirals to only the HII regions and to all three kinds of spiral tracers, respectively. Both models can connect most spiral tracers, but the connections of known arm segments differ in the two models. A PL spiral arm model is able to not only connect most spiral tracers, but also match the observed tangential directions.
Acknowledgements.
We thank the referee for helpful comments, and Dr. Lépine and Dr. Bronfman for kindly providing us their data. The authors are supported by the Strategic Priority Research Program “The Emergence of Cosmological Structures” of the Chinese Academy of Sciences, Grant No. XDB09010200, and the National Natural Science Foundation (NNSF) of China No. 11473034. L.G.H. is also supported by the Young Researcher Grant of National Astronomical Observatories, Chinese Academy of Sciences.References
- Abraham et al. (1980) Abraham, Z., Lepine, J. R. D., & Braz, M. A. 1980, MNRAS, 193, 737
- Altenhoff et al. (1970) Altenhoff, W. J., Downes, D., Goad, L., Maxwell, A., & Rinehart, R. 1970, A&AS, 1, 319
- Altenhoff et al. (1979) Altenhoff, W. J., Downes, D., Pauls, T., & Schraml, J. 1979, A&AS, 35, 23
- Amaral & Lepine (1997) Amaral, L. H. & Lepine, J. R. D. 1997, MNRAS, 286, 885
- Anderson & Bania (2009) Anderson, L. D. & Bania, T. M. 2009, ApJ, 690, 706
- Anderson et al. (2014) Anderson, L. D., Bania, T. M., Balser, D. S., et al. 2014, ApJS, 212, 1
- Anderson et al. (2011) Anderson, L. D., Bania, T. M., Balser, D. S., & Rood, R. T. 2011, ApJS, 194, 32
- Anderson et al. (2012) Anderson, L. D., Bania, T. M., Balser, D. S., & Rood, R. T. 2012, ApJ, 754, 62
- Araya et al. (2002) Araya, E., Hofner, P., Churchwell, E., & Kurtz, S. 2002, ApJS, 138, 63
- Azimlu et al. (2011) Azimlu, M., Marciniak, R., & Barmby, P. 2011, AJ, 142, 139
- Balser et al. (2011) Balser, D. S., Rood, R. T., Bania, T. M., & Anderson, L. D. 2011, ApJ, 738, 27
- Bania (1980) Bania, T. M. 1980, ApJ, 242, 95
- Bania et al. (2012) Bania, T. M., Anderson, L. D., & Balser, D. S. 2012, ApJ, 759, 96
- Bania et al. (2010) Bania, T. M., Anderson, L. D., Balser, D. S., & Rood, R. T. 2010, ApJ, 718, L106
- Bartkiewicz et al. (2008) Bartkiewicz, A., Brunthaler, A., Szymczak, M., van Langevelde, H. J., & Reid, M. J. 2008, A&A, 490, 787
- Benjamin et al. (2005) Benjamin, R. A., Churchwell, E., Babler, B. L., et al. 2005, ApJ, 630, L149
- Bennett et al. (1986) Bennett, C. L., Lawrence, C. R., Burke, B. F., Hewitt, J. N., & Mahoney, J. 1986, ApJS, 61, 1
- Beuermann et al. (1985) Beuermann, K., Kanbach, G., & Berkhuijsen, E. M. 1985, A&A, 153, 17
- Beuther et al. (2009) Beuther, H., Walsh, A. J., & Longmore, S. N. 2009, ApJS, 184, 366
- Binney & Tremaine (2008) Binney, J. & Tremaine, S. 2008, Galactic Dynamics: Second Edition (Princeton University Press)
- Blitz et al. (1982) Blitz, L., Fich, M., & Stark, A. A. 1982, ApJS, 49, 183
- Bloemen et al. (1990) Bloemen, J. B. G. M., Deul, E. R., & Thaddeus, P. 1990, A&A, 233, 437
- Blum et al. (2001) Blum, R. D., Damineli, A., & Conti, P. S. 2001, AJ, 121, 3149
- Bobylev (2010) Bobylev, V. V. 2010, Astronomy Letters, 36, 634
- Bobylev & Bajkova (2014) Bobylev, V. V. & Bajkova, A. T. 2014, MNRAS, 437, 1549
- Brand & Blitz (1993) Brand, J. & Blitz, L. 1993, A&A, 275, 67 (BB93)
- Brand & Wouterloot (1994) Brand, J. & Wouterloot, J. G. A. 1994, A&AS, 103, 503
- Bronfman (1992) Bronfman, L. 1992, in Astrophysics and Space Science Library, Vol. 180, The center, bulge, and disk of the Milky Way, ed. L. Blitz, 131–+
- Bronfman (2008) Bronfman, L. 2008, Ap&SS, 313, 81
- Bronfman et al. (1989) Bronfman, L., Nyman, L., & Thaddeus, P. 1989, in Lecture Notes in Physics, Berlin Springer Verlag, Vol. 331, The Physics and Chemistry of Interstellar Molecular Clouds - mm and Sub-mm Observations in Astrophysics, ed. G. Winnewisser & J. T. Armstrong, 139–140
- Bronfman et al. (1996) Bronfman, L., Nyman, L.-A., & May, J. 1996, A&AS, 115, 81
- Brunthaler et al. (2011) Brunthaler, A., Reid, M. J., Menten, K. M., et al. 2011, Astronomische Nachrichten, 332, 461
- Brunthaler et al. (2009) Brunthaler, A., Reid, M. J., Menten, K. M., et al. 2009, ApJ, 693, 424
- Burton (1988) Burton, W. B. 1988, The structure of our Galaxy derived from observations of neutral hydrogen, ed. Kellermann, K. I. and Verschuur, G. L., 295–358
- Burton & Shane (1970) Burton, W. B. & Shane, W. W. 1970, in IAU Symposium, Vol. 38, The Spiral Structure of our Galaxy, ed. W. Becker & G. I. Kontopoulos, 397
- Busfield et al. (2006) Busfield, A. L., Purcell, C. R., Hoare, M. G., et al. 2006, MNRAS, 366, 1096
- Carpenter et al. (1990) Carpenter, J. M., Snell, R. L., & Schloerb, F. P. 1990, ApJ, 362, 147
- Caswell (1972) Caswell, J. L. 1972, Australian Journal of Physics, 25, 443
- Caswell et al. (2010) Caswell, J. L., Fuller, G. A., Green, J. A., et al. 2010, MNRAS, 404, 1029
- Caswell et al. (2011) Caswell, J. L., Fuller, G. A., Green, J. A., et al. 2011, MNRAS, 417, 1964
- Caswell & Haynes (1987) Caswell, J. L. & Haynes, R. F. 1987, A&A, 171, 261
- Caswell et al. (1975) Caswell, J. L., Murray, J. D., Roger, R. S., Cole, D. J., & Cooke, D. J. 1975, A&A, 45, 239
- Cedrés et al. (2012) Cedrés, B., Cepa, J., Bongiovanni, Á., et al. 2012, A&A, 545, A43
- Cersosimo et al. (2009) Cersosimo, J. C., Mader, S., Figueroa, N. S., et al. 2009, ApJ, 699, 469
- Chatzopoulos et al. (2014) Chatzopoulos, S., Fritz, T., Gerhard, O., et al. 2014, arXiv:1403.5266
- Chen et al. (1996) Chen, W., Gehrels, N., Diehl, R., & Hartmann, D. 1996, A&AS, 120, C315
- Choi et al. (2014) Choi, Y. K., Hachisuka, K., Reid, M. J., et al. 2014, arXiv:1407.1609
- Churchwell et al. (2009) Churchwell, E., Babler, B. L., Meade, M. R., et al. 2009, PASP, 121, 213
- Churchwell et al. (1974) Churchwell, E., Mezger, P. G., & Huchtmeier, W. 1974, A&A, 32, 283
- Clemens (1985) Clemens, D. P. 1985, ApJ, 295, 422
- Coşkunoǧlu et al. (2011) Coşkunoǧlu, B., Ak, S., Bilir, S., et al. 2011, MNRAS, 412, 1237
- Cohen & Davies (1976) Cohen, R. J. & Davies, R. D. 1976, MNRAS, 175, 1
- Cohen et al. (1980) Cohen, R. S., Cong, H., Dame, T. M., & Thaddeus, P. 1980, ApJ, 239, L53
- Cohen et al. (1986) Cohen, R. S., Dame, T. M., & Thaddeus, P. 1986, ApJS, 60, 695
- Cohen et al. (1985) Cohen, R. S., Grabelsky, D. A., May, J., et al. 1985, ApJ, 290, L15
- Comerón et al. (2006) Comerón, F., Pasquali, A., & Torra, J. 2006, A&A, 457, 553
- Copetti et al. (2007) Copetti, M. V. F., Oliveira, V. A., Riffel, R., Castañeda, H. O., & Sanmartim, D. 2007, A&A, 472, 847
- Cordes & Lazio (2002) Cordes, J. M. & Lazio, T. J. W. 2002, arXiv:astro-ph/0207156
- Crowther & Furness (2008) Crowther, P. A. & Furness, J. P. 2008, A&A, 492, 111
- Cyganowski et al. (2009) Cyganowski, C. J., Brogan, C. L., Hunter, T. R., & Churchwell, E. 2009, ApJ, 702, 1615
- Dame (2013) Dame, T. M. 2013, in American Astronomical Society Meeting Abstracts, Vol. 222, American Astronomical Society Meeting Abstracts, 400.01
- Dame et al. (1986) Dame, T. M., Elmegreen, B. G., Cohen, R. S., & Thaddeus, P. 1986, ApJ, 305, 892
- Dame et al. (2001) Dame, T. M., Hartmann, D., & Thaddeus, P. 2001, ApJ, 547, 792
- Dame & Thaddeus (2008) Dame, T. M. & Thaddeus, P. 2008, ApJ, 683, L143
- Dame & Thaddeus (2011) Dame, T. M. & Thaddeus, P. 2011, ApJ, 734, L24
- Dawson et al. (2008) Dawson, J. R., Kawamura, A., Mizuno, N., Onishi, T., & Fukui, Y. 2008, PASJ, 60, 1297
- Deharveng et al. (2010) Deharveng, L., Schuller, F., Anderson, L. D., et al. 2010, A&A, 523, A6
- Dehnen & Binney (1998) Dehnen, W. & Binney, J. J. 1998, MNRAS, 298, 387
- Dickel & Milne (1972) Dickel, J. R. & Milne, D. K. 1972, Australian Journal of Physics, 25, 539
- Dickey et al. (2009) Dickey, J. M., Strasser, S., Gaensler, B. M., et al. 2009, ApJ, 693, 1250
- Dieter (1967) Dieter, N. H. 1967, ApJ, 150, 435
- Digel et al. (1994) Digel, S., de Geus, E., & Thaddeus, P. 1994, ApJ, 422, 92
- Digel et al. (1990) Digel, S., Thaddeus, P., & Bally, J. 1990, ApJ, 357, L29
- Diplas & Savage (1991) Diplas, A. & Savage, B. D. 1991, ApJ, 377, 126
- Downes et al. (1980) Downes, D., Wilson, T. L., Bieging, J., & Wink, J. 1980, A&AS, 40, 379
- Drimmel & Spergel (2001) Drimmel, R. & Spergel, D. N. 2001, ApJ, 556, 181
- Du et al. (2011) Du, Z. M., Zhou, J. J., Esimbek, J., Han, X. H., & Zhang, C. P. 2011, A&A, 532, A127
- Dzib et al. (2011) Dzib, S., Loinard, L., Rodríguez, L. F., Mioduszewski, A. J., & Torres, R. M. 2011, ApJ, 733, 71
- Efremov (1998) Efremov, Y. N. 1998, Astronomical and Astrophysical Transactions, 15, 3
- Ellingsen (2006) Ellingsen, S. P. 2006, ApJ, 638, 241
- Ellingsen (2007) Ellingsen, S. P. 2007, MNRAS, 377, 571
- Englmaier & Gerhard (1999) Englmaier, P. & Gerhard, O. 1999, MNRAS, 304, 512
- Felli & Churchwell (1972) Felli, M. & Churchwell, E. 1972, A&AS, 5, 369
- Fich & Blitz (1984) Fich, M. & Blitz, L. 1984, ApJ, 279, 125
- Fich et al. (1989) Fich, M., Blitz, L., & Stark, A. A. 1989, ApJ, 342, 272
- Fich et al. (1990) Fich, M., Dahl, G. P., & Treffers, R. R. 1990, AJ, 99, 622
- Fish et al. (2003) Fish, V. L., Reid, M. J., Wilner, D. J., & Churchwell, E. 2003, ApJ, 587, 701
- Fontani et al. (2010) Fontani, F., Cesaroni, R., & Furuya, R. S. 2010, A&A, 517, A56
- Foster & Brunt (2014) Foster, T. J. & Brunt, C. M. 2014, arXiv:1405.7003
- Francis & Anderson (2009) Francis, C. & Anderson, E. 2009, New A, 14, 615
- Francis & Anderson (2012) Francis, C. & Anderson, E. 2012, MNRAS, 422, 1283
- Furst et al. (1990) Furst, E., Reich, W., Reich, P., & Reif, K. 1990, A&AS, 85, 805
- Garay et al. (2007) Garay, G., Mardones, D., Brooks, K. J., Videla, L., & Contreras, Y. 2007, ApJ, 666, 309
- García et al. (2014) García, P., Bronfman, L., Nyman, L.-Å., Dame, T. M., & Luna, A. 2014, ApJS, 212, 2
- Garcia-Burillo et al. (1993) Garcia-Burillo, S., Guelin, M., & Cernicharo, J. 1993, A&A, 274, 123
- Georgelin & Georgelin (1976) Georgelin, Y. M. & Georgelin, Y. P. 1976, A&A, 49, 57 (GG76)
- Ghez et al. (2008) Ghez, A. M., Salim, S., Weinberg, N. N., et al. 2008, ApJ, 689, 1044
- Gillessen et al. (2009) Gillessen, S., Eisenhauer, F., Trippe, S., et al. 2009, ApJ, 692, 1075
- Grabelsky et al. (1988) Grabelsky, D. A., Cohen, R. S., Bronfman, L., & Thaddeus, P. 1988, ApJ, 331, 181
- Grabelsky et al. (1987) Grabelsky, D. A., Cohen, R. S., Bronfman, L., Thaddeus, P., & May, J. 1987, ApJ, 315, 122
- Green et al. (2009) Green, J. A., Caswell, J. L., Fuller, G. A., et al. 2009, MNRAS, 392, 783
- Green et al. (2010) Green, J. A., Caswell, J. L., Fuller, G. A., et al. 2010, MNRAS, 409, 913
- Green et al. (2012) Green, J. A., Caswell, J. L., Fuller, G. A., et al. 2012, MNRAS, 420, 3108
- Green et al. (2011) Green, J. A., Caswell, J. L., McClure-Griffiths, N. M., et al. 2011, ApJ, 733, 27
- Green & McClure-Griffiths (2011) Green, J. A. & McClure-Griffiths, N. M. 2011, MNRAS, 417, 2500
- Gregory & Condon (1991) Gregory, P. C. & Condon, J. J. 1991, ApJS, 75, 1011
- Gregory et al. (1996) Gregory, P. C., Scott, W. K., Douglas, K., & Condon, J. J. 1996, ApJS, 103, 427
- Griffith et al. (1994) Griffith, M. R., Wright, A. E., Burke, B. F., & Ekers, R. D. 1994, ApJS, 90, 179
- Griffith et al. (1995) Griffith, M. R., Wright, A. E., Burke, B. F., & Ekers, R. D. 1995, ApJS, 97, 347
- Grosbol & Patsis (1998) Grosbol, P. J. & Patsis, P. A. 1998, A&A, 336, 840
- Hachisuka et al. (2009) Hachisuka, K., Brunthaler, A., Menten, K. M., et al. 2009, ApJ, 696, 1981
- Hammersley et al. (2000) Hammersley, P. L., Garzón, F., Mahoney, T. J., López-Corredoira, M., & Torres, M. A. P. 2000, MNRAS, 317, L45
- Han et al. (2011) Han, X.-H., Zhou, J.-J., Esimbek, J., Wu, G., & Gao, M.-F. 2011, Research in Astronomy and Astrophysics, 11, 156
- Hayakawa et al. (1981) Hayakawa, S., Matsumoto, T., Murakami, H., et al. 1981, A&A, 100, 116
- Henderson (1977) Henderson, A. P. 1977, A&A, 58, 189
- Henning et al. (2000) Henning, T., Lapinov, A., Schreyer, K., Stecklum, B., & Zinchenko, I. 2000, A&A, 364, 613
- Heyer et al. (2001) Heyer, M. H., Carpenter, J. M., & Snell, R. L. 2001, ApJ, 551, 852
- Hirota et al. (2008a) Hirota, T., Ando, K., Bushimata, T., et al. 2008a, PASJ, 60, 961
- Hirota et al. (2007) Hirota, T., Bushimata, T., Choi, Y. K., et al. 2007, PASJ, 59, 897
- Hirota et al. (2008b) Hirota, T., Bushimata, T., Choi, Y. K., et al. 2008b, PASJ, 60, 37
- Hirota et al. (2011) Hirota, T., Honma, M., Imai, H., et al. 2011, PASJ, 63, 1
- Hoare et al. (2005) Hoare, M. G., Lumsden, S. L., Oudmaijer, R. D., et al. 2005, in IAU Symposium, Vol. 227, Massive Star Birth: A Crossroads of Astrophysics, ed. R. Cesaroni, M. Felli, E. Churchwell, & M. Walmsley, 370–375
- Honma et al. (2007) Honma, M., Bushimata, T., Choi, Y. K., et al. 2007, PASJ, 59, 889
- Honma et al. (2011) Honma, M., Hirota, T., Kan-Ya, Y., et al. 2011, PASJ, 63, 17
- Honma et al. (2012) Honma, M., Nagayama, T., Ando, K., et al. 2012, PASJ, 64, 136
- Hou et al. (2009) Hou, L. G., Han, J. L., & Shi, W. B. 2009, A&A, 499, 473
- Immer et al. (2013) Immer, K., Reid, M. J., Menten, K. M., Brunthaler, A., & Dame, T. M. 2013, A&A, 553, A117
- Israel et al. (1975) Israel, F. P., Goss, W. M., & Allen, R. J. 1975, A&A, 40, 421
- Jackson et al. (2006) Jackson, J. M., Rathborne, J. M., Shah, R. Y., et al. 2006, ApJS, 163, 145
- Jones & Dickey (2012) Jones, C. & Dickey, J. M. 2012, ApJ, 753, 62
- Jones et al. (2013) Jones, C., Dickey, J. M., Dawson, J. R., et al. 2013, ApJ, 774, 117
- Kazes et al. (1977) Kazes, I., Walmsley, C. M., & Churchwell, E. 1977, A&A, 60, 293
- Kerr (1957) Kerr, F. J. 1957, AJ, 62, 93
- Kirk et al. (2013) Kirk, J. M., Gear, W. K., Fritz, J., et al. 2013, arXiv:1306.2913
- Knapen et al. (1992) Knapen, J. H., Beckman, J. E., Cepa, J., van der Hulst, T., & Rand, R. J. 1992, ApJ, 385, L37
- Kolpak et al. (2003) Kolpak, M. A., Jackson, J. M., Bania, T. M., Clemens, D. P., & Dickey, J. M. 2003, ApJ, 582, 756
- Kuchar & Bania (1994) Kuchar, T. A. & Bania, T. M. 1994, ApJ, 436, 117
- Kuchar & Clark (1997) Kuchar, T. A. & Clark, F. O. 1997, ApJ, 488, 224
- Kurayama et al. (2011) Kurayama, T., Nakagawa, A., Sawada-Satoh, S., et al. 2011, PASJ, 63, 513
- Kurtz et al. (1994) Kurtz, S., Churchwell, E., & Wood, D. O. S. 1994, ApJS, 91, 659
- Leahy & Tian (2008) Leahy, D. A. & Tian, W. W. 2008, AJ, 135, 167
- Lépine et al. (2001) Lépine, J. R. D., Mishurov, Y. N., & Dedikov, S. Y. 2001, ApJ, 546, 234
- Lépine et al. (2011) Lépine, J. R. D., Roman-Lopes, A., Abraham, Z., Junqueira, T. C., & Mishurov, Y. N. 2011, MNRAS, 414, 1607
- Levine et al. (2006) Levine, E. S., Blitz, L., & Heiles, C. 2006, ApJ, 643, 881
- Lima et al. (2014) Lima, E. F., Bica, E., Bonatto, C., & Saito, R. K. 2014, arXiv:1406.2413
- Lockman (1979) Lockman, F. J. 1979, ApJ, 232, 761
- Lockman (1989) Lockman, F. J. 1989, ApJS, 71, 469
- Lockman et al. (1996) Lockman, F. J., Pisano, D. J., & Howard, G. J. 1996, ApJ, 472, 173
- López-Corredoira et al. (2010) López-Corredoira, M., Cabrera-Lavers, A., Hammersley, P. L., et al. 2010, Highlights of Astronomy, 15, 811
- May et al. (1997) May, J., Alvarez, H., & Bronfman, L. 1997, A&A, 327, 325
- McGee & Gardner (1968) McGee, R. X. & Gardner, F. F. 1968, Australian Journal of Physics, 21, 149
- McGee & Newton (1981) McGee, R. X. & Newton, L. M. 1981, MNRAS, 196, 889
- McGee et al. (1975) McGee, R. X., Newton, L. M., & Batchelor, R. A. 1975, Australian Journal of Physics, 28, 185
- Mead & Kutner (1988) Mead, K. N. & Kutner, M. L. 1988, ApJ, 330, 399
- Menten (1991) Menten, K. M. 1991, ApJ, 380, L75
- Mezger & Hoglund (1967) Mezger, P. G. & Hoglund, B. 1967, ApJ, 147, 490
- Moellenbrock et al. (2009) Moellenbrock, G. A., Claussen, M. J., & Goss, W. M. 2009, ApJ, 694, 192
- Moisés et al. (2011) Moisés, A. P., Damineli, A., Figuerêdo, E., et al. 2011, MNRAS, 411, 705
- Molinari et al. (2010) Molinari, S., Swinyard, B., Bally, J., et al. 2010, PASP, 122, 314
- Moscadelli et al. (2011) Moscadelli, L., Cesaroni, R., Rioja, M. J., Dodson, R., & Reid, M. J. 2011, A&A, 526, A66+
- Moscadelli et al. (2009) Moscadelli, L., Reid, M. J., Menten, K. M., et al. 2009, ApJ, 693, 406
- Motogi et al. (2011) Motogi, K., Sorai, K., Habe, A., et al. 2011, PASJ, 63, 31
- Murphy et al. (2007) Murphy, T., Mauch, T., Green, A., et al. 2007, MNRAS, 382, 382
- Nakagawa et al. (2005) Nakagawa, M., Onishi, T., Mizuno, A., & Fukui, Y. 2005, PASJ, 57, 917
- Nakanishi & Sofue (2003) Nakanishi, H. & Sofue, Y. 2003, PASJ, 55, 191
- Nakanishi & Sofue (2006) Nakanishi, H. & Sofue, Y. 2006, PASJ, 58, 847
- Niinuma et al. (2011) Niinuma, K., Nagayama, T., Hirota, T., et al. 2011, PASJ, 63, 9
- Nyman et al. (1989) Nyman, L.-A., Bronfman, L., & Thaddeus, P. 1989, A&A, 216, 185
- Nyman et al. (1987) Nyman, L.-A., Thaddeus, P., Bronfman, L., & Cohen, R. S. 1987, ApJ, 314, 374
- Oh et al. (2010) Oh, C. S., Kobayashi, H., Honma, M., et al. 2010, PASJ, 62, 101
- Olmi et al. (2014) Olmi, L., Araya, E. D., Hofner, P., et al. 2014, A&A, 566, A18
- Paladini et al. (2003) Paladini, R., Burigana, C., Davies, R. D., et al. 2003, A&A, 397, 213
- Paladini et al. (2004) Paladini, R., Davies, R. D., & DeZotti, G. 2004, MNRAS, 347, 237
- Pandian et al. (2007) Pandian, J. D., Goldsmith, P. F., & Deshpande, A. A. 2007, ApJ, 656, 255
- Pandian et al. (2009) Pandian, J. D., Menten, K. M., & Goldsmith, P. F. 2009, ApJ, 706, 1609
- Pandian et al. (2008) Pandian, J. D., Momjian, E., & Goldsmith, P. F. 2008, A&A, 486, 191
- Pankonin et al. (1977) Pankonin, V., Barsuhn, J., & Thomasson, P. 1977, A&A, 54, 335
- Pedlar (1980) Pedlar, A. 1980, MNRAS, 192, 179
- Pestalozzi et al. (2005) Pestalozzi, M. R., Minier, V., & Booth, R. S. 2005, A&A, 432, 737
- Pinheiro et al. (2010) Pinheiro, M. C., Copetti, M. V. F., & Oliveira, V. A. 2010, A&A, 521, A26
- Pohl et al. (2008) Pohl, M., Englmaier, P., & Bissantz, N. 2008, ApJ, 677, 283
- Quireza et al. (2006) Quireza, C., Rood, R. T., Balser, D. S., & Bania, T. M. 2006, ApJS, 165, 338
- Rathborne et al. (2009) Rathborne, J. M., Johnson, A. M., Jackson, J. M., Shah, R. Y., & Simon, R. 2009, ApJS, 182, 131
- Reid et al. (2014) Reid, M. J., Menten, K. M., Brunthaler, A., et al. 2014, ApJ, 783, 130
- Reid et al. (2009a) Reid, M. J., Menten, K. M., Brunthaler, A., et al. 2009a, ApJ, 693, 397
- Reid et al. (2009b) Reid, M. J., Menten, K. M., Zheng, X. W., et al. 2009b, ApJ, 700, 137
- Reid et al. (2009c) Reid, M. J., Menten, K. M., Zheng, X. W., Brunthaler, A., & Xu, Y. 2009c, ApJ, 705, 1548
- Reifenstein et al. (1970) Reifenstein, E. C., Wilson, T. L., Burke, B. F., Mezger, P. G., & Altenhoff, W. J. 1970, A&A, 4, 357
- Reylé et al. (2009) Reylé, C., Marshall, D. J., Robin, A. C., & Schultheis, M. 2009, A&A, 495, 819
- Roberts (1972) Roberts, Jr., W. W. 1972, ApJ, 173, 259
- Rodriguez et al. (1980) Rodriguez, L. F., Moran, J. M., Ho, P. T. P., & Gottlieb, E. W. 1980, ApJ, 235, 845
- Roman-Duval et al. (2009) Roman-Duval, J., Jackson, J. M., Heyer, M., et al. 2009, ApJ, 699, 1153
- Rossano (1978) Rossano, G. S. 1978, AJ, 83, 1214
- Rozas et al. (1998) Rozas, M., Knapen, J. H., & Beckman, J. E. 1998, MNRAS, 301, 631
- Russeil (2003) Russeil, D. 2003, A&A, 397, 133
- Russeil et al. (2007) Russeil, D., Adami, C., & Georgelin, Y. M. 2007, A&A, 470, 161
- Russeil et al. (2012) Russeil, D., Zavagno, A., Adami, C., et al. 2012, A&A, 538, A142
- Rygl et al. (2010) Rygl, K. L. J., Brunthaler, A., Reid, M. J., et al. 2010, A&A, 511, A2+
- Rygl et al. (2012) Rygl, K. L. J., Brunthaler, A., Sanna, A., et al. 2012, A&A, 539, A79
- Sanna et al. (2012) Sanna, A., Reid, M. J., Dame, T. M., et al. 2012, ApJ, 745, 82
- Sanna et al. (2014) Sanna, A., Reid, M. J., Menten, K. M., et al. 2014, ApJ, 781, 108
- Sanna et al. (2009) Sanna, A., Reid, M. J., Moscadelli, L., et al. 2009, ApJ, 706, 464
- Sato et al. (2010a) Sato, M., Hirota, T., Reid, M. J., et al. 2010a, PASJ, 62, 287
- Sato et al. (2010b) Sato, M., Reid, M. J., Brunthaler, A., & Menten, K. M. 2010b, ApJ, 720, 1055
- Savchenko & Reshetnikov (2013) Savchenko, S. S. & Reshetnikov, V. P. 2013, MNRAS, 436, 1074
- Schönrich (2012) Schönrich, R. 2012, MNRAS, 427, 274
- Schönrich et al. (2010) Schönrich, R., Binney, J., & Dehnen, W. 2010, MNRAS, 403, 1829
- Schraml & Mezger (1969) Schraml, J. & Mezger, P. G. 1969, ApJ, 156, 269
- Seigar & James (1998) Seigar, M. S. & James, P. A. 1998, MNRAS, 299, 685
- Sewilo et al. (2004) Sewilo, M., Watson, C., Araya, E., et al. 2004, ApJS, 154, 553
- Shiozaki et al. (2011) Shiozaki, S., Imai, H., Tafoya, D., et al. 2011, PASJ, 63, 1219
- Silverglate & Terzian (1979) Silverglate, P. R. & Terzian, Y. 1979, ApJS, 39, 157
- Sodroski (1991) Sodroski, T. J. 1991, ApJ, 366, 95
- Solomon et al. (1987) Solomon, P. M., Rivolo, A. R., Barrett, J., & Yahil, A. 1987, ApJ, 319, 730
- Solomon et al. (1985) Solomon, P. M., Sanders, D. B., & Rivolo, A. R. 1985, ApJ, 292, L19
- Stead & Hoare (2010) Stead, J. J. & Hoare, M. G. 2010, MNRAS, 407, 923
- Sun et al. (2014) Sun, Y., Xu, Y., Chen, X., et al. 2014, A&A, 563, A130
- Tian & Leahy (2008) Tian, W. W. & Leahy, D. A. 2008, MNRAS, 391, L54
- Tian & Leahy (2014) Tian, W. W. & Leahy, D. A. 2014, ApJ, 783, L2
- Urquhart et al. (2012) Urquhart, J. S., Hoare, M. G., Lumsden, S. L., et al. 2012, MNRAS, 420, 1656
- Vallée (2008) Vallée, J. P. 2008, AJ, 135, 1301
- Vallée (2013) Vallée, J. P. 2013, International Journal of Astronomy and Astrophysics, 3, 20
- Vázquez et al. (2008) Vázquez, R. A., May, J., Carraro, G., et al. 2008, ApJ, 672, 930
- Viner et al. (1976) Viner, M. R., Clarke, J. N., & Hughes, V. A. 1976, AJ, 81, 512
- Vollmer et al. (2010) Vollmer, B., Gassmann, B., Derrière, S., et al. 2010, A&A, 511, A53
- Watson et al. (2003) Watson, C., Araya, E., Sewilo, M., et al. 2003, ApJ, 587, 714
- Weaver (1970) Weaver, H. 1970, in IAU Symposium, Vol. 38, The Spiral Structure of our Galaxy, ed. W. Becker & G. I. Kontopoulos, 126
- Wendker (1970) Wendker, H. J. 1970, A&A, 4, 378
- Wilson & Altenhoff (1972) Wilson, T. L. & Altenhoff, W. J. 1972, A&A, 16, 489
- Wilson et al. (1970) Wilson, T. L., Mezger, P. G., Gardner, F. F., & Milne, D. K. 1970, A&A, 6, 364
- Wink et al. (1982) Wink, J. E., Altenhoff, W. J., & Mezger, P. G. 1982, A&A, 108, 227
- Wink et al. (1983) Wink, J. E., Wilson, T. L., & Bieging, J. H. 1983, A&A, 127, 211
- Wood & Churchwell (1989) Wood, D. O. S. & Churchwell, E. 1989, ApJ, 340, 265
- Wright et al. (1994) Wright, A. E., Griffith, M. R., Burke, B. F., & Ekers, R. D. 1994, ApJS, 91, 111
- Wright et al. (1996) Wright, A. E., Griffith, M. R., Hunt, A. J., et al. 1996, ApJS, 103, 145
- Wu et al. (2014) Wu, Y. W., Sato, M., Reid, M. J., et al. 2014, A&A, 566, A17
- Wu et al. (2012) Wu, Y. W., Xu, Y., Menten, K. M., Zheng, X. W., & Reid, M. J. 2012, in IAU Symposium, Vol. 287, IAU Symposium, ed. R. S. Booth, W. H. T. Vlemmings, & E. M. L. Humphreys, 425–426
- Xu et al. (2008) Xu, Y., Li, J. J., Hachisuka, K., et al. 2008, A&A, 485, 729
- Xu et al. (2013) Xu, Y., Li, J. J., Reid, M. J., et al. 2013, ApJ, 769, 15
- Xu et al. (2011) Xu, Y., Moscadelli, L., Reid, M. J., et al. 2011, ApJ, 733, 25
- Xu et al. (2009a) Xu, Y., Reid, M. J., Menten, K. M., et al. 2009a, ApJ, 693, 413
- Xu et al. (2009b) Xu, Y., Reid, M. J., Menten, K. M., et al. 2009b, ApJ, 693, 413
- Xu et al. (2006) Xu, Y., Reid, M. J., Zheng, X. W., & Menten, K. M. 2006, Science, 311, 54
- Zhang et al. (2014) Zhang, B., Moscadelli, L., Sato, M., et al. 2014, ApJ, 781, 89
- Zhang et al. (2013) Zhang, B., Reid, M. J., Menten, K. M., et al. 2013, ApJ, 775, 79
- Zhang et al. (2009) Zhang, B., Zheng, X. W., Reid, M. J., et al. 2009, ApJ, 693, 419
Appendix A Tracer data for spiral structure
The related parameters of HII regions, GMCs, and 6.7 GHz methanol masers have been collected and calculated based on the data in literature, as listed in Table AA, respectively.
[x]llrrrrrclllllrrrllccccccccc
HII regions as tracers of spiral arms.
Notes. A
portion of this table is listed here. The entire version will be
available as a machine-readable form at the CDS and at the
authors’ webpage. Columns 13 list the Number, the Galactic
longitude, and the Galactic latitude for HII regions, taken from
the reference listed in Column 4; Column 5 and 6 list the velocity
and its uncertainty if available. The are directly
taken from references. The standard solar motion 20.0 km/s,
toward R.A.(1900) = 18h and Decl. (1900) = 30 deg was
generally adopted to get ; Column 7 is the measured
electron temperature; Column 8 and 9 list the used telescope and
the observed line(s) derived from the reference in Column 10. The
abbreviations for telescopes are: GBT–the Green Bank 100 m
telescope; Are–the Arecibo 305 m telescope; B&M–the 7 m
telescope of the Bell Telescope Laboratories and the 5 m telescope
at the Millimeter Wave Observatory; SET–the Swedish-ESO
Submillimeter telescope; OSO–the Onsala Space Observatory 20 m
telescope; PKS–the Parkes 64 m telescope; GBO–the 42.6 m
telescope of the NRAO at Green Bank; BRAL–the 25.8 m telescope of
the Berkeley Radio Astronomy Laboratory; Eff–the Effelsberg 100 m
telescope; XAO–the 25 m telescope of Xinjiang Observatory;
LO–the 0.76 m telescope at the Leuschner Observatory; DRAO–The
25.6 m telescope at the Dominion Radio Astrophysical Observatory;
ARO–the 46 m telescope of the Algonquin Radio Observatory. Column
1113 are the radio continuum flux of the HII region, the
observation frequency and the reference if available. Column
1416 list the photometric or trigonometric distance when
available, as well as the uncertainty and the reference; Column 17
is a note for the kinematic distance ambiguity and Column 18 is
the reference(s) and note: knear–the nearer kinematic distance is
adopted; kfar–the farther kinematic distance is adopted;
ktan–the tracer is located at the tangential point and the
distance to the tangent is adopted; kout–the tracer is in the
outer Galaxy; n3kpc–the tracer is located in the Near 3 kpc Arm;
f3kpc–the tracer is in the Far 3 kpc Arm; Columns 19 and 20 list
the distance to the GC and the distance to the Sun, the kinematic
distances when adopted are calculated with a flat rotation curve
with the IAU standard = 8.5 kpc and = 220
km s-1 and the standard solar motions; Column 21 is the
excitation parameter re-scaled by the adopted distance; Columns
2224 are the same as Columns 1921, except with fundamental
parameters = 8.3 kpc and = 239 km s-1
(Brunthaler et al. 2011) and the solar motions of Schönrich et al. (2010); Columns
2527 are the same as Columns 1921, except with the rotation
curve of Brand & Blitz (1993).
References. ab09: Anderson & Bania (2009); abbr11: Anderson et al. (2011); abbr12:
Anderson et al. (2012); adps79: Altenhoff et al. (1979); adg+70: Altenhoff et al. (1970);
ahck02: Araya et al. (2002); alb80: Abraham et al. (1980); bab12:
Bania et al. (2012); bfs82: Blitz et al. (1982); bnm96: Bronfman et al. (1996); brba11:
Balser et al. (2011); brm+09: Brunthaler et al. (2009); bwl09: Beuther et al. (2009);
casw72: Caswell (1972); cf08: Crowther & Furness (2008); ch87: Caswell & Haynes (1987);
cmh74: Churchwell et al. (1974); cor+07: Copetti et al. (2007); cpt06:
Comerón et al. (2006); diet67: Dieter (1967); dlr+11: Dzib et al. (2011);
dm72: Dickel & Milne (1972); dsa+10: Deharveng et al. (2010); dwbw80:
Downes et al. (1980); dze+11: Du et al. (2011); fb84: Fich & Blitz (1984); fb14:
Foster & Brunt (2014); fc72: Felli & Churchwell (1972); frwc03: Fish et al. (2003); fdt90:
Fich et al. (1990); F3R: Furst et al. (1990); GB6: Gregory et al. (1996); gg76:
Georgelin & Georgelin (1976); gm11: Green & McClure-Griffiths (2011); gmb+07: Garay et al. (2007); hab+08:
Hirota et al. (2008a); hbc+07: Hirota et al. (2007); hbc+08: Hirota et al. (2008b);
hbc+07b: Honma et al. (2007); hbm+09: Hachisuka et al. (2009); hls+00:
Henning et al. (2000); hze+11: Han et al. (2011); hhi+11: Hirota et al. (2011);
irm+13: Immer et al. (2013); jd12: Jones & Dickey (2012); kb94: Kuchar & Bania (1994);
kc97: Kuchar & Clark (1997); kcw94: Kurtz et al. (1994); kjb+03: Kolpak et al. (2003);
kns+11: Kurayama et al. (2011); kwc77: Kazes et al. (1977); lock79:
Lockman (1979); lock89: Lockman (1989); lph96: Lockman et al. (1996);
lra11: Lépine et al. (2011); lt08: Leahy & Tian (2008); lbbs14: Lima et al. (2014);
mcr+11: Moscadelli et al. (2011); mdf+11: Moisés et al. (2011); mg68:
McGee & Gardner (1968); mgps2: Murphy et al. (2007); mh67: Mezger & Hoglund (1967); mitg:
Bennett et al. (1986); mn81: McGee & Newton (1981); mnb75: McGee et al. (1975); mrm+09:
Moscadelli et al. (2009); mcg09: Moellenbrock et al. (2009); msh+11: Motogi et al. (2011);
nnh+11: Niinuma et al. (2011); okh+10: Oh et al. (2010); pbd+03:
Paladini et al. (2003); pbt77: Pankonin et al. (1977); pco10: Pinheiro et al. (2010); pdd04:
Paladini et al. (2004); pedl80: Pedlar (1980); PMN:
Wright et al. (1994, 1996); Griffith et al. (1994, 1995); qrbb06: Quireza et al. (2006);
rag07: Russeil et al. (2007); rbr+10: Rygl et al. (2010); rbs+12:
Rygl et al. (2012); rmb+09: Reid et al. (2009a); rmhg80: Rodriguez et al. (1980);
rmz+09: Reid et al. (2009c); ross78: Rossano (1978); rus03:
Russeil (2003); rwb+70: Reifenstein et al. (1970); shd+11: Shiozaki et al. (2011);
shr+10: Sato et al. (2010a); srbm10: Sato et al. (2010b); srd+12:
Sanna et al. (2012); srm+09: Sanna et al. (2009); srm+14: Sanna et al. (2014);
st79: Silverglate & Terzian (1979); swa+04: Sewilo et al. (2004); uhl12: Urquhart et al. (2012);
vch76: Viner et al. (1976); vgd+10: Vollmer et al. (2010); wa72: Wilson & Altenhoff (1972);
wam82: Wink et al. (1982); was+03: Watson et al. (2003); wend70:
Wendker (1970); wmgm70: Wilson et al. (1970); wsr+14: Wu et al. (2014);
wwb83: Wink et al. (1983); wxm+12: Wu et al. (2012); xlr+13:
Xu et al. (2013); xmr+11: Xu et al. (2011); xrm+08: Xu et al. (2009a);
xrm+09: Xu et al. (2009b); xrzm06: Xu et al. (2006); zms+14:
Zhang et al. (2014); zrm+13: Zhang et al. (2013); zzr+09: Zhang et al. (2009);
87GB: Gregory & Condon (1991).
No. Glon Glat Ref.
VLSR Te Tel. lines
Ref. S Freq. Ref. D Ref. Mark
Ref.& Note R8.5 D8.5 U8.5 R8.3
D8.3 U8.3 RBB93 DBB93 UBB93
km s-1 km s-1
K Jy GHz kpc kpc kpc kpc pc cm-2
kpc kpc pc cm-2 kpc kpc pc cm-2
(1) (2)
(3) (4) (5) (6) (7) (8) (9) (10) (11) (12) (13)
(14) (15) (16) (17) (18) (19) (20) (21) (22) (23)
(24) (25) (26) (27)
\endfirstheadcontinued.
No. Glon
Glat Ref. VLSR Te
Tel. lines Ref. S Freq. Ref. D
Ref. Mark Ref.& Note R8.5 D8.5 U8.5
R8.3 D8.3 U8.3 RBB93 DBB93
UBB93
km s-1 km s-1 K
Jy GHz kpc kpc kpc kpc pc cm-2 kpc
kpc pc cm-2 kpc kpc pc cm-2
(1) (2) (3)
(4) (5) (6) (7) (8) (9) (10) (11) (12) (13) (14)
(15) (16) (17) (18) (19) (20) (21) (22) (23) (24)
(25) (26) (27)
\endhead\endfoot1 0.02 0.13 bfs82 5.5 1.0 Leu H fdt90 1.5 0.2 rus03 kfar rus03,S17 bfs82,G359.50.6 rus03 7.00 1.50 6.80 1.50 7.00 1.50
2 0.09 0.01 wwb83 25.4 1.9 6600 Eff H76 wwb83 ,close to GC wwb83
0.068 0.014 dwbw80 34.0 5.0 4800 Eff H110 dwbw80 53.3 4.8 dwbw80
3 0.094 0.154 bnm96 16.0 SET CS(21) bnm96 ,174322855 bnm96
4 0.11 0.56 bfs82 18.1 0.9 B&M CO(10) bfs82 1.5 0.2 rus03 kfar rus03,S19 bfs82,G359.50.6 rus03 7.00 1.50 6.80 1.50 7.00 1.50
11.6 2.4 Leu H fdt90 ,S19 fdt90
5 0.18 0.05 wwb83 24.5 0.2 8800 Eff H76 wwb83 ,close to GC wwb83
0.178 0.050 dwbw80 32.0 5.0 15900 Eff H110 dwbw80 196.9 4.8 dwbw80
6 0.2 0.1 mh67 59.4 3.0 GBO H109 mh67 ,SgrA mh67
7 0.2 0.0 wmgm70 12.7 3.5 7600 PKS H109 wmgm70 180.0 5.0 wmgm70 ,near GC wmgm70
8 0.284 0.478 dwbw80 20.0 5.0 13000 Eff H110 dwbw80 2.2 4.8 dwbw80 knear rus03 0.46 8.05 75.65 0.45 7.85 74.44 0.41 8.09 75.93
0.279 0.484 bnm96 18.5 SET CS(21) bnm96 ,174492855 bnm96
9 0.33 0.19 bfs82 19.2 0.4 B&M CO(10) bfs82 0.150 0.843 mgps2 1.5 0.2 rus03 kfar rus03,S20 bfs82,G359.50.6 rus03 7.00 1.50 8.78 6.80 1.50 8.78 7.00 1.50 8.78
9.6 0.5 Leu H fdt90 ,S20 fdt90
0.314 0.199 bnm96 18.7 SET CS(21) bnm96 ,174392845 bnm96
10 0.361 0.780 dwbw80 20.0 5.0 5100 Eff H110 dwbw80 3.8 4.8 dwbw80 knear rus03 0.55 7.95 80.75 0.54 7.76 79.46 0.50 8.00 81.10
… … … … … … … … … … … … … … … … … … … … … … … … … … …
[x]rrcrrrrrrrrllccccccccc
GMCs as tracers of spiral arms.
Notes. A portion of
this table is shown here. The entire version will be available as
a machine-readable form at the CDS and at the authors’
webpage. Columns 1 and 2 are the Galactic longitude and the
Galactic latitude; Column 3 to 6 list the velocity, the luminosity
of CO emission line, the distance and mass of the molecular cloud,
which are obtained from the reference listed in Column 13; Column
7 and 8 list the size of the cloud in the directions of Galactic
longitude and latitude; Column 9 to 11 list the photometric or
trigonometric distance, its uncertainty and the reference when
available; Column 12 is the note for the kinematic distance
ambiguity, and the reference is in Column 13; Columns 14 and 15
give the distance to the GC and the distance to the Sun, the
kinematic distances when adopted are calculated with a flat
rotation curve with the IAU standard = 8.5 kpc and
= 220 km s-1 and the standard solar motions;
Column 16 is the GMC mass re-scaled by the adopted distance;
Columns 1719 are the same as Columns 1416, except with
fundamental parameters = 8.3 kpc and = 239
km s-1 (Brunthaler et al. 2011) and the solar motions of Schönrich et al. (2010);
Columns 2022 are the same as Columns 1416, except with the
rotation curve of Brand & Blitz (1993).
References. bw94: Brand & Wouterloot (1994); bnt89: Bronfman et al. (1989); css90: Carpenter et al. (1990); cgm+85: Cohen et al. (1985); dt11: Dame & Thaddeus (2011); dkm+08: Dawson et al. (2008); dgt94: Digel et al. (1994); dtb90: Digel et al. (1990); fb14: Foster & Brunt (2014); gbnd14: García et al. (2014); gcbt88: Grabelsky et al. (1988); hcs01: Heyer et al. (2001); hbc+07b: Honma et al. (2007); mab97: May et al. (1997); mk88: Mead & Kutner (1988); nomf05: Nakagawa et al. (2005); ntbc87: Nyman et al. (1987); nbt89: Nyman et al. (1989); rmb+09: Reid et al. (2009a); rjh+09: Roman-Duval et al. (2009); sod91: Sodroski (1991); srby87: Solomon et al. (1987); sh10: Stead & Hoare (2010).
Glon Glat D dlon dlat D Ref. Mark Ref. R8.5 D8.5 M8.5 R8.3 D8.3 M8.3 RBB93 DBB93 MBB93
km s-1 K km s-1 pc2 kpc kpc kpc kpc kpc kpc kpc kpc kpc
(1) (2) (3) (4) (5) (6) (7) (8) (9) (10) (11) (12) (13) (14) (15) (16) (17) (18) (19) (20) (21) (22)
\endfirstheadcontinued.
Glon Glat D dlon dlat D Ref. Mark Ref. R8.5 D8.5 M8.5 R8.3 D8.3 M8.3 RBB93 DBB93 MBB93
km s-1 K km s-1 pc2 kpc kpc kpc kpc kpc kpc kpc kpc kpc
(1) (2) (3) (4) (5) (6) (7) (8) (9) (10) (11) (12) (13) (14) (15) (16) (17) (18) (19) (20) (21) (22)
\endhead\endfoot8.00 0.50 128. 72.7 10.1 4.44 0.06 0.07 ktan srby87 1.64 9.55 3.97 1.65 9.40 3.84 1.18 8.42 3.08
8.20 0.20 20. 1402.0 15.9 17.63 0.17 0.21 kfar srby87 5.19 13.46 12.64 5.02 13.09 11.96 5.17 13.44 12.59
8.30 0.00 3. 226.0 6.2 6.54 0.40 0.11 3kpc srby87
8.30 0.10 48. 50.2 13.2 1.11 0.05 0.05 kfar srby87 3.38 11.57 0.85 3.34 11.33 0.82 3.31 11.49 0.84
8.30 0.30 16. 28.1 3.2 1.00 0.16 0.15 knear srby87 5.65 2.89 0.82 5.44 2.91 0.83 5.64 2.90 0.82
8.40 0.30 37. 233.0 5.7 6.65 0.32 0.15 knear srby87 3.95 4.66 4.44 3.87 4.53 4.20 3.89 4.72 4.57
8.50 1.00 16. 106.0 3.2 3.37 0.25 0.25 knear srby87 5.70 2.85 2.67 5.48 2.87 2.70 5.69 2.86 2.68
8.70 0.60 22. 8.6 4.0 0.42 0.08 0.09 knear srby87 5.12 3.45 0.31 4.96 3.41 0.30 5.09 3.48 0.32
8.90 0.50 12. 9.4 6.3 0.84 0.04 0.04 3kpc srby87
… … … … … … … … … … … … … … … … … … … … … …
[x]lrrrrrrrllllllll
6.7 GHz methanol masers as tracers of spiral
arms.
Notes. A portion of this table is shown here. The entire version
will be available as a machine-readable form at the CDS and at the
authors’ webpage. Columns 1 and 2 are the Galactic longitude and
latitude; Column 3 and 4 list the median velocity and the peak
velocity of the maser lines, the reference is listed in Column 5;
Column 68 list the photometric or trigonometric distance, its
uncertainty and the reference when available; Column 9 is the note
for the kinematic distance ambiguity; the reference is shown in
Column 10; Columns 11 and 12 list the distance to the GC and the
distance to the Sun, the kinematic distances when adopted are
calculated with a flat rotation curve with the IAU standard
= 8.5 kpc and = 220 km s-1 and the
standard solar motions; Columns 13 and 14 are the same as Columns
11 and 12 except with fundamental parameters = 8.3 kpc and
= 239 km s-1 (Brunthaler et al. 2011) and the solar motions
of Schönrich et al. (2010); Columns 15 and 16 are the same as Columns 11 and
12, except with the rotation curve of Brand & Blitz (1993).
References. ab09: Anderson & Bania (2009); bdc01: Blum et al. (2001); bbs+08:
Bartkiewicz et al. (2008) brm+09: Brunthaler et al. (2009); bph+06: Busfield et al. (2006);
cmr+75: Caswell et al. (1975); chr+14: Choi et al. (2014); dlr+11:
Dzib et al. (2011); dwbw80: Downes et al. (1980); gcf+12: Green et al. (2012);
gm11: Green & McClure-Griffiths (2011); hbc+07: Hirota et al. (2007); hbc+07b:
Honma et al. (2007); hhk+11: Honma et al. (2011); irm+13: Immer et al. (2013);
kns+11: Kurayama et al. (2011); kjb+03: Kolpak et al. (2003); mrm+09:
Moscadelli et al. (2009); msh+11: Motogi et al. (2011); mdf+11: Moisés et al. (2011);
mcr+11: Moscadelli et al. (2011); mdf+11: Moisés et al. (2011); nnh+11:
Niinuma et al. (2011); okh+10: Oh et al. (2010); oah+13: Olmi et al. (2014);
pmg08: Pandian et al. (2008); pmg09: Pandian et al. (2009); pmb05:
Pestalozzi et al. (2005); rjh+09: Roman-Duval et al. (2009); rbr+10: Rygl et al. (2010);
rbs+12: Rygl et al. (2012); rmb+09: Reid et al. (2009a); swa+04:
Sewilo et al. (2004); syby87: Solomon et al. (1987); srm+09: Sanna et al. (2009);
shr+10: Sato et al. (2010a); sxc+14: Sun et al. (2014); sh10:
Stead & Hoare (2010); uhl12: Urquhart et al. (2012); wam82: Wink et al. (1982); wxm+12:
Wu et al. (2012); wsr+14: Wu et al. (2014); xrzm06: Xu et al. (2006);
xlh+08: Xu et al. (2008); xrm+09: Xu et al. (2009b); xmr+11:
Xu et al. (2011); xlr+13: Xu et al. (2013); zzr+09: Zhang et al. (2009).
Glon Glat Ref. D Ref. Mark Ref. R8.5 D8.5 R8.3 D8.3 RBB93 DBB93
km s-1 km s-1 kpc kpc kpc kpc kpc kpc kpc kpc
(1) (2) (3) (4) (5) (6) (7) (8) (9) (10) (11) (12) (13) (14) (15) (16)
\endfirstheadcontinued.
Glon Glat Ref. D Ref. Mark Ref. R8.5 D8.5 R8.3 D8.3 RBB93 DBB93
km s-1 km s-1 kpc kpc kpc kpc kpc kpc kpc kpc
(1) (2) (3) (4) (5) (6) (7) (8) (9) (10) (11) (12) (13) (14) (15) (16)
\endhead\endfoot0.212 0.000 45.5 49.2 pmb05 ,174302844 pmb05
0.315 0.200 20.5 18.0 pmb05 ,174392845 pmb05
0.340 0.000 37.5 37.0 pmb05 ,174322835 pmb05
0.393 0.034 26.5 28.7 pmb05
0.496 0.188 5.0 0.8 pmb05 ,174292823 pmb05
0.530 0.180 2.0 7.0 pmb05 ,174302822 pmb05
0.546 0.851 14.0 14.0 pmb05 ,174702853 pmb05
… … … … … … … … … … … … … … … …