Measurement of galaxy clustering at and the evolution of galaxy bias from in the XDF, GOODS-S and GOODS-N
Abstract
Lyman-Break Galaxy (LBG) samples observed during reionization () with Hubble Space Telescope’s WideFieldCamera3 are reaching sizes sufficient to characterize their clustering properties. Using a combined catalog from the Hubble eXtreme Deep Field and CANDELS surveys, containing LBG candidates at at a mean redshift of , we detect a clear clustering signal in the angular correlation function (ACF) at , corresponding to a real-space correlation length cMpc. The derived galaxy bias is that of dark-matter halos of at , and highlights that galaxies below the current detection limit () are expected in lower-mass halos (). We compute the ACF of LBGs at in the same surveys. A trend of increasing bias is found from () to (), broadly consistent with galaxies at fixed luminosity being hosted in dark-matter halos of similar mass at , followed by a slight rise in halo masses at ( confidence). Separating the data at the median luminosity of the sample () shows higher clustering at for bright galaxies (cMpc, ) compared to faint galaxies (cMpc, ) implying a constant mass-to-light ratio . A similar trend is present in the sample with larger uncertainty. Finally, our bias measurements allow us to investigate the fraction of dark-matter halos hosting UV-bright galaxies (the duty-cycle, ). At values near unity are preferred, which may be explained by the shortened halo assembly time at high-redshift.
Subject headings:
cosmology: observations — galaxies: high-redshift — galaxies: general1. Introduction
The large-scale structure of the Universe and the physics of galaxy formation during the epoch of Reionization are now accessible to observational tests thanks to the Hubble Space Telescope WideFieldCamera3 (WFC3). The new WFC3 transformed the field by providing the first large samples of galaxies seen in the first Myr after the Big Bang (redshift ), identified using the Lyman-break, or dropout, technique (Steidel et al., 1996), from a variety of surveys (Bouwens et al., 2014; Windhorst et al., 2011; Trenti et al., 2011; McLure et al., 2013; Bradley et al., 2012; Oesch et al., 2012). Such observations show that there is a decreasing number density of galaxies as the epoch of reionization is approached, albeit with growing evidence of a steepening of the galaxy luminosity function (LF) faint end (Bouwens et al., 2014). By assuming that brighter galaxies are hosted in more massive dark-matter halos, the evolution of the galaxy LF can be linked to the underlying dark-matter halo mass function. Empirical models (Trenti et al., 2010; Tacchella et al., 2013), analytic models (Wyithe & Loeb, 2013) and cosmological simulations (Jaacks et al., 2012; Lacey et al., 2011) are all successful at reproducing the star-formation rate and LF, but there is little validation of predictions beyond galaxy number counts.
Studying the clustering properties of galaxies, through their Angular Correlation Function (ACF), is an avenue to probe the connection between the observed light and host dark-matter halos. At lower redshifts, extensive studies of clustering have been carried out, leading to measurements of the galaxy bias (the extra clustering of galaxies/halos compared to that of dark-matter), and host dark-matter halo mass (Adelberger et al., 1998; Arnouts et al., 1999; Giavalisco & Dickinson, 2001; Ouchi et al., 2004; Lee et al., 2006; Overzier et al., 2006).
Lee et al. (2006) investigated the observed distribution of the number of galaxies in a dark-matter halo at higher redshifts, known as the halo-occupation distribution, finding evidence for multiple occupation and sub-halo clustering, extending similar studies at lower redshift (e.g., Berlind & Weinberg 2002).
Furthermore, clustering enables characterization of the expected evolutionary history of the observed galaxy population. For example, Adelberger et al. (2005) compared their analysis of clustering of LBGs with analyses of clustering at to infer that their LBG sample represents the progenitors of present-day ellipticals. We can now take advantage of the large sample size and characterize the clustering properties of high-redshift Lyman-Break Galaxies (LBGs).
In this paper, we measure LBG clustering at for the first time. We investigate qualitative trends of average bias and clustering strength with luminosity, compare our results with those at lower redshift, constrain the fraction of dark-matter halos hosting LBGs (the duty cycle), and test high- theoretical modeling of halo occupation (Trenti et al., 2010; Wyithe et al., 2013). This paper is organized as follows: Section 2 describes the LBG sample. Section 3 presents our measurements of the ACF, and Section 4 our results. Section 5 summarizes and concludes. We use the latest Planck cosmology (,,,) = (, , , ) (Planck Collaboration, 2013). Magnitudes are in the AB system (Oke, 1974).
2. Data
Our analysis is based on a combined sample of candidate galaxies, photometrically selected as and -band dropouts from the Bouwens et al. (2014) [B+14] and McLure et al. (2013) analysis of Hubble’s deep and ultradeep area on the XDF/UDF fields (Illingworth et al., 2013) and the CANDELS data over GOODS-North and South (GN and GS, respectively; Grogin et al. 2011). The observations span from the arcmin2 area of the XDF, which reaches (), to the arcmin2 of CANDELS at . The B+14 catalogs include objects at . The McLure et al. (2013) catalogs list objects within XDF/GOODS-South. Galaxies in each catalog are selected using different methods; B+14 use a two-color selection to detect the Lyman-break, while McLure et al. (2013) use multi-band spectral energy distribution fitting. A combined catalog is constructed by removing double-counted objects, and by counting the 31 pairs with separation ( pixels, kpc at ) as single sources, with their fluxes combined since such small separations are comparable to the HST point spread function in the -band. This yields a total sample of objects, with overlap for objects one magnitude above the survey detection limit, and overlap for less robust candidates. To ensure that merging the two catalogs does not bias our ACF measurement, we carry out a control analysis of the ACF using only the B+14 catalog (Section 4).
We complement our new study at , with a re-analysis of clustering at lower redshift, using the latest , and -dropout ( catalogs by B+14. Table 1 lists our samples, which we split between “bright” and “faint” subsamples at the median magnitude of the sample, , to study the redshift evolution of the bias at constant UV luminosity. A comprehensive description of the data, including number counts, luminosity functions, and redshift distributions of the samples is available in B+14.
| Field | ||||
|---|---|---|---|---|
| XDF | 385(57) | 157(19) | 104(13) | 149(11) |
| HUDF091 | — | 93(24) | 38(9) | 52(9) |
| HUDF092 | 147(50) | 83(17) | 36(10) | 54(8) |
| GS-Deep | 1621(756) | 537(251) | 203(102) | 134(76) |
| GS-ERS | 757(445) | 209(150) | 62(49) | 64(52) |
| GS-Wide | 422(304) | 122(98) | 41(36) | 13(11) |
| GN-Deep | 1721(770) | 745(352) | 197(108) | 220(151) |
| GN-Wide 1 | 398(302) | 138(116) | 25(24) | 33(33) |
| GN-Wide 2 | 485(346) | 173(130) | 51(44) | 24(24) |
| TOTAL | 5936(3030) | 2257(1157) | 757(395) | 743(375) |
3. Estimating the angular correlation function and bias
The ACF measures the excess probability of finding two galaxies at an angular separation , over a random Poisson point process. We use the ACF estimator, (Landy & Szalay, 1993), where , and are the number of galaxy-galaxy pairs, galaxy-random point pairs and random-random point pairs (respectively) counted at a separation of . We produced random point catalogs using a spatial Poisson process, accounting for field geometry and crowding effects using segmentation maps produced by (Bertin & Arnouts, 1996).
We use linear binning with width to construct the ACF for the full sample. For subsamples at and we increase bin-width to to account for the reduced number of pairs. We assume a power law parameterization of the ACF, . Following previous investigations (Lee et al., 2006; Overzier et al., 2006), we fix , but we quantify in Section 4 the systematic uncertainty associated with this choice. Because of finite survey area, the observed ACF is underestimated by a constant known as the integral constraint (IC):
| (1) |
IC can be estimated from:
| IC | (2) | |||
| (3) |
where is the intrinsic ACF and is the measurement within the survey area, . For small area fields such as the XDF, the integral constraint is , while in larger fields (GOODS-S Deep) the IC starts becoming a second-order correction (). The only uncertainty in the IC derives from assuming fixed . is obtained from the observed ACF in the fields (each with their own IC) by maximizing the likelihood given by:
| (4) |
where , ICi and are the ACF measurements, integral constraints and uncertainties in field , respectively. After is determined, IC values can be added to the ACF measurements in each field, and combined to determine the intrinsic ACF shown in Figure 1. Errors in the ACF are estimated using bootstrap resampling (Ling et al., 1986), without including systematic sample (“cosmic”) variance uncertainty, which might be comparable to the random error (e.g., Trenti & Stiavelli 2008, and see Section 4 for field-to-field variations in our analysis).
We approximate the real-space correlation function with a power law , where the coefficients are related to the ACF coefficients by the Limber transform (Peebles, 1980; Adelberger et al., 2005),
| (5) | |||
| (6) |
Here where is the angular diameter distance and is the redshift distribution of the dropouts, is the beta function and . We assume the clustering evolution to be fixed in comoving coordinates over each redshift window. is taken from B+14 (see their Figure 1 for quantitative details), with mean values reported in Table 2, and typical standard deviations . From the real-space correlation function, we define the galaxy bias as the ratio of the galaxy variance at cMpc (comoving megaparsecs), , to the linear matter fluctuation at cMpc, :
| (7) | ||||
| (8) |
4. Results
4.1. Angular Correlation Function and Bias
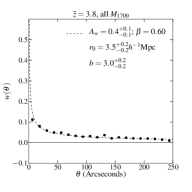
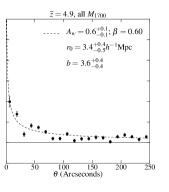
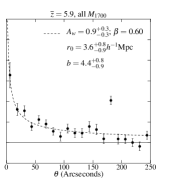
The right-most upper panel of Figure 1 shows the combined ACF at . There is a clear clustering signal, detected at high confidence (), and corresponding to a clustering length cMpc. For comparison, Figure 1 also shows the ACF at , and . Table 2 summarizes our estimates of , and for these ACF measurements. Figure 2 illustrates the evolution of the galaxy bias with redshift, and compares the bias of dark-matter halos at different masses computed with the Sheth & Tormen (1999) formalism. The bias at is , with a clear increase compared to the lower redshift measurements. The evolution of the clustering strength with redshift broadly follows the increase expected at an approximately constant dark-matter halo mass of out to , followed by a possible increase to at ( confidence). The near-constant trend between and is consistent with empirical models (Trenti et al., 2013; Tacchella et al., 2013), which predict no evolution or a mild decrease in halo masses at fixed UV-luminosity. In this respect, the result is unexpected and could potentially indicate a change in star formation efficiency or clustering properties as the Universe becomes more neutral, but the uncertainty is still large.
To investigate luminosity dependence, we split galaxies in our samples into bright and faint subsamples. We cut at the median luminosity of the sample, . Since LF shape evolution approximately cancels out the evolution in the -corrected distance modulus, this median cut is within mag of the median of each sample from to allowing us to explore bias variation at near-constant UV luminosity111Note that the cut is approximate at the level of mag., since the distance modulus is computed at the mean redshift for each dropout sample. At , the clustering strength in the bright sample is cMpc, while the faint sample has cMpc, smaller, but consistent with no luminosity evolution within the measurement uncertainty. The presence of a luminosiy trend is more apparent at , where we observe galaxies in the bright subsample () residing in more massive haloes () than those in the faint sample (, ). This is consistent with a constant mass-to-light ratio with luminosity in the sample . At lower redshift we observe a similar behavior (see also Lee et al. 2006), with a high-confidence measurement at (see Fig. 2 for the bias difference between LBGs in the bright and faint subsamples at and ).
4.2. Uncertainties and Analysis Validation
The uncertainties presented here derive from bootstrap resampling. These may underestimate the true uncertainty because they are derived at fixed and cosmic variance is not accounted for. To estimate cosmic variance, we use field-to-field variations in the bias, which are shown in Figure 3. Based on a analysis of the residuals between all-fields versus individual determination of the bias, we estimate that for each individual field measurement in the combined sample (left panel), cosmic variance uncertainty is comparable to the random error (excluding ). The impact on the all-field determination is mitigated by analyzing independent regions in the sky, and if we conservatively assume only two independent pointings (GOODS-N and S), we get that the systematic cosmic variance uncertainty is for our new measurement at . The current high- subsamples have larger random errors, thus the impact of cosmic variance is negligible compared to the random errors. We also carried out our analysis assuming different values for . At , we obtain that corresponds to . With a higher , we would derive . We investigate the impact of changing the mean and width of and find that shifting by changes our bias estimate by at each redshift interval. A change to the width of changes our bias estimate by .
To ensure robustness of our analysis against the combining of catalogs, we performed several checks. We first split the sample into -dropouts () and -dropouts (), obtaining , cMpc, at , and , cMpc, at . Additionally, we restrict the analysis to the B+14 sample, finding , cMpc, . These determinations are all consistent with results from the full sample, demonstrating absence of systematic errors introduced by combining heterogeneous datasets.
To investigate the impact of multiple halo occupancy, which we are neglecting in our analysis but may affect the ACF in the innermost (see Lee et al. 2006), we carried out our maximum likelihood determination of the ACF by excluding datapoints in the innermost . At we obtain for the full sample, which is completely consistent with from the full analysis. The lack of evidence for multiple halo occupation is expected, since multiple galaxies per halo are expected only when (very rare at ).
Finally, we verified that our low- analysis is consistent with previous published investigations. The correlation lengths of and dropouts are in general agreement with those presented in Lee et al. (2006), who found cMpc at and cMpc at , both with a fixed slope of , for their largest sample at each redshift. Our results at are consistent with those presented in Overzier et al. (2006), who found in the GOODS fields.
4.3. Duty Cycle
The duty cycle of LBGs is defined as the fraction of dark-matter halos hosting UV-bright LBGs and is linked to the star formation efficiency realized in the halos. The duty cycle depends on the occupation efficiency of dark matter haloes and the timescale that galaxies remain visible at ultraviolet wavelengths. Our clustering measurements allow us to estimate duty cycles by comparing the observed bias with that predicted by “abudance matching”, which connects luminosity functions to the dark-matter halo mass functions (e.g., Vale & Ostriker 2004) by matching objects at the same comoving density. Abundance matching is carried out assuming only a fraction of halos hosts a UV-bright galaxy. The number density of haloes above a mass is matched to the number density of galaxies above a luminosity using the duty cycle, (Trenti et al., 2010):
| (9) |
where is the luminosity function at redshift , is the halo mass function as redshift and is the duty cycle. We construct a mass-luminosity relation at from abundance matching between the Sheth & Tormen mass function and a Schechter LF, defined as,
| (10) |
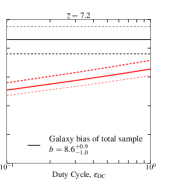
with , , (Bouwens et al., 2011). Matching luminosity with dark-matter halo mass gives us the average host halo mass of the galaxies, and thus a halo bias from the Sheth & Tormen formalism which depends on . This is shown in the bottom panels of Figure 1. By taking the intersection between the bias inferred from abudance matching and from clustering analysis, we derive the value of .
From Figure 1, we see that at duty cycles near are favored for the total sample, but all duty cycle values from abundance matching are in mild tension with the observed bias (which is too high). This discrepancy could be due to the systematic errors present in the analysis (cosmic variance and/or fixed ). As discussed in Section 4.2, the tension at is resolved by using a value of . Including the fixed- and cosmic variance uncertainties will approximately double the total uncertainty, compared to the random error interval shown in Figure 2.
At our duty cycle measurement contrasts with the theoretical expectation from Wyithe et al. (2013) who noted that for a low duty cycle () would be required to resolve the tension between the observed star-formation rate with the comparatively low observed total stellar mass. This prediction is consistent with our measurements at . Another explanation for the discrepancy may be the effect of reionization on galaxy bias measurements. Wyithe & Loeb (2007) showed that reionization, which occurs earlier in overdense regions, can enhance the observed galaxy bias in flux-limited samples. Early reionization of overdense regions leads to different star-formation histories due to heating of the IGM, and hence a different luminosity at fixed stellar mass. This results in overdense regions hosting a younger, brighter population of LBGs, which causes the observed galaxy bias to be overestimated. At , this effect may contribute at the level () (Wyithe & Loeb, 2007), which is similar to the discrepancy observed in the lower panels of Figure 1. This effect also results in an overestimation of the halo mass from the bias (a factor of for halos with ).
Previous studies, such as Lee et al. (2009), found lower duty cycles at lower redshifts. As starburts remain UV-bright for Myr, a shorter halo assembly time at high redshifts results in a higher duty cycle, as more haloes will be seen to host UV-bright galaxies (e.g. see the top-right panel of Fig. 1 in Trenti et al. 2010). This may qualitatively explain the increase in duty cycle observed with redshift. However, the current uncertainties in the analysis make it difficult to draw any firm conclusion on the redshift evolution of .
5. Conclusion
In this paper we carry out the first clustering analysis of LBG galaxies at , taking advantage of a combined sample of candidates from the XDF, GOODS-S and GOODS-N legacy fields. We detect a positive clustering signal with confidence, finding the real-space correlation length and bias of our sample to be cMpc and respectively. This result, and its interpretation, provides fundamental insight into several aspects of galaxy formation and evolution during the epoch of reionization:
-
•
We show that the bias of galaxies at fixed UV-luminosity clearly increases with redshift, from at to at , implying that LBGs of a fixed luminosity reside in dark-matter halos with similar masses at , followed by a moderate halo mass increase at . While the current uncertainty on the bias is still too large to provide stringent tests of models of galaxy formation, the tension between predicted and measured bias at could be linked to the effect of reionization (Wyithe & Loeb, 2007). Overall our analysis clearly demonstrates the potential of clustering analysis in future datasets;
-
•
We constrain the mass of dark-matter halos hosting the LBGs observed by Hubble, finding that galaxies live in halos with . Since dark-matter halos grow by around two orders of magnitude in mass from to based on Extended Press-Schechter modeling (e.g., Fig. 7 in Trenti et al. 2012a), this implies that the observed population of LBGs at will predominantly end up in a group or small-cluster environment by the present time;
-
•
We observe luminosity-dependent clustering within the sample when split at . The change in halo bias between these two samples implies a mass-to-light ratio of . A similar trend is present for galaxies at , but with larger uncertainty;
-
•
Finally, we provide a first constraint on the duty cycle of LBGs, finding values close to unity (Figure 1) and a possible evolution of the duty cycle with redshift. Such evolution is likely related to the shorter halo assembly times at increasing redshift;
These results highlight the significance of the progress in the study of galaxies during the first Gyr, made possible by the installation of WFC3 on Hubble and by the telescope time devoted to deep surveys such as XDF and CANDELS. The measure of galaxy clustering has been a fundamental tool in galaxy formation and evolution at lower redshift starting from the establishment of the cosmic web and its connection to dark-matter halos (e.g. Davis et al. 1985). Now, we have demonstrated how this measurement is possible for samples of objects during reionization: While the uncertainty on the galaxy bias at is still significant, upcoming programs such as the Frontier Fields Initiative will provide even stronger constraints on the connection between baryons and dark-matter in the youth of the Universe.
References
- Adelberger et al. (1998) Adelberger K. L., Steidel C. C., Giavalisco M., Dickinson M., Pettini M., Kellogg M., 1998, The Astrophysical Journal, 505, 18
- Adelberger et al. (2005) Adelberger K. L., Steidel C. C., Pettini M., Shapley A. E., Reddy N. A., Erb D. K., 2005, The Astrophysical Journal, 619, 697
- Arnouts et al. (1999) Arnouts S., Cristiani S., Moscardini L., Matarrese S., Lucchin F., Fontana A., Giallongo E., 1999, Monthly Notices of the Royal Astronomical Society, 310, 540
- Berlind & Weinberg (2002) Berlind, A. A. and Weinberg, D. H. 2002, ApJ, 575, 587
- Bertin & Arnouts (1996) Bertin E., Arnouts S., 1996, Astronomy and Astrophysics Supplement Series, 117, 393
- Bouwens et al. (2011) Bouwens R. et al., 2011, The Astrophysical Journal, 737, 90
- Bouwens et al. (2014) Bouwens R. et al. 2014, arXiv1403.4295B [B+14]
- Bradley et al. (2012) Bradley L. et al., 2012, The Astrophysical Journal, 760, 108
- Davis et al. (1985) Davis M., Efstathiou G., Frenk C. S., & White S. D. M. 1985, The Astrophysical Journal, 292, 37
- Planck Collaboration (2013) Collaboration P. et al., 2013, arXiv preprint arXiv:1303.5076
- Giavalisco & Dickinson (2001) Giavalisco M., Dickinson M., 2001, The Astrophysical Journal, 550, 177
- Grogin et al. (2011) Grogin, N. et al. (2011), The Astrophysical Journal Supplement, 197, 35
- Illingworth et al. (2013) Illingworth G. et al., 2013, The Astrophysical Journal Supplement, 209, 6
- Jaacks et al. (2012) Jaacks J., Choi J.-H., Nagamine K., Thompson R., Varghese S., 2012, Monthly Notices of the Royal Astronomical Society, 420, 1606
- Lacey et al. (2011) Lacey C., Baugh C., Frenk C., Benson A., 2011, Monthly Notices of the Royal Astronomical Society, 412, 1828
- Landy & Szalay (1993) Landy S. D., Szalay A. S., 1993, The Astrophysical Journal, 412, 64
- Lee et al. (2006) Lee K.-S., Giavalisco M., Gnedin O. Y., Somerville R. S., Ferguson H. C., Dickinson M., Ouchi M., 2006, The Astrophysical Journal, 642, 63
- Lee et al. (2009) Lee K.-S., Giavalisco M., Conroy C., Wechsler R. H., Ferguson H. C., Somerville R. S., Dickinson M. E., Urry C. M, 2009, The Astrophysical Journal, 695, 368
- Ling et al. (1986) Ling E. N., Barrow J. D., Frenk C., 1986, Monthly Notices of the Royal Astronomical Society, 223, 21P
- McLure et al. (2013) McLure R. et al., 2013, Monthly Notices of the Royal Astronomical Society, 432, 2696
- Oesch et al. (2012) Oesch P. et al., 2012, The Astrophysical Journal, 759, 135
- Oke (1974) Oke J., 1974, The Astrophysical Journal Supplement Series, 27, 21
- Ouchi et al. (2004) Ouchi M. et al., 2004, The Astrophysical Journal, 611, 685
- Overzier et al. (2006) Overzier R. A., Bouwens R. J., Illingworth G. D., Franx M., 2006, The Astrophysical Journal Letters, 648, L5
- Peebles (1980) Peebles P. J. E., 1980, The large-scale structure of the universe. Princeton university press
- Sheth & Tormen (1999) Sheth R. K., Tormen G., 1999, Monthly Notices of the Royal Astronomical Society, 308, 119
- Steidel et al. (1996) Steidel C. C., Giavalisco M., Dickinson M., Adelberger K. L., 1996, Arxiv preprint astro-ph/9604140
- Tacchella et al. (2013) Tacchella S., Trenti M., Carollo C. M., 2013, The Astrophysical Journal Letters, 768, L37
- Trenti et al. (2010) Trenti M., Stiavelli M., Bouwens R., Oesch P., Shull J., Illingworth G., Bradley L., Carollo C., 2010, The Astrophysical Journal Letters, 714, L202
- Trenti et al. (2011) Trenti M. et al., 2011, The Astrophysical Journal Letters, 727, L39
- Trenti et al. (2012a) Trenti, M. et al. 2012, The Astrophysical Journal Letters, 746, 55
- Trenti et al. (2013) Trenti M., Perna R., Tacchella S., 2013, The Astrophysical Journal Letters, 773, L22
- Trenti & Stiavelli (2008) Trenti, M. and Stiavelli, M. 2008, The Astrophysical Journal, 676, 767
- Vale & Ostriker (2004) Vale, A. and Ostriker, J. P. 2004, MNRAS, 353, 189
- Windhorst et al. (2011) Windhorst R. A. et al., 2011, The Astrophysical Journal Supplement Series, 193, 27
- Wyithe & Loeb (2007) Wyithe J. S. B., Loeb A., 2007, Monthly Notices of the Royal Astronomical Society, 382, 921
- Wyithe & Loeb (2013) Wyithe J. S. B., Loeb A., 2013, Monthly Notices of the Royal Astronomical Society, 428, 2741
- Wyithe et al. (2013) Wyithe S., Loeb A., Oesch P., 2013, arXiv preprint arXiv:1308.2030