On the reliability of protostellar disc mass measurements and the existence of fragmenting discs
Abstract
We couple non-magnetic, hydrodynamical simulations of collapsing protostellar cores with radiative transfer evolutionary models to generate synthetic observations. We then use these synthetic observations to investigate the extent to which a simple method for measuring protostellar disc masses used in the literature recovers the intrinsic masses of the discs formed in the simulations. We evaluate the effects of contamination from the surrounding core, partially resolving out the disc, optical depth, fixed assumed dust temperatures, inclination, and the dust opacity law. We show that the combination of these effects can lead to disc mass underestimates by up to factors of 2–3 at millimeter wavelengths and up to an order of magnitude or larger at submillimeter wavelengths. The optically thin portions of protostellar discs are generally cooler in the Class I stage than the Class 0 stage since Class I discs are typically larger and more optically thick, and thus more shielded. The observed disc mass distribution closely resembles the intrinsic distribution if this effect is taken into account, especially at millimeter wavelengths where optical depth effects are minimized. Approximately 50%–70% of protostellar discs observed to date with this method are consistent with the masses of the gravitationally unstable discs formed in the simulations, suggesting that at least some protostellar discs are likely sufficiently massive to fragment. We emphasize key future work needed to confirm these results, including assembling larger, less biased samples, and using molecular line observations to distinguish between rotationally supported, Keplerian discs and magnetically supported pseudodiscs.
1 Introduction
Circumstellar discs are ubiquitous in the star formation process. The disc fraction around young stars approaches 100% in star-forming regions with ages less than 1 Myr, and then steadily declines to 10% or less for regions 10 Myr or older (e.g., Wyatt, 2008). Disc formation is a natural consequence of the conservation of angular momentum in a collapsing system and has long been expected to form early in the protostellar stage. We note that, in this paper, the protostellar stage refers to the evolutionary stage when protostars (and their discs if they have already formed) are still embedded in and accreting from their parent cores (in other words, the Class 0 and I evolutionary stages; see, e.g., Dunham et al., 2014, for a recent review on evolutionary stages). Such early disc formation has been confirmed by Terebey, Shu & Cassen (1984), who modified the Shu (1977) solution for the inside-out collapse of a singular isothermal sphere to include rotation. The formation of relatively large, massive, Keplerian discs very early in the protostellar stage is also found by non-magnetic simulations of collapsing cores (e.g., Vorobyov, 2011). However, simulations of magnetized collapsing cores have found that efficient magnetic braking removes angular momentum from the system and may completely suppress disc formation in the protostellar stage (e.g., Allen, Li & Shu, 2003; Hennebelle & Teyssier, 2008; Mellon & Li, 2008; Seifried et al., 2011). Many potential solutions have been proposed to reduce the effects of magnetic braking and allow discs to form, including magnetic flux loss through various mechanisms, non-ideal MHD effects, outflow-induced envelope clearing, turbulence, and misalignment between the magnetic field and rotation axis (e.g., Mellon & Li, 2008; Machida, Inutsuka & Matsumoto, 2011; Seifried et al., 2012; Li, Krasnopolsky & Shang, 2013; Joos, Hennebelle & Ciardi, 2012; Krumholz, Crutcher & Hull, 2013; Machida, Inutsuka & Matsumoto, 2014). The latter has recently been tested by two observational studies which reached conflicting results on the alignment (or lack thereof) between magnetic fields and rotation axes (Hull et al., 2013; Chapman et al., 2013).
While discs must form at some point, how early they form and how quickly they grow in mass and size remain key open questions. Observations of discs surrounding embedded protostars are difficult because the discs are deeply embedded in their parent cores, and are especially challenging in the Class 0 stage when most of the system mass is still in the core. One of the earliest studies of a Class 0 protostellar disc was presented by Harvey et al. (2003), who modeled interferometer millimeter continuum observations of B335 and identified the presence of a compact component with a mass of 0.004 M⊙, which they inferred to be a disc. Similar inferences of Class 0 discs through analysis and modeling of compact components in interferometer (sub)millimeter continuum observations have been presented by other authors (e.g., Looney, Mundy & Welch, 2003; Chiang, Looney & Tobin, 2012; Zapata et al., 2013), although the results are model-dependent and the samples are too small to draw any statistical conclusions. Two recent surveys have used larger samples (10 – 20 protostars) to argue that discs form very early in the Class 0 stage (Jørgensen et al., 2009; Enoch et al., 2011), although both studies reach such sample sizes by using very simple methods for separating disc and core emission. On the other hand, Maury et al. (2010) found no evidence for large discs with sizes greater than 100 AU in an interferometer millimeter continuum survey of five Class 0 protostars and argued that their data were inconsistent with simulations that neglected magnetic braking. However, they did not directly address the nature of their continuum detections, in particular whether they arise from discs or inner, dense cores. Only three Class 0 systems have confirmed detections of discs through direct detection of Keplerian velocity profiles in millimeter spectral line observations: L1527 (Tobin et al., 2012, 2013), VLA 1623A (Murillo & Lai, 2013; Murillo et al., 2013), and R CrA IRS7B (Lindberg et al., 2014). Taken together, these studies emphasize that the properties and even the existence of embedded protostellar discs remains quite uncertain, especially at the youngest (Class 0) stages of protostellar evolution.
The formation time and early evolution of circumstellar discs has several consequences for both star and planet formation. If discs do indeed form early in the embedded stage, mass from the infalling core can pile up in them until they become gravitationally unstable and fragment. These fragments can be driven onto the star through torques associated with spiral arms in the discs, causing short accretion bursts and a general cycle of episodic protostellar mass accretion (e.g., Vorobyov & Basu, 2005, 2006, 2010b). Such bursts can have significant effects on the chemistry of the surrounding core and planet-forming disc (Lee, 2007; Kim et al., 2011, 2012; Visser & Bergin, 2012; Vorobyov et al., 2013). Additionally, the large changes in accretion rates lead to large changes in accretion luminosity, and the episodic mass accretion process driven by disc fragmentation predicted by Vorobyov & Basu (2010b) provides a viable solution to the protostellar luminosity problem (Dunham et al., 2010; Dunham & Vorobyov, 2012), whereby protostars are underluminous compared to simple theoretical expectations (Kenyon et al., 1990, 1994; Kenyon & Hartmann, 1995). Moreover, fragments can be ejected from discs into the intracluster medium, producing a population of proto-brown dwarfs and very-low-mass protostars (Basu & Vorobyov, 2012), or settle onto stable orbits, giving rise to wide-separation giant planet and brown dwarf companions (Vorobyov & Basu, 2010a; Vorobyov, 2013). Finally, solid cores forming in the fragment interiors may provide an alternative scenario for the icy and terrestrial planet formation (Nayakshin, 2010).
Clearly, the significance of all of these effects due to disc fragmentation will depend on when exactly, if at all, discs with sufficient mass to fragment actually form. While observational constraints are currently quite limited, as discussed above, the largest surveys to date of protostellar discs (Jørgensen et al., 2009; Enoch et al., 2011) depend on very simple assumptions to separate disc and core emission and derive disc masses. If these methods successfully recover disc masses they offer a promising method of assessing the formation and early evolution of protostellar discs for statistically significant samples. In this paper we use synthetic observations of simulated protostellar core+disc systems to evaluate whether or not these assumptions successfully recover disc masses, and, based on those results, assess whether protostellar discs are sufficiently massive to fragment given the current observational constraints. The organization of this paper is as follows: We describe the coupling between the hydrodynamic simulations and radiative transfer models used to generate the synthetic observations in §2, we evaluate the extent to which simple assumptions can be adopted to recover intrinsic disc masses from our synthetic interferometric observations in §3, we discuss the implications and limitations of our results in §4 and §5, respectively, and we summarize our results in §6.
2 Description of the Model
To assess whether or not recent interferometer surveys of protostars are capable of successfully recovering the intrinsic masses of protostellar discs, we use models that are based on a coupling of the two-dimensional, numerical hydrodynamical simulations of collapsing cores presented by Vorobyov & Basu (2010b) with the two-dimensional, evolutionary radiative transfer models of collapsing cores presented by Dunham et al. (2010). To briefly summarize, the Vorobyov & Basu (2010b) hydrodynamical simulations follow for several Myr the collapse of a non-magnetized cloud core with a fixed initial mass and initial angular momentum from the starless phase, through the embedded phase, and into the T Tauri phase, with a self-consistent calculation of the instantaneous accretion rates onto the disc and protostar and thus the masses of the core, disc, and protostar as a function of time. The Dunham et al. (2010) evolutionary models use the two-dimensional, axisymmetric, Monte Carlo dust radiative transfer code RADMC (Dullemond & Turolla, 2000; Dullemond & Dominik, 2004) to calculate the dust temperature profiles, including both internal heating from the protostar and external heating from the interstellar radiation field. Accompanying routines are then used to generate spectral energy distributions (SEDs) and images through ray-tracing and to calculate the complex interferometer visibilities. We adopt the dust opacities of Ossenkopf & Henning (1994) appropriate for thin ice mantles after yr of coagulation at a gas density of cm-3 (OH5 dust; see §3.4 for a discussion of the effects of grain growth in discs on the opacity law and resulting disc mass calculations), and include isotropic scattering off dust grains. SEDs and complex interferometer visibilities at each timestep are calculated for nine different inclinations ranging from ∘ in steps of 10∘, where ∘ corresponds to a pole-on (face-on) system and ∘ corresponds to an edge-on system.
| Core Outer Radius | Initial Core Mass | |||||
|---|---|---|---|---|---|---|
| Model | (rad s-1) | (AU) | (g cm-2) | (pc) | (M⊙) | |
| 1 | 4.4 | 2057 | 0.06 | 0.06 | 0.922 | |
| 2 | 4.6 | 343 | 0.36 | 0.01 | 0.153 |
2.1 Hydrodynamical Simulations
Our numerical hydrodynamics model for the formation and evolution of a young stellar object is described in detail in Vorobyov & Basu (2010b) and Vorobyov et al. (2013). Here, we briefly review the main concepts. The model includes a protostar, described by a stellar evolution code, and a protostellar disc plus infalling envelope, both described by a numerical hydrodynamics code. Both codes are coupled in real time, but due to computational constraints the stellar evolution code is invoked only every 25 yr to update the properties of the forming star. We use the thin-disc approximation complemented by a calculation of the vertical scale height in both the disc and envelope determined in each computational cell using an assumption of local hydrostatic equilibrium. The resulting model has a flared structure with the vertical scale height increasing with radial distance. Both the disc and envelope receive a fraction of the irradiation energy from the central protostar.
The main physical processes taken into account when computing the evolution of the disc and envelope include viscous and shock heating, irradiation by the forming star, background irradiation, radiative cooling from the disc surface, and self-gravity. The corresponding equations of mass, momentum, and energy transport are
| (1) |
| (3) |
where subscripts and refers to the planar components in polar coordinates, is the mass surface density, is the internal energy per surface area, is the vertically integrated gas pressure calculated via the ideal equation of state as with , is the velocity in the disc plane, and is the gradient along the planar coordinates of the disc. The gravitational acceleration in the disc plane, , takes into account self-gravity of the disc, found by solving for the Poisson integral, and the gravity of the central protostar. Turbulent viscosity is taken into account via the viscous stress tensor . We parameterize the magnitude of kinematic viscosity using the -prescription with a spatially and temporally uniform . The radiative cooling in equation (2.1) is determined using the diffusion approximation of the vertical radiation transport in a one-zone model of the vertical disc structure (Johnson & Gammie, 2003), while the radiative heating is calculated using the irradiation temperature at the disc surface determined by the stellar and background black-body irradiation. For more details the reader is referred to Vorobyov & Basu (2010b) and Vorobyov et al. (2013).
For the initial gas surface density and angular velocity distributions we take those typical of pre-stellar cores formed as a result of the slow expulsion of magnetic field due to ambipolar diffusion (Basu, 1997)
| (4) |
| (5) |
Here, and are the angular velocity and gas surface density at the center of the core and is the radius of the central plateau, where is the initial sound speed in the core. The gas surface density distribution described by equation (4) can be obtained (to within a factor of unity) by integrating the three-dimensional gas density distribution characteristic of Bonnor-Ebert spheres with a positive density-perturbation amplitude A (Dapp & Basu, 2009). The value of is set to 1.2 and the initial gas temperature is set to 10 K.
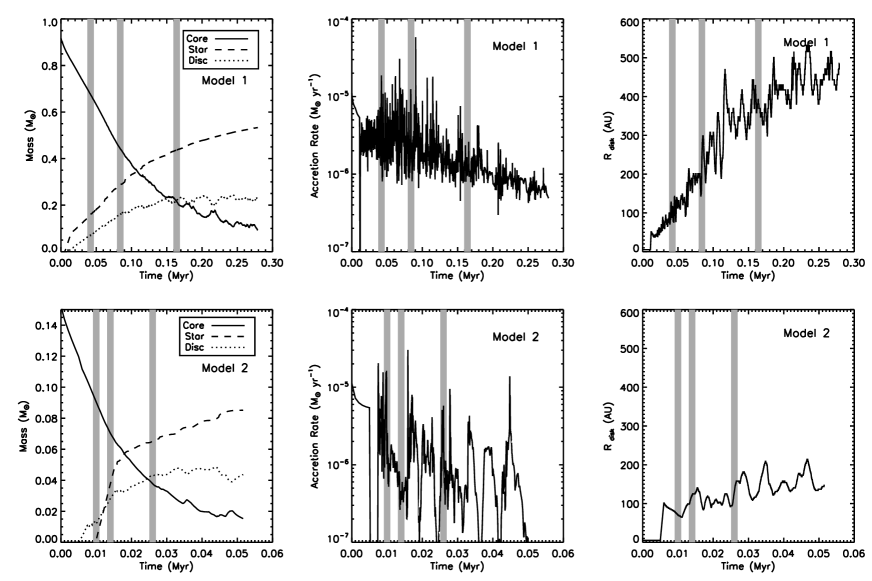
In this paper two different models with different initial conditions are coupled with the radiative transfer models, as described below in §2.2. Table 1 lists the initial conditions for each model, including the initial central angular velocity (), the initial outer radius of the core (), the initial central surface density (), the radius of the central region with an initially flat surface density profile (), the initial core mass, and the initial ratio of rotational to gravitational energy (). Figure 1 plots the time evolution of the core, star, and disc masses, protostellar mass accretion rates, and disc radii for each model. These two models are chosen to represent opposite extremes: model 1 has a near-solar mass core that forms a sub-solar mass star, whereas model 2 initially has a much lower core mass, giving birth to a very-low mass star. As a consequence, model 1 forms a much larger, more massive disc than model 2 (see Figure 1 and Vorobyov & Basu, 2010b, for details). Nevertheless, both discs are gravitationally unstable and prone to fragmentation, owing to rather high initial values of , and also reveal highly variable accretion rates caused by disc gravitational instability.
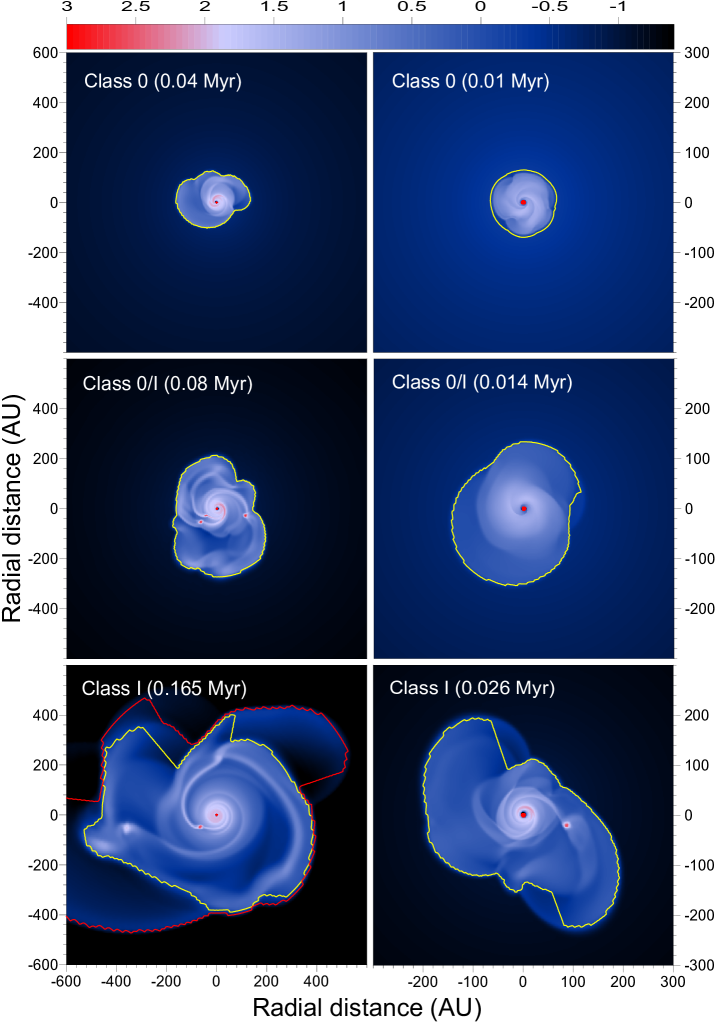
Figure 2 shows the gas surface density distribution in model 1 (left column) and model 2 (right column) in the Class 0, Class 0/I, and Class I timesteps considered in this paper (see §3 for details). For both models, only the inner several hundred AU are shown; the full computational area is approximately 10 times larger. The yellow lines outline the disc in each stage as identified using the algorithm described in Dunham & Vorobyov (2012), which is based on a critical surface density for the disc-to-envelope transition of g cm-2. We found that this algorithm works well in the Class 0/I stage, but may somewhat overestimate the disc mass in the Class 0 stage (when the inner part of the infalling envelope may have densities exceeding ) and somewhat underestimate the disc mass in the Class I stage (when the disc spreads out and its density drops below in the outer parts). For instance, a lower value of g cm-2 would result in larger disk sizes, as illustrated by the red curve in the bottom-left panel of Figure 2. However, the net increase in the disc mass is only , owing to a rather low density at the disc periphery.
2.2 Radiative Transfer Calculations
We couple the simulations described above with radiative transfer models to calculate the time evolution of the SEDs of cores collapsing according to the predictions of the simulations, as well as images and interferometer visibilities at all wavelengths. The coupling between the simulations and radiative transfer models was first described by Dunham & Vorobyov (2012). We give a brief overview here but refer to Dunham & Vorobyov (2012) for more details. Since the simulations do not provide the full volume density structure, in order to set up the physical structure of the radiative transfer models we take analytic profiles for the core and disc density structure and re-scale them at each timestep according to known parameters from the simulations (see §5.1 for a discussion of the limitations of this approach and prospects for future improvements). These parameters include the initial core mass () and radius (), along with the time evolution of the core mass, disc mass (), protostellar mass (), disc outer radius (), accretion rate onto the protostar (), and accretion rate onto the disc ().
For the core, we adopt the density profile given by the Terebey, Shu & Cassen (1984) solution for the collapse of a slowly rotating core. This solution gives a core that is initially a spherically symmetric, singular isothermal sphere with a density distribution , identical to the classic Shu (1977) solution. As collapse proceeds, the solution takes on two forms: an outer solution that is similar to the non-rotating, spherically symmetric solution and an inner solution that exhibits flattening of the density profile. This model is parameterized by the initial angular velocity of the core and the time since the formation of the protostar. At each timestep we truncate the solution at the given initial for each model and then renormalize the density profile so that the core mass matches that given by the simulations. Once the material at the outer core boundary beings collapsing, which occurs once the infall radius111The infall radius is the radius within which the core is collapsing. It starts at the center and moves outward at the sound speed. exceeds the initial outer radius, we use the velocity profiles given by the Terebey, Shu & Cassen (1984) solution to allow the core radius to decrease.
The disc structure follows a power law in the radial coordinate and a Gaussian in the vertical coordinate, with the density profile given by:
| (6) |
where is the distance above the midplane (, with and the usual radial and zenith angle spherical coordinates), is the distance in the midplane from the origin (), and is the density at the reference midplane distance . The quantity is the disc scale height and is given by , where is the scale height at . The parameter describes how the scale height changes with and sets the flaring of the disc. We set AU at AU and (see Dunham et al. (2010) and references therein for a more detailed discussion of these quantities), giving flared discs very similar to those found in the hydrodynamical simulations (see Figure 11 of Vorobyov & Basu (2010b)). The disc surface density profile, calculated by integrating Equation 6 over the vertical coordinate , has a radial power-law index of , where . Unlike our previous work (Dunham et al., 2010) where we set to a fixed value, here we determine by fitting a power-law to the azimuthally-averaged surface density profile given by the simulations, and use this to set ( for the Class 0 and I evolutionary stages of model 1, respectively, and for the Class 0 and I evolutionary stages of model 2, respectively). Finally, the disc inner radius is set equal to the dust destruction radius, calculated (assuming spherical, blackbody dust grains) as
| (7) |
where is the protostellar luminosity (see below) and is the dust destruction temperature (assumed to be 1500 K; e.g., Cieza et al., 2005).
The total internal luminosity of the protostar and disc at each point in the collapse from core to star contains six components: (1) luminosity arising from accretion from the core directly onto the protostar, (2) luminosity arising from accretion from the core onto the disc, (3) luminosity arising from accretion from the disc onto the protostar, (4) disc “mixing luminosity” arising from luminosity released when newly accreted material mixes with existing disc material, (5) luminosity arising from the release of energy stored in differential rotation of the protostar, and (6) photosphere luminosity arising from gravitational contraction and deuterium burning. The first five components are calculated following Adams & Shu (1986), using direct inputs from the simulations for the accretion rates, masses, and sizes of the protostar, disc, and core (further details can be found in Young & Evans (2005), Dunham et al. (2010), and Dunham & Vorobyov (2012)). The photospheric luminosity and protostellar radius are calculated from the stellar evolution code of Baraffe & Chabrier (2010) coupled to the main numerical hydrodynamic code (see Vorobyov et al. (2013) for details). While the total amount of accretion luminosity is correct, we do not include viscous disc heating since the radiative transfer code can only incorporate heating due to one central, internal source of photons and an external radiation field. Viscous heating is only significant within the inner AU of protostellar discs, and even in those locations it only increases the disc temperatures by much less than a factor of two (see, e.g., Figure 4 of Vorobyov (2010)). Since the discs we consider are 100 AU or larger, even at the earliest times (see right panels of Figure 1), small deviations to warmer temperatures in the inner discs than calculated from our radiative transfer models will have a negligible impact on our results.
Finally, we also include external luminosity arising from heating of the core by the Interstellar Radiation Field (ISRF). As in our previous papers, we adopt the Black (1994) ISRF, modified in the ultraviolet to reproduce the Draine (1978) ISRF, and then extincted by of dust with properties given by Draine & Lee (1984) to simulate extinction by the surrounding lower density environment.
3 Results
The two largest surveys of protostellar discs to date, and the only two surveys to include Class 0 protostars, are those presented by Jørgensen et al. (2009) and Enoch et al. (2011). Both studies were based on measuring the total 1.1 or 1.3 mm interferometric amplitude at baselines of 50 k for protostellar sources at distances ranging from 125 to 415 pc. At these distances, emission on baselines of 50 k corresonds to spatial scales of approximately AU, and the basic assumption made is that this emission has completely resolved out the surrounding core but not yet begun to resolve out the disc. Under this assumption, and further assuming that the observed emission is from optically thin, isothermal dust at a temperature of 30 K, disc masses can then be calculated assuming a standard gas-to-dust ratio of 100. A number of open questions surrounding these assumptions must be answered before any general conclusions can be drawn about the formation and early evolution of protostellar discs, including:
-
1.
Is it true that the total amplitude measured at baselines of 50 k is free of contamination from the surrounding core and recovers the total emission from the disc, and how do these answers depend on the distance to the source?
-
2.
Is it valid to assume that the (sub)millimeter emission is optically thin, or is mass missed due to optically thick emission?
-
3.
Is 30 K the best temperature to assume?
-
4.
How do the answers to all of these questions depend on the source inclination and the wavelength of the observations?
While Jørgensen et al. (2009) partially addressed the first question by attempting to estimate and remove contaminating emission from the surrounding core, it is unclear how accurate their corrections are since they used simple, one-dimensional models to derive them. To answer these questions, we take each of the models listed in Table 1 and, for source distances ranging from 100 pc to 500 pc in steps of 50 pc, calculate the complex interferometer visibilities at four wavelengths: 3.4 mm, 1.3 mm, 0.7 mm (700 m), and 0.35 mm (350 m) (approximately 90, 230, 430, and 850 GHz, respectively). The visibilities are calculated using an accompanying routine in the RADMC package and are generated assuming the Atacama Large Millimeter Array (ALMA) primary beam at each of the wavelengths listed above, for nine inclinations ranging from 5∘ to 85∘ in steps of 5∘. The contributions to the visibility amplitudes from the core and disc are calculated separately by coupling the hydrodynamic simulations with the radiative transfer models a second time with the disc mass set to zero, generating a set of core-only visibilities, and then subtracting their amplitudes from the combined core+disc amplitudes to generate a set of disc-only amplitudes. We consider three timesteps for each model: one early in the Class 0 stage when only 25% of the initial core mass has accreted onto the protostar and/or disc, one at the Class 0/I boundary when 50% of the initial core mass has accreted onto the protostar and/or disc, and one late in the Class I stage when 75% of the initial core mass has accreted onto the protostar and/or disc. While we caution that there is not always a one-to-one correspondence between observational Class and physical Stage due to the effects of geometry and episodic accretion (e.g., Dunham et al., 2014), for simplicity here we use the term Class to refer to both. In the following subsections we use these synthetic observations to answer the questions listed above.
3.1 Contamination From the Surrounding Core
To evaluate whether or not the total amplitude measured at a baseline of 50 k is free of contamination from the surrounding core and truly represents emission from only the disc, we define the quantity as the ratio of the amplitude at 50 k in the disc-only visibilities to the amplitude at 50 k in the combined (core+disc) visibilities. Figure 3 plots versus distance to the source for each timestep of each model for each of the four wavelengths considered in this paper, at an inclination angle of 45∘. For model 1, which has a relatively massive disc, there is almost no contamination from the core. Even during the Class 0 stage when the core still contains the majority of the system mass, at the largest distances where the core is the least well-resolved, at most only 20% of the amplitude measured at 50 k arises from the core.

As seen in Figure 3, the contamination level is somewhat higher for model 2, which is not surprising given that this model forms a less massive disc. During the Class 0 stage, between 10% – 60% of the observed amplitude at 50 k arises from the surrounding core, with the highest contamination levels occuring for submillimeter observations of sources at the largest distances. At the Class 0/I boundary the contamination levels are lower, in the range of 0% – 35%, and they are even lower in the Class I stage, ranging between 0% and 20%. These results for both models do not show any significant dependence on inclination angle.
Overall, we find that the surrounding core does not significantly contaminate the visibility amplitudes at 50 k. For cores that form relatively massive discs the contamination is almost completely negligible for all but the earliest times and largest source distances, where it can reach up to 20%. For cores that form less massive discs, up to 60% of the amplitude may actually arise from the core rather than the disc for Class 0 sources at distances of 400 – 500 pc observed at submillimeter wavelengths. For any combination of closer distances, more evolved sources, and longer wavelength observations the contamination is less. These results are in general agreement with those of Jørgensen et al. (2009), who used simple, one-dimensional models to estimate that cores contribute about 10% – 30% of the observed interferometer amplitudes at 50 k.
3.2 Resolving Out the Disc
Depending on both the size of the disc and the distance to the source, the interferometer amplitudes at 50 k may not trace the full mass of the disc if the disc is partially resolved. Indeed, Enoch et al. (2011) noted that, due to the disc being partially resolved out at 50 k, the inferred disc mass for one source in their sample was 30% lower than the mass obtained from detailed radiative transfer modeling performed in an earlier study (Enoch et al., 2009). Since the Vorobyov & Basu (2010b) simulations form relatively large, massive discs, we evaluate here whether disc masses calculated from the amplitues at 50 k are underestimated due to the discs being partially resolved out. For each timestep of each model we define the quantity as the ratio of amplitudes in the disc-only model at 50 k to that at 0 k. In this sense measures the fraction of total disc flux recovered at 50 k.

Figure 4 plots versus distance to the source for each timestep of each model for each of the four wavelengths considered in this paper, at an inclination angle of 45∘ (the choice of inclination angle is not found to have any significant effect on the results). In the Class 0 stage the amplitudes at 50 k do recover essentially all of the disc emission except for sources closer than 200 pc, where up to 20% of the emission is resolved out in models with larger and more massive discs. However, as the disc grows larger at later evolutionary stages, more of the disc emission is resolved out. For model 2, the disc remains small enough such that essentially no emission is resolved out for source distances greater than 200 pc; for closer sources, up to 20% is resolved out at the Class 0/I boundary, and up to 30% late in the Class I stage. For model 1, on the other hand, the disc becomes partially resolved out for all but the largest source distances. Up to 50% of the total disc emission is resolved out at the Class 0/I boundary for observations at 3.4 and 1.3 mm (and even more at submillimeter wavelengths), and up to 60% late in the Class I stage (again, even more at submillimeter wavelengths).
Combining the results of the last two sections, interferometer amplitudes at 50 k will overestimate the emission from a disc by up to about a factor of two in the worst cases due to contaminating emission from the surrounding core. On the other hand, they will also underestimate the emission from a disc by a similar factor due to partially resolving out the disc, as long as the observations are obtained at millimeter wavelengths. For large enough samples of objects over different ranges of source distances and intrinsic disc properties, these effects will at least partially cancel each other out. For observations obtained at submillimeter wavelengths, however, up to 80% of the disc emission can be resolved out, and as this effect is larger than the contamination from the surrounding core, submillimeter observations used to measure disc masses in this manner will systematically underestimate the true masses.
3.3 Optical Depth, Temperature, and Inclination
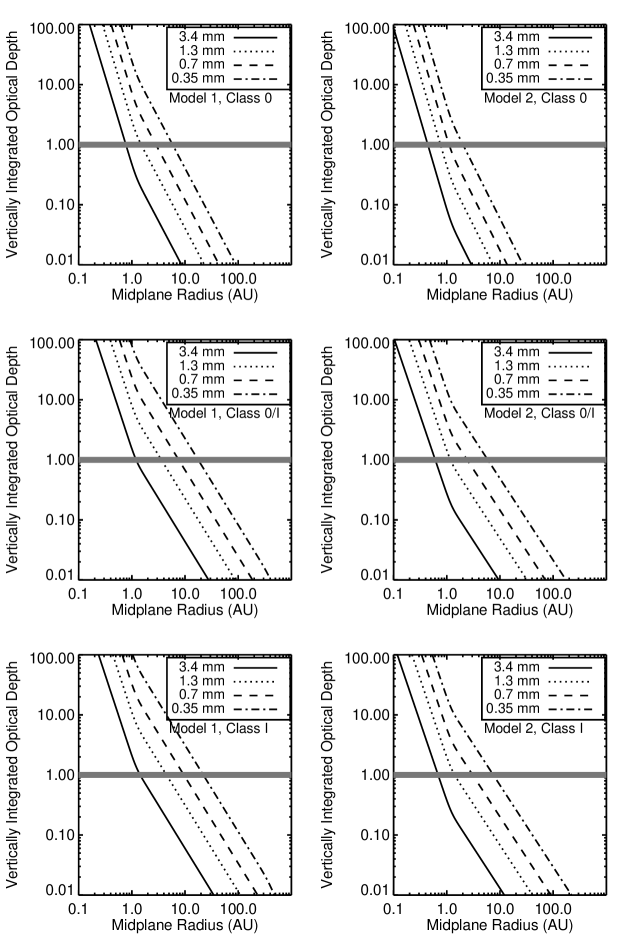
In this section we evaluate the effects of optical depth, temperature, and inclination on our ability to recover the actual disc masses from our synthetic observations. The observed disc emission will only trace the total mass of the disc if the emission remains optically thin throughout the full vertical and radial extent of the disc. This condition is known to be false in older Class II discs where the inner regions are often optically thick (e.g., Andrews & Williams, 2005). To evaluate whether the protostellar discs predicted by the Vorobyov & Basu (2010b) simulations are also partially optically thick, Figure 5 plots, for each wavelength considered in this paper, the vertically integrated optical depth through the disc for each timestep of each model as a function of the midplane radial distance. For self-consistency the optical depths are calculated using OH5 dust opacities, since these opacities were used in the radiative transfer models to generate the synthetic observations.
The vertically integrated optical depth at a fixed midplane radial distance increases with decreasing wavelength, as expected given that the opacities also increase with decreasing wavelength. In all cases, the discs are not optically thin all the way down to the midplane for all radii. For model 1, the disc emission becomes optically thin beyond a few AU for the millimeter wavelengths but only beyond ten to a few tens of AU for the submillimeter wavelengths. For model 2, which forms a smaller, less massive disc that is consequently less optically thick, the disc is generally optically thin beyond a few AU except for the shortest wavelengths and latest evolutionary stages, where it is only optically thin beyond about 10 AU. These results demonstrate that the discs formed by the Vorobyov & Basu (2010b) simulations are not fully optically thin, in agreement with other numerical studies (see e.g. Rice, Mayo & Armitage (2010)). However, they are not optically thick enough to cause large mass underestimates. For a disc with a surface density profile , the mass contained within the midplane radius is . At each timestep the disc size (Figure 1), the power-law index (see §2.2), and the midplane radius where the emission transitions to optically thin (Figure 5) can be combined to calculate the fraction of total mass contained within the optically thick region of the disk. For the shortest, most optically thick wavelength considered here (0.35 mm), we calculate this fraction to be 41%, 23%, and 20% for the Class 0, 0/I, and I timesteps of model 1, respectively, and 45%, 14%, and 14% for model 2. Thus the total disc mass underestimates due to optically thick emission are less than a factor of two even at the shortest submillimeter wavelengths (except for edge-on lines-of-sight; see below).
With these results in mind, we calculate, at each wavelength, the total disc mass inferred from the synthetic interferometer amplitude at 50 k for each timestep of each model. The mass is given by
| (8) |
where is the interferometer amplitude at 50 k, is the Planck function at the assumed isothermal dust temperature K, is the dust opacity, is the distance to the source, and the factor of 100 is the assumed gas-to-dust ratio. We again adopt the OH5 dust opacities for self-consistency with the radiative transfer models (see §3.4 for discussion of the opacities), and use the synthetic interferometer visibilities calculated for a source distance of 250 pc.
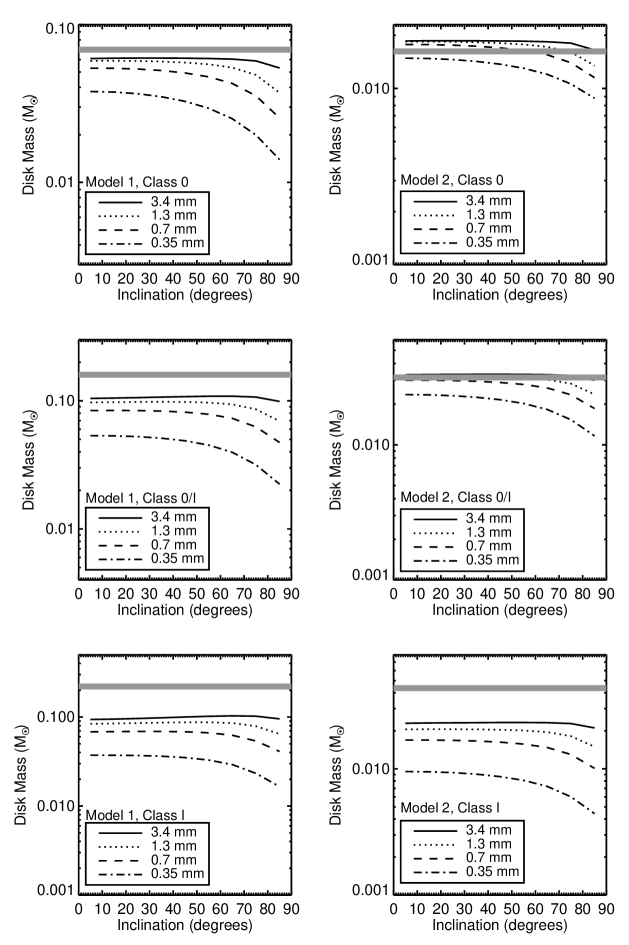

Figure 6 plots the resulting disc masses calculated at each wavelength as a function of inclination, and Figure 7 plots the ratio of actual to calculated disc masses, again as a function of inclination. In both Figures, the calculated disc masses are seen to converge toward a single value for all inclinations less than 60∘ as the wavelength increases. The increasing underestimates in disc mass at progressively shorter wavelengths is due to a combination of two factors: (1) the emission is progressively more optically thick, and (2) the emission is progressively farther from the Rayleigh-Jeans limit, thus temperature overestimates cause progressively larger disc mass underestimates. The importance of the latter factor is emphasized since we have already shown that the underestimates due to optically thick emission are less than a factor of two even at the shortest wavelengths.
In four of the six panels the masses calculated from the longest, most optically thin wavelengths converge to lower masses than the actual disc masses. These underestimates grow more significant with later evolutionary stages, reaching up to factors of two late in the Class I stage, and are due to the fact that the assumed isothermal temperature of 30 K is often too high. As the discs are not truly isothermal, the correct temperature to assume in Equation 8 is the mass-weighted average temperature of the optically thin portions of the disc. Table 2 lists these temperatures for each timestep of each model. The temperatures decrease as the evolutionary stages increase, since as the disc evolves it grows in mass and size and is optically thick to larger radii (see Figure 5), leading to more shielding of the optically thin regions. Consequently, masses calculated assuming K lead to progressively larger underestimates as evolutionary stage increases. A similar trend of decreasing disc temperatures leading to increasing mass underestimates with evolutionary stage was also noted by Jørgensen et al. (2009). The small overestimate (less than 20%) in the disc mass for the Class 0 stage of model 2 is due to the temperature being slightly above the assumed 30 K (35 K, see Table 2).
| Temperature | ||
| Model | Evolutionary Stage | (K) |
| 1 | 0 | 27 |
| 1 | 0/I | 20 |
| 1 | I | 15 |
| 2 | 0 | 35 |
| 2 | 0/I | 32 |
| 2 | I | 17 |
Assuming a random distribution of source orientations on the sky, 50% of all sources will be viewed at inclinations of 60∘ or greater. For such sources, the lines-of-sight will pass partially or fully through the disc midplane where the densities (and thus optical depths) are the largest. As illustrated by Figures 6 and 7, the disc mass underestimates due to the combination of optically thick emission and incorrect isothermal dust temperatures for sources with inclinations greater than 60∘ are generally less than 50% for observations at millimeter wavelengths, but can reach up to factors of 5–10 or larger for submillimeter wavelengths.
3.4 Dust Opacity Law
As noted above, the radiative transfer models used to generate the synthetic interferometer visibilities assumed the OH5 dust opacity law, so to be self-consistent we also adopted the OH5 dust opacities when calculating disc masses according to Equation 8. Defining as the power-law index of the dust opacity law (, where is the dust opacity at frequency ), optically thin emission will scale as , where is the spectral index and is given by . For OH5 dust, over all submillimeter and millimeter wavelengths, implying that the emission should have a spectral index of 3.75. However, numerous recent observational studies of protostars have found over a variety of spatial scales (e.g., Kwon et al., 2009; Melis et al., 2011; Shirley et al., 2011; AMI Consortium et al., 2012; Chiang, Looney & Tobin, 2012; Tobin et al., 2013). In an extreme example, Tobin et al. (2013) measured between 3.4 and 0.87 mm over baselines ranging from 10 – 500 k, implying a flat dust opacity law ().
There are two ways to lower the spectral index: partially optically thick emission and grain growth. It is well-established that dust grains can quickly grow to millimeter sizes or larger in Class II discs (older discs than those considered in this study), and that such growth can change the opacity law by decreasing (see Testi et al., 2014, for a recent review). Whether or not grains have grown sufficiently large to change the opacity law in protostellar discs remains an open question. Since we have already shown that the discs in these models are partially optically thick, especially at shorter wavelengths, we first evaluate whether optical depth alone can explain these recent results of in observations of protostars. Figure 8 plots the spectral index, , calculated from each wavelength pair, for each timestep of each model, as a function of baseline distance. Since grain growth is not an option in models with a fixed dust opacity law, and over all submillimeter and millimeter wavelengths for OH5 dust opacities, any deviations from are due to optical depth effects. We find that is lower when calculated from shorter wavelengths that are more optically thick, and is less than 3.75 even when calculated only from millimeter wavelengths. Similar results are found when three or four wavelengths are used to calculate , as long as the first and last wavelengths remain the same. While these results do suggest that optical depth lowers the observed , the Tobin et al. (2013) results are most comparable to our results for calculated from 3.4 and 0.7 mm, and since we find at these wavelengths, optical depth effects alone are unable to explain their results. Furthermore, while the source studied by Tobin et al. (2013) is at a nearly edge-on inclination and our results are presented for an inclination of 45∘, we find qualitatively similar results even for an inclination as high as 85∘ in that the observed is generally larger than two.

If grains have grown to larger sizes in discs, as suggested by combining our results with the observational studies cited above (see also the discussion in Tobin et al., 2013), the opacity law will flatten. This will generally lead to smaller dust opacities at submillimeter wavelengths and larger dust opacities at millimeter wavelengths. To give a specific example, the dust opacity law of Ricci et al. (2010), which includes grains that have grown up to 1 mm, predicts and cm2 g-1 at 850 m. This opacity law is within a factor of 1.3 of that predicted by the OH5 dust opacity law at 850 m (1.89 cm2 g-1), but leads to opacities that are a factor of 3 smaller at 350 m and factors of 2.5 and 10.5 larger at 1.3 and 3.4 mm, respectively. If the Ricci et al. (2010) opacity law represented the true opacity law in the disc, but the OH5 dust opacities were erroneously adopted to calculate disc masses, the resulting masses would underestimate the true disc masses at the shortest wavelengths but overestimate them at the longest wavelengths. Future work must concentrate on determining whether the Tobin et al. (2013) result of a very low spectral index for L1527 is an anomaly or the norm for protostars, and use these results to set detailed constraints on the opacity law for dust in protostellar discs.
4 Discussion
4.1 Reliability of Protostellar Disc Mass Measurements
| Intrinsic | Synthetic | Mean Intrinsic/Synthetic | ||||
|---|---|---|---|---|---|---|
| Mean Disc Mass | Wavelength | Class 0 Tdust | Class I Tdust | Mean Disk Mass | Disc Mass | |
| Model | (M⊙) | (mm) | (K) | (K) | (M⊙) | (M⊙) |
| 1 | 0.175 | 0.35 | 30 | 30 | 0.028 | 6.3 |
| 0.7 | 30 | 30 | 0.057 | 3.1 | ||
| 1.3 | 30 | 30 | 0.069 | 2.5 | ||
| 3.4 | 30 | 30 | 0.091 | 1.9 | ||
| 2 | 0.032 | 0.35 | 30 | 30 | 0.009 | 3.6 |
| 0.7 | 30 | 30 | 0.014 | 2.3 | ||
| 1.3 | 30 | 30 | 0.017 | 1.9 | ||
| 3.4 | 30 | 30 | 0.021 | 1.5 | ||
| 1 | 0.175 | 0.35 | 30 | 15 | 0.119 | 1.5 |
| 0.7 | 30 | 15 | 0.144 | 1.2 | ||
| 1.3 | 30 | 15 | 0.160 | 1.1 | ||
| 3.4 | 30 | 15 | 0.179 | 1.0 | ||
| 2 | 0.032 | 0.35 | 30 | 15 | 0.031 | 1.0 |
| 0.7 | 30 | 15 | 0.035 | 0.9 | ||
| 1.3 | 30 | 15 | 0.038 | 0.8 | ||
| 3.4 | 30 | 15 | 0.043 | 0.7 |
To summarize the above sections, we find that, on average, the competing effects of contamination from the surrounding core and partially resolving the disc will tend to cancel each other at millimeter wavelengths but lead to underestimates at submillimeter wavelengths, by up to factors of 4 in the worst cases. Optically thick emission, colder dust temperatures than the assumed K, and the effects of inclination can lead to underestimates by up to factors of at millimeter wavelengths and up to an order of magnitude or larger at submillimeter wavelengths, especially 350 m. Finally, flatter dust opacity laws than the assumed OH5 opacity law, as implied by recent observations, will cause further disc mass underestimates at the shortest submillimeter wavelengths and overestimates at the longest millimeter wavelengths, with the exact magnitude dependent on the details of the intrinsic dust opacity law.
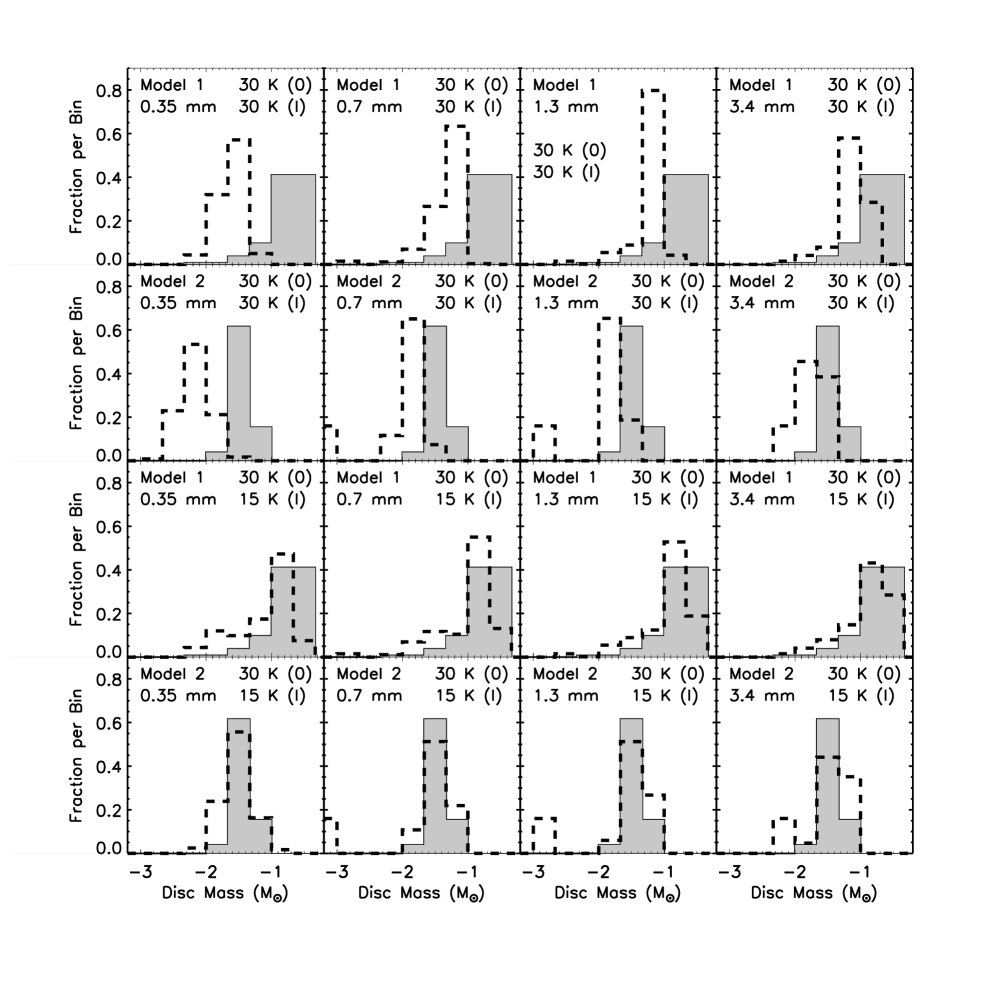
In order to understand the net sum of all of these effects (except for grain growth, which we are unable to evaluate with our fixed dust opacity law), Figure 9 plots various intrinsic and synthetic disc mass distributions for each model. The intrinsic distributions are taken directly from the simulation data and represent the true disc mass distribution over each model run; thus they are the same in each panel for a given model. The synthetic distributions are assembled by calculating, for each wavelength and each inclination, the disc mass throughout the full evolution of the model (in 2000 yr timesteps) from the synthetic interferometer amplitude at 50 k, assuming optically thin, isothermal emission according to Equation 8. The contribution of each inclination to the final distribution for each wavelength of each model is weighted by solid angle (see Dunham et al. (2010) for details). In the top two rows the assumed isothermal dust temperature is 30 K for all timesteps, whereas in the bottom two rows it is 30 K for timesteps in the Class 0 evolutionary stage and 15 K for timesteps in the Class I evolutionary stage. The mean of each distribution is listed in Table 3.
When the isothermal is held fixed at 30 K independent of evolutionary stage, the calculated disc mass distributions are clearly lower limits to the intrinsic distributions, with mean values lower by factors of depending on wavelength and model. However, when two values of are adopted, 30 K for Class 0 sources and 15 K for Class I sources, the calculated distributions are much more representative of the intrinsic distributions (mean values within 50%).
4.2 Existence of Fragmenting Protostellar Discs
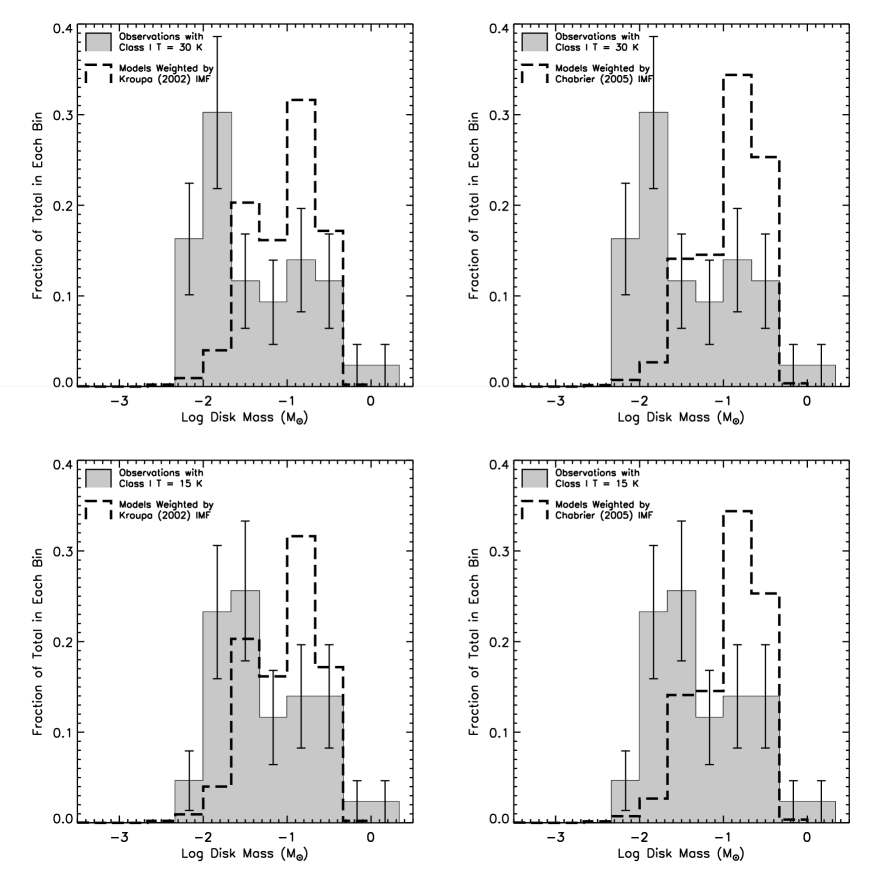
Given the results presented in this paper, what constraints on protostellar disc masses can be set by existing surveys? Figure 10 plots the combined distribution of protostellar disc masses from Jørgensen et al. (2009), Enoch et al. (2011), and Eisner (2012), all of which are based on observations at 1.1 or 1.3 mm. In the top two panels, disc masses were taken directly from the first two surveys, who used the method evaluated here with a fixed of 30 K, and were calculated from the Eisner (2012) survey based on their reported visibility amplitudes for each source, again assuming a fixed of 30 K. We note that these calculated disc masses generally agree to within a factor of two with masses derived by Eisner (2012) based on radiative transfer modeling of each source, which we take to be excellent agreement considering they fit to a relatively coarsely sampled model grid. In the bottom two panels, the disc masses from all three surveys are recalculated assuming K for Class 0 sources and K for Class I sources. Altogether, 43 disc mass measurements are plotted; an additional four non-detections in the combined sample are not shown in Figure 10. The observed distribution of protostellar disc masses spans more than two orders of magnitude, from less than 10-2 M⊙ to greater than 1 M⊙, with a peak slightly above 10-2 M⊙ (although, as demonstrated by the error bars in Figure 10, the shape of this distribution is still quite uncertain due to small-number statistics).
Figure 10 also plots the distribution of protostellar disc masses predicted by the Vorobyov & Basu (2010b) simulations, which often form discs that are sufficiently massive to fragment and drive short-lived accretion bursts from the disc onto the protostar. This distribution is calculated as the fraction of total time spent at each disc mass for an ensemble of 23 simulation runs spanning a large range of initial core masses and angular momenta (see Table 1 of Dunham & Vorobyov (2012) for a full list). The contribution of each simulation to the total distribution is weighted by either the Kroupa (2002, left) or Chabrier (2005, right) stellar initial mass function (IMF) based on the final mass of the star formed in each simulation (see Dunham & Vorobyov (2012) for details of this weighting).
Comparing the two distributions in the top panels reveals that the relatively massive discs predicted by the Vorobyov & Basu (2010b) non-magnetic hydrodynamical simulations are observed in approximately 50% of all protostars. However, since the observed disc mass distribution in these panels was assembled a fixed K, our results from §4.1 imply that it is a lower limit to the intrinsic protostellar disc mass distribution. Comparing the two distributions in the bottom panels, where K for Class I sources and thus the observed distribution should closely match the intrinsic distribution, the discs predicted by the Vorobyov & Basu (2010b) simulations are observed in approximately 70% of all protostars. In both the top and bottom panels somewhat better agreement is found when the simulations are weighted by the Kroupa (2002) IMF, which gives increased weight to simulations that form lower-mass stars.
Based on these comparisons, and given that the Vorobyov & Basu (2010b) simulations are prone to form fragmenting discs, particularly when the disk mass exceeds 0.07 M⊙ (Vorobyov, 2013), we conclude that at least some protostellar discs are likely sufficiently massive to fragment. The fact that the observed and simulation disc mass distributions do not show perfect overlap (in particular, the observed distribution extends to lower masses) may be explained by magnetic braking acting to remove angular momentum and suppress disc formation in some cases. Additionally, we caution that the surveys published to date are generally biased toward massive and luminous protostars that are thus bright at (sub)millimeter wavelengths, and may not be representative of all embedded protostars. Larger, more representative surveys are needed to test these findings. We are currently working on assembling such samples, on including the effects of magnetic braking into the numerical models, and on searching for other observational signatures of fragmenting discs beyond their total masses, such as those predicted by Vorobyov, Zakhozhay & Dunham (2013), including direct detection of spiral structure and fragments and characteristic SED features.
4.3 Recommendations for Future Studies
Given the results presented in this paper, we make the following two recommendations for future studies that seek to use interferometer continuum observations of protostars to measure the protostellar disc mass distribution for larger samples than those considered to date:
-
1.
Observe at a wavelength of approximately 1 mm. Shorter wavelengths will be more optically thick and more prone to errors due to incorrect temperature assumptions (since they are farther outside of the Rayleigh-Jeans limit), and longer wavelengths will be more prone to disc mass overestimates due to larger opacities caused by grain growth.
-
2.
Adopt two different isothermal dust temperatures depending on the evolutionary stage of each protostar: 30 K for Class 0 protostars and 15 K for Class I protostars.
5 Limitations and Caveats
5.1 Physical Structure
While both the hydrodynamical simulations and radiative transfer calculations are performed using two-dimensional codes, they use different coordinate systems. In the hydrodynamical simulations, the thin-disc approximation is used to calculate the evolution of the gas surface density and velocity profiles as a function of cylindrical radius, , and azimuthal angle, , whereas the radiative transfer calculations assume axisymmetry to calculate the dust temperature distribution as a function of radius, , and zenith angle, , in spherical coordinates. As a result, the radiative transfer calculations are able to match the exact mass, radius, and azimuthally-averaged surface density profile of the disc but do not recover its axial structure, in particular spiral density waves and fragments.
As described in §2.2, we match the disc surface density profiles in the simulations and radiative transfer calculations by fitting a power-law to the azimuthally-averaged surface density profile predicted by the simulations. However, inspection of the simulations reveal that the profiles are generally better described by a broken power-law, with a much steeper index at large radii, than by a single power-law over the full extent of the disc. We included such a broken power-law in the radiative transfer calculations to test its effects but found that it had no significant effects on our results, since it changes slightly the distribution of mass within the disc but not the total mass recovered by the simulated observations.
However, we do acknowledge that there are limitations related to our inability to include the full, non-axisymmetric structure of the disc in our radiative transfer calculations. One such limitation is the effect of disc fragments. In the most extreme cases, the discs in the Vorobyov & Basu (2010b) simulations form fragments that contain up to 50% of the total mass of the disc. Such fragments will be extremely optically thick and thus essentially invisible to (sub)millimeter interferometric observations. Thus, in addition to the effects discussed in §3, hidden fragments will cause disc masses calculated from interferometer visibility amplitudes measured at 50 k to be further underestimated. The full magnitude of these underestimates can only be evaluated once the simulations are coupled to three-dimensional radiative transfer calculations that capture the full disc structure; we are currently working on such models and will present the results in a forthcoming paper.
Another limitation is the effect that grain growth will have on the assumption that the gas and dust are well-coupled, which we adopt when using the gas surface density from the simulations to set the dust surface density profile in the radiative transfer calculations (as described in §2.2). If dust grains in protostellar discs have already grown to millimeter sizes, the dust surface density profile can deviate significantly from the gas due to preferential concentration of these large grains within density enhancements (such as fragments, clumps, and spiral arms; Rice et al., 2004; Boley & Durisen, 2010; Testi et al., 2014). Thus we again emphasize the critical need for future work devoted to understanding the dust properties in protostellar discs to go along with recent advances in our understanding of dust properties in older, more evolved (i.e., Class II) discs (see Testi et al., 2014, for a recent review). Such work requires high-angular resolution, high-sensitivity, multi-wavelength observations of embedded protostellar discs and should thus be viable in the coming years with ALMA and the upgraded Very Large Array (VLA).
5.2 Confirming Keplerian Rotation
Emission on baselines of 50 k corresponds to spatial scales of approximately AU for sources at distances ranging from pc, thus we must emphasize that such observations do not spatially resolve the discs. As discussed in §3.2, this is actually a strength as it allows this method to probe the total emission from the disc, but at the cost of assuming that the unresolved component does in fact arise from a rotationally supported, Keplerian disc. To test whether emission on 50 k baselines truly does imply the presence of a disc-like structure, we generated synthetic interferometric observations of an alternative version of model 1 with the disc removed and the core inner radius set to 1 AU rather than the outer radius of the disc, which is generally 100 AU or larger (see Figure 1). The resulting disc masses calculated from the amplitudes at 50 k for this model ranged from 5 M⊙ early in the Class 0 stage to less than M⊙ late in the Class I stage. As most observations performed to date suggest discs with masses greater than M⊙ (see Figure 10), even cores with such extreme inner radii have a negligible effect on the observed disc mass distribution derived assuming all emission on 50 k baselines arises from discs. These results are in general agreement with those of Jørgensen et al. (2009), who also found that cores do not contribute significantly to the total emission at 50 k, even in cases where the inner radii are as small as 25 AU. They are also in agreement with earlier work that arrived at similar conclusions using much simpler models (e.g., Terebey, Chandler & Andre, 1993). Non-magnetized cores simply do not contain enough mass on the small spatial scales probed by 50 k baselines.
While these results demonstrate that the structures probed by interferometer observations at baselines of 50 k can not be explained as simply the inner, dense parts of cores, they still do not prove that the structures are due to rotationally supported, Keplerian discs. Magnetically supported “pseudodiscs” form on size scales of a few hundred to a few thousand AU in magnetized cores (e.g., Galli & Shu, 1993; Chiang et al., 2008), and unresolved continuum observations are unable to distinguish between the two types of objects. We emphasize that the observed disc mass distribution assembled using the methods investigated in this study must be confirmed with detections of Keplerian rotation signatures in molecular line observations. While such observations are now possible (e.g., Jørgensen et al., 2009; Tobin et al., 2012; Murillo et al., 2013; Yen et al., 2013; Harsono et al., 2014), they push existing facilities such as the Submillimeter Array (SMA), Combined Array for Research in Millimeter-wave Astronomy (CARMA), and Plateau de Bure Interferometer (PdBI) to their limits and are only possible for the brightest and most massive sources, especially in the Class 0 stage. However, they should become routine in the near future with the technical capabilities of ALMA and the Northern Extended Millimeter Array (NOEMA). Confirming Keplerian rotation and measuring the radii out to which such motions are detected is a high priority for future observations.
6 Summary
In this paper we have coupled hydrodynamical simulations of the collapse of dense, rotating cores into protostars with radiative transfer evolutionary models to generate synthetic observations as the simulations evolve. We have used this coupling to investigate the extent to which a simple method for measuring protostellar disc masses, namely the assumption that the (sub)millimeter interferometer amplitude measured at a baseline of 50 k arises from optically thin, 30 K thermal dust emission in the disc with no contamination from the surrounding core, recovers the intrinsic masses of the discs formed in the simulations. We summarize our main results as follows:
-
•
Overestimates due to contamination from the surrounding core and underestimates due to partially resolving out the disc tend to cancel each other at millimeter wavelengths but can lead to net underestimates by up to factors of 4 at submillimeter wavelengths.
-
•
Optically thick emission, colder dust temperatures than the assumed K, and the effects of inclination can lead to underestimates by up to factors of 2–3 at millimeter wavelengths and up to an order of magnitude or larger at submillimeter wavelengths, especially 350 m.
-
•
Flatter dust opacity laws due to grain growth will lead to further disc mass underestimates at the shortest submillimeter wavelengths and overestimates by up to factors of 10 or larger at the longest millimeter wavelengths (3 mm or longer), with the exact magnitude dependent on the details of the true opacity law in the disc.
-
•
The optically thin portions of protostellar discs are generally cooler in the Class I stage than the Class 0 stage since Class I discs are typically larger and more optically thick, and thus more shielded. Protostellar disc mass distributions assembled from observations where the dust temperature is fixed at 30 K independent of evolutionary stage will be lower limits to the intrinsic distributions, with mean values lower by factors of depending on wavelength and intrinsic disc properties. If temperatures of 30 K for Class 0 sources and 15 K for Class I sources are adopted, the observed distributions will be more representative of the intrinsic distributions, with mean values within 50%.
-
•
Comparing the observed disc mass distribution from three different surveys at 1 mm to that assembled from the Vorobyov & Basu (2010b) hydrodynamical simulations suggests that the disc masses predicted by the simulations are observed in approximatley 50% – 70% of all protostars. These results suggest that at least some protostellar discs are likely sufficiently massive to fragment, although larger samples are needed to further quantify this result.
-
•
We make the following two recommendations for future studies that seek to use interferometer continuum observations of protostars to measure the protostellar disc mass distribution:
-
1.
Observe at a wavelength of approximately 1 mm.
-
2.
Adopt a variable dust temperature of 30 K for Class 0 sources and 15 K for Class I sources.
-
1.
These results must be confirmed with larger, less biased observational samples. Additionally, this method is not capable of distinguishing between rotataionlly supported, Keplerian discs and magnetically supported “pseudodiscs”, thus future molecular line observations are critically needed to confirm Keplerian rotation in protostars found to have discs with the method investigated here. However, the current evidence does support the hypothesis that disc fragmentation may play a significant role in the early evolution of protostellar systems.
We thank the anonymous referee for comments and suggestions that have improved the quality of this work. This research has made use of NASA’s Astrophysics Data System (ADS) Abstract Service and the IDL Astronomy Library hosted by the NASA Goddard Space Flight Center. MMD acknowledges support from the Submillimeter Array through an SMA postdoctoral fellow. The simulations were performed on the Shared Hierarchical Academic Research Computing Network (SHARCNET), on the Atlantic Computational Excellence Network (ACEnet), and on the Vienna Scientific Cluster (VSC-2). This project was partly supported by the Russian Ministry of Education and Science Grant (state assignment) 3.961.2014/K. HGA acknowledges support from the NSF through grant AST-0845619.
References
- Adams & Shu (1986) Adams F. C., Shu F. H., 1986, ApJ, 308, 836
- Allen, Li & Shu (2003) Allen A., Li Z.-Y., Shu F. H., 2003, ApJ, 599, 363
- AMI Consortium et al. (2012) AMI Consortium et al., 2012, MNRAS, 420, 3334
- Andrews & Williams (2005) Andrews S. M., Williams J. P., 2005, ApJ, 631, 1134
- Baraffe & Chabrier (2010) Baraffe I., Chabrier G., 2010, A&A, 521, 44
- Basu (1997) Basu S., 1997, ApJ, 485, 240
- Basu & Vorobyov (2012) Basu S., Vorobyov E. I., 2012, ApJ, 750, 30
- Black (1994) Black J. H., 1994, in Astronomical Society of the Pacific Conference Series, Vol. 58, The First Symposium on the Infrared Cirrus and Diffuse Interstellar Clouds, Cutri R. M., Latter W. B., eds., p. 355
- Boley & Durisen (2010) Boley A. C., Durisen R. H., 2010, ApJ, 724, 618
- Chabrier (2005) Chabrier G., 2005, in Astrophysics and Space Science Library, Vol. 327, The Initial Mass Function 50 Years Later, Corbelli E., Palla F., Zinnecker H., eds., p. 41
- Chapman et al. (2013) Chapman N. L. et al., 2013, ApJ, 770, 151
- Chiang et al. (2008) Chiang H.-F., Looney L. W., Tassis K., Mundy L. G., Mouschovias T. C., 2008, ApJ, 680, 474
- Chiang, Looney & Tobin (2012) Chiang H.-F., Looney L. W., Tobin J. J., 2012, ApJ, 756, 168
- Cieza et al. (2005) Cieza L. A., Kessler-Silacci J. E., Jaffe D. T., Harvey P. M., Evans, II N. J., 2005, ApJ, 635, 422
- Dapp & Basu (2009) Dapp W. B., Basu S., 2009, MNRAS, 395, 1092
- Draine (1978) Draine B. T., 1978, ApJS, 36, 595
- Draine & Lee (1984) Draine B. T., Lee H. M., 1984, ApJ, 285, 89
- Dullemond & Dominik (2004) Dullemond C. P., Dominik C., 2004, A&A, 417, 159
- Dullemond & Turolla (2000) Dullemond C. P., Turolla R., 2000, A&A, 360, 1187
- Dunham et al. (2010) Dunham M. M., Evans, II N. J., Terebey S., Dullemond C. P., Young C. H., 2010, ApJ, 710, 470
- Dunham et al. (2014) Dunham M. M. et al., 2014, ArXiv e-prints
- Dunham & Vorobyov (2012) Dunham M. M., Vorobyov E. I., 2012, ApJ, 747, 52
- Eisner (2012) Eisner J. A., 2012, ApJ, 755, 23
- Enoch et al. (2011) Enoch M. L. et al., 2011, ApJS, 195, 21
- Enoch et al. (2009) Enoch M. L., Corder S., Dunham M. M., Duchêne G., 2009, ApJ, 707, 103
- Galli & Shu (1993) Galli D., Shu F. H., 1993, ApJ, 417, 243
- Harsono et al. (2014) Harsono D., Jørgensen J. K., van Dishoeck E. F., Hogerheijde M. R., Bruderer S., Persson M. V., Mottram J. C., 2014, A&A, 562, A77
- Harvey et al. (2003) Harvey D. W. A., Wilner D. J., Myers P. C., Tafalla M., 2003, ApJ, 596, 383
- Hennebelle & Teyssier (2008) Hennebelle P., Teyssier R., 2008, A&A, 477, 25
- Hull et al. (2013) Hull C. L. H. et al., 2013, ApJ, 768, 159
- Johnson & Gammie (2003) Johnson B. M., Gammie C. F., 2003, ApJ, 597, 131
- Joos, Hennebelle & Ciardi (2012) Joos M., Hennebelle P., Ciardi A., 2012, A&A, 543, A128
- Jørgensen et al. (2009) Jørgensen J. K., van Dishoeck E. F., Visser R., Bourke T. L., Wilner D. J., Lommen D., Hogerheijde M. R., Myers P. C., 2009, A&A, 507, 861
- Kenyon et al. (1994) Kenyon S. J., Gomez M., Marzke R. O., Hartmann L., 1994, AJ, 108, 251
- Kenyon & Hartmann (1995) Kenyon S. J., Hartmann L., 1995, ApJS, 101, 117
- Kenyon et al. (1990) Kenyon S. J., Hartmann L. W., Strom K. M., Strom S. E., 1990, AJ, 99, 869
- Kim et al. (2011) Kim H. J. et al., 2011, ApJ, 729, 84
- Kim et al. (2012) Kim H. J., Evans, II N. J., Dunham M. M., Lee J.-E., Pontoppidan K. M., 2012, ApJ, 758, 38
- Kroupa (2002) Kroupa P., 2002, Science, 295, 82
- Krumholz, Crutcher & Hull (2013) Krumholz M. R., Crutcher R. M., Hull C. L. H., 2013, ApJ, 767, L11
- Kwon et al. (2009) Kwon W., Looney L. W., Mundy L. G., Chiang H.-F., Kemball A. J., 2009, ApJ, 696, 841
- Lee (2007) Lee J.-E., 2007, Journal of Korean Astronomical Society, 40, 83
- Li, Krasnopolsky & Shang (2013) Li Z.-Y., Krasnopolsky R., Shang H., 2013, ApJ, 774, 82
- Lindberg et al. (2014) Lindberg J. E. et al., 2014, ArXiv e-prints
- Looney, Mundy & Welch (2003) Looney L. W., Mundy L. G., Welch W. J., 2003, ApJ, 592, 255
- Machida, Inutsuka & Matsumoto (2011) Machida M. N., Inutsuka S.-I., Matsumoto T., 2011, PASJ, 63, 555
- Machida, Inutsuka & Matsumoto (2014) Machida M. N., Inutsuka S.-i., Matsumoto T., 2014, MNRAS, 438, 2278
- Maury et al. (2010) Maury A. J. et al., 2010, A&A, 512, A40
- Melis et al. (2011) Melis C. et al., 2011, ApJ, 739, L7
- Mellon & Li (2008) Mellon R. R., Li Z.-Y., 2008, ApJ, 681, 1356
- Murillo & Lai (2013) Murillo N. M., Lai S.-P., 2013, ApJ, 764, L15
- Murillo et al. (2013) Murillo N. M., Lai S.-P., Bruderer S., Harsono D., van Dishoeck E. F., 2013, ArXiv e-prints
- Nayakshin (2010) Nayakshin S., 2010, MNRAS, 408, 36L
- Ossenkopf & Henning (1994) Ossenkopf V., Henning T., 1994, A&A, 291, 943
- Ricci et al. (2010) Ricci L., Testi L., Natta A., Neri R., Cabrit S., Herczeg G. J., 2010, A&A, 512, A15
- Rice et al. (2004) Rice W. K. M., Lodato G., Pringle J. E., Armitage P. J., Bonnell I. A., 2004, MNRAS, 355, 543
- Rice, Mayo & Armitage (2010) Rice W. K. M., Mayo J. H., Armitage P. J., 2010, MNRAS, 402, 1740
- Seifried et al. (2011) Seifried D., Banerjee R., Klessen R. S., Duffin D., Pudritz R. E., 2011, MNRAS, 417, 1054
- Seifried et al. (2012) Seifried D., Banerjee R., Pudritz R. E., Klessen R. S., 2012, MNRAS, 423, L40
- Shirley et al. (2011) Shirley Y. L., Mason B. S., Mangum J. G., Bolin D. E., Devlin M. J., Dicker S. R., Korngut P. M., 2011, AJ, 141, 39
- Shu (1977) Shu F. H., 1977, ApJ, 214, 488
- Terebey, Chandler & Andre (1993) Terebey S., Chandler C. J., Andre P., 1993, ApJ, 414, 759
- Terebey, Shu & Cassen (1984) Terebey S., Shu F. H., Cassen P., 1984, ApJ, 286, 529
- Testi et al. (2014) Testi L. et al., 2014, ArXiv e-prints
- Tobin et al. (2012) Tobin J. J., Hartmann L., Chiang H.-F., Wilner D. J., Looney L. W., Loinard L., Calvet N., D’Alessio P., 2012, Nature, 492, 83
- Tobin et al. (2013) Tobin J. J., Hartmann L., Chiang H.-F., Wilner D. J., Looney L. W., Loinard L., Calvet N., D’Alessio P., 2013, ApJ, 771, 48
- Visser & Bergin (2012) Visser R., Bergin E. A., 2012, ApJ, 754, L18
- Vorobyov (2010) Vorobyov E. I., 2010, ApJ, 723, 1294
- Vorobyov (2011) Vorobyov E. I., 2011, ApJ, 729, 146
- Vorobyov (2013) Vorobyov E. I., 2013, A&A, 552, 129
- Vorobyov et al. (2013) Vorobyov E. I., Baraffe I., Harries T., Chabrier G., 2013, A&A, 557, A35
- Vorobyov & Basu (2005) Vorobyov E. I., Basu S., 2005, ApJ, 633, L137
- Vorobyov & Basu (2006) Vorobyov E. I., Basu S., 2006, ApJ, 650, 956
- Vorobyov & Basu (2010a) Vorobyov E. I., Basu S., 2010a, ApJ, 714, L133
- Vorobyov & Basu (2010b) Vorobyov E. I., Basu S., 2010b, ApJ, 719, 1896
- Vorobyov, Zakhozhay & Dunham (2013) Vorobyov E. I., Zakhozhay O. V., Dunham M. M., 2013, MNRAS, 433, 3256
- Wyatt (2008) Wyatt M. C., 2008, ARA&A, 46, 339
- Yen et al. (2013) Yen H.-W., Takakuwa S., Ohashi N., Ho P. T. P., 2013, ApJ, 772, 22
- Young & Evans (2005) Young C. H., Evans, II N. J., 2005, ApJ, 627, 293
- Zapata et al. (2013) Zapata L. A., Loinard L., Rodríguez L. F., Hernández-Hernández V., Takahashi S., Trejo A., Parise B., 2013, ApJ, 764, L14