Seeing Red in M32: Constraints on the Stellar Content from Near and Mid-Infrared Observations and Applications for Studies of More Distant Galaxies 11affiliation: Based on observations obtained at the Gemini Observatory, which is operated by the Association of Universities for Research in Astronomy, Inc., under a cooperative agreement with the NSF on behalf of the Gemini partnership: the National Science Foundation (United States), the National Research Council (Canada), CONICYT (Chile), the Australian Research Council (Australia), Ministério da Ciência, Tecnologia e Inovação (Brazil) and Ministerio de Ciencia, Tecnología e Innovación Productiva (Argentina). 22affiliation: This research used the facilities of the Canadian Astronomy Data Centre operated by the National Research Council of Canada with the support of the Canadian Space Agency. 33affiliation: This research has made use of the NASA/IPAC Infrared Science Archive, which is operated by the Jet Propulsion Laboratory, California Institute of Technology, under contract with the National Aeronautics and Space Administration.
Abstract
The properties of asymptotic giant branch (AGB) stars in the Local Group galaxy M32 are investigated using ground and space-based observations that span the m wavelength interval, with the goal of demonstrating the utility of infrared observations as probes of stellar content. Comparisons with isochrones indicate that the brightest resolved stars in M32 have ages of a few Gyr, and are younger on average than AGB stars with the same intrinsic brightness in the outer disk of M31. Accounting for stellar variability is shown to be essential for modelling AGB luminosity functions (LFs). Model LFs that assume the star-forming history measured by Monachesi et al. (2012, ApJ, 745, 97) and the variability properties of Galactic AGB stars match both the and [5.8] LFs of M32. Models also suggest that the slope of the [5.8] LF between M and –10.0 is sensitive to the mix of stellar ages, and a sizeable fraction of the stars in M32 must have an age older than 7 Gyr in order to match the [5.8] LF. The structural properties of M32 in the infrared are also investigated. The effective radii that are computed from near-infrared and mid-infrared isophotes are similar to those measured at visible wavelengths, suggesting that the stellar content of M32 is well-mixed. However, isophotes at radii arcsec ( parcsecs) in the near and mid-infrared are flatter than those at visible wavelengths. The coefficient of the fourth-order cosine term in the fourier expansion of isophotes changes from ‘boxy’ values at arcsec to ‘disky’ values at arcsec in [3.6] and [4.5]. The mid-infrared colors near the center of M32 do not vary systematically with radius, providing evidence of a well-mixed stellar content in this part of the galaxy.
1 INTRODUCTION
1.1 Asymptotic Giant Branch Stars and M32
The observational properties of stars near the main sequence turn-off (MSTO) have a natural primacy in studies of the star-forming history (SFH) of galaxies. However, with the exception of stars that formed within the past few hundred Myr, crowding and the intrinsic faintness of the MSTO restrict its use to Local Group galaxies. Core helium-burning stars provide an alternate means of probing the stellar content of more distant systems (e.g. McQuinn et al. 2011), although these stars can only be resolved in relatively low surface brightness areas of galaxies in the nearest groups.
Stars evolving near the tip of the Asymptotic Giant Branch (AGB) are among the most luminous objects in a galaxy, and so offer another means of investigating stellar content. The stars on the upper few magnitudes of the AGB can have a wide range of ages, extending back Gyr for solar metallicities, and so have the potential to provide constraints on the SFH over a large fraction of the age of the Universe. The red colors of the most luminous AGB stars make them well-suited for study with adaptive optics (AO)-equipped ground-based telescopes, since the corrections delivered by AO systems improve towards longer wavelengths.
Because they are very bright and have colors that are much redder than the majority of other luminous stars in a galaxy, AGB stars will be resolved in the near and mid-infrared with future space-based facilites – such as the JWST – in systems that are well outside of the Local Group. Still, given their highly evolved nature, models of AGB stars can be uncertain (e.g. discussion by Marigo et al. 2008), and there has been mixed success matching observations with model predictions (e.g. Zibetti et al. 2013; Melbourne et al. 2012; Girardi et al. 2010). This has motivated recent efforts to characterize the behaviour of AGB stars in dwarf galaxies that span a broader range of metallicities than is sampled by the Magellanic Clouds and the Milky-Way, which have heretofore been the key calibrators of AGB properties (e.g. Rosenfield et al. 2014; Melbourne et al. 2010).
The Local Group compact elliptical (cE) galaxy M32 is a fundamental laboratory for probing AGB evolution and investigating the role that these stars play in stellar content studies. M32 is close enough to allow the MSTO stars that probe the early phases of its evolution to be resolved, so that its SFH can be probed in detail (e.g. Monachesi et al. 2012). At the same time, M32 is also far enough away and has a high enough stellar density that integrated spectra that are not subject to stochastic sampling effects can be recorded in its high surface brightness central regions. That a rich population of AGB stars in M32 can be resolved over a wide range of radii (e.g. Davidge & Jensen 2007) also means that the problems associated with low number statistics that plague studies of AGB stars in more diffuse and/or less massive systems are avoided.
The utility of M32 for testing techniques to probe stellar content has been amply demonstrated in the past. M32 has been the target of numerous spectroscopic studies, and these have revealed signatures of a substantial – possibly even dominant – population with an age of a few Gyr. Absorption lines originating from the Balmer series of Hydrogen – most noteably H (e.g. O’Connell 1980; Bica et al. 1990; Rose 1994; Schiavon et al. 2004) – and the first-overtone CO bands (Davidge 1990) have depths in the integrated spectrum of M32 that are indicative of a large intermediate age population. This has been confirmed by the subsequent study of resolved AGB (e.g. Davidge 2000; Davidge & Jensen 2007) and MSTO (Monachesi et al. 2012) stars. Spectroscopic studies also reveal a near solar luminosity-weighted metallicity. This is consistent with the metallicities of individual AGB stars in the central regions of M32 (Davidge et al. 2010) and the mean photometric properties of red giant branch (RGB) stars at large radii (Grillmair et al. 1996; Monachesi et al. 2012).
1.2 The Evolution of M32
The origins of M32 are enigmatic. While the structural characterics of M32 are reminiscent of a classical elliptical galaxy (e.g. Kormendy 1985), its near-solar metallicity is consistent with it being the remnant of what was once a much larger galaxy. In addition to having a relatively high mean metallicity for its mass, the location of M32 on the Fe Mg2 plane is indicative of a [Mg/Fe] that is lower than in most early-type galaxies (Worthey et al. 1992). This hints that SNe I played a significant role in the chemical enrichment of M32. This is not expected for spheroidal systems that experienced rapid chemical enrichment, but is associated with disks that are stable over time scales of at least a few hundred Myr.
M32 and M31 are in close physical proximity at present, with a projected separation of only a few kpc (e.g. Evans et al. 2000; Sarajedini et al. 2012). This raises the prospect of past interactions between them, and Bekki et al. (2001) suggest that M32 is the remnant of a disk-dominated galaxy that was threshed by tidal interactions with M31. If the progenitor of M32 was a disk galaxy then this could explain the chemical mixture of M32. The tidal threshing model could also explain other properties of M32, such as the lack of a globular cluster system, its low gas content (Sage et al. 1998; Grcevich & Putman 2009), and the uniform mixing of RR Lyraes with other stellar types (Sarajedini et al. 2012).
There may have been more recent encounters between M31 and M32. Block et al. (2006) argue that a satellite of M31 – presumably M32 – passed through the inner regions of its disk a few hundred Myr ago. Such an encounter is consistent with the complex dynamical state of the ISM near the center of M31 (e.g. Melchior & Combes 2011). Smith et al. (2012) find that the dust properties of the central few kpc of M31 may also have been affected by an interaction, and note that the dust mass within the central 3 kpc is comparable to that expected in a dwarf galaxy. The concentration of bright AGB stars along one arm of the M31 major axis (Davidge et al. 2012; Davidge 2012; Dalcanton et al. 2012) may also have formed during this event. A basic prediction of the Block et al. (2006) model is that the interaction with M32 triggered disturbances in the ISM of M31 that are propogating outwards, spurring star-formation as they go. The presence of such a propogating density wave is not consistent with the long-lived nature of the star-forming rings (Davidge et al. 2012; Dalcanton et al. 2012), and may have difficulties explaining related shell-like structures in the outermost regions of the disk (Fritz et al. 2012).
Monachesi et al. (2012) use deep images of the outer regions of M32 to resolve stars near the MSTO and examine the SFH. They conclude that M32 is not coeval. There is a dominant component that is older than 5 Gyr, and a significant population with an age 2 – 5 Gyr. The MSTO of the oldest stars is not detected, and so firm constraints can not be placed on the mass fraction that formed during very early epochs. A population of stars that is younger than 2 Gyr and accounts for a few percent of the total stellar mass was also detected. While MSTO stars are primary probes of stellar age, blue stragglers, and contamination from clusters of young stars in the outer disk of M31 add uncertainties to age estimates obtained from the MSTO, and may account for at least some fraction of this relatively young component.
1.3 The Present Study
Obtaining agreement between the SFHs deduced from AGB and MSTO stars in nearby galaxies is an important step if AGB stars are to be considered as probes of more distant systems. There are challenges inherent to detecting the most evolved AGB stars in the visible, even though this is a wavelength region that has been explored in detail and is where space-based facilities typically deliver their best angular resolution. The most evolved RGB and AGB stars with moderate and higher metallicities have cool photospheric temperatures that are conducive to the formation of deep absorption bands of TiO and ZrO at visible and red wavelengths, and blanketing from these species forces the RGB and AGB sequences in the color-magnitude diagrams (CMDs) at visual wavelengths to slump over (e.g. see discussion in Ortolani et al. 1990). This complicates efforts to measure the luminosities of the brightest AGB stars, while also making AGB-tip stars more susceptible to blending with sources that have lower intrinsic luminosities. The detection of highly evolved AGB stars at visible wavelengths may also be affected by obscuration from circumstellar dust.
Many of the challenges that are inherent to the detection of bright AGB stars at visible wavelengths are eased when observing in the near- and mid-infrared (NIR and MIR). The effects of line blanketing and circumstellar obscuration are significantly reduced at these wavelengths. In addition, cool AGB stars are significantly brighter in the infrared than the bulk of the underlying population that contributes most of the stellar mass. When observed in the NIR and MIR, the coolest AGB stars are thus less susceptible to blending and can be used to probe regions in galaxies where MSTO stars can not be detected. In the particular case of M32, AGB stars have been resolved in and by AO-equipped ground-based telescopes to within a few arcsec of the galaxy center (e.g. Davidge et al. 2000, Davidge & Jensen 2007; Davidge et al. 2010). This is a part of the galaxy where there is no hope of resolving stars near the MSTO in the foreseeable future.
The high emissivity associated with ground-based facilities is a formidable obstacle for studying all but the brightest sources in the MIR. While deep MIR observations are the exclusive purview of space-based facilities, these same facilities have poorer angular resolution than ground-based facilities due to their modest apertures. The superior angular resolution offered by ground-based facilities provides a niche that can be exploited, at least at the shortest MIR wavelengths.
In the present study, data obtained with the Canada-France-Hawaii Telescope (CFHT), Gemini North (GN), and the SPITZER satellite are used to investigate the NIR and MIR photometric properties of (1) the most luminous stars in M32 and (2) the isophotal properties of the integrated light. The data sample wavelengths where a significant fraction of the light from the coolest stars is emitted. The sample of resolved stars is comprised mainly of objects evolving on the upper AGB, as crowding in the MIR data effectively prevents the detection of RGB stars (Section 4.2). The GN observations are of particular interest for isophotal studies as they explore the central regions of the galaxy between 3 and m with sub-arcsec angular resolution, which is not possible with the current generation of space-based infrared facilities. Wavelength-dependent differences in isophotal characteristics such as eccentricities and fiducial radii could point to age gradients and/or distinct structural components.
A distance of kpc for M32, measured from the brightness of the RGB-tip by Evans et al. (2000) and corresponding to a distance modulus , is adopted here. Our conclusions would not change if the distance modulus were varied by magnitude. A foreground reddening of A, taken from the Schlafly & Finkbeiner (2011) re-calibration of the Schlegel, Finkbeiner, & Davis (1998) maps, is also used throughout this paper. The absence of warm and cool interstellar dust (Gordon et al. 2006) and the colors of RR Lyraes (Sarajedini et al. 2012) suggests that there is no internal reddening. Finally, the ‘average’ reddening law listed in Table 1 of Indebetouw et al. (2005) is adopted for MIR wavelengths.
Details of the observations and their reduction are described in Section 2, while the procedures used to construct, calibrate, and characterize the photometric measurements are discussed in Section 3. The CMDs obtained from these data are presented in Section 4, and the NIR and MIR luminosity functions (LFs) are compared with models in Section 5. The isophotal properties of M32 in the NIR and MIR are examined in Section 6. The paper closes in Section 7 with a brief discussion and summary of the results.
2 OBSERVATIONS & DATA REDUCTION
2.1 SPITZER IRAC Data
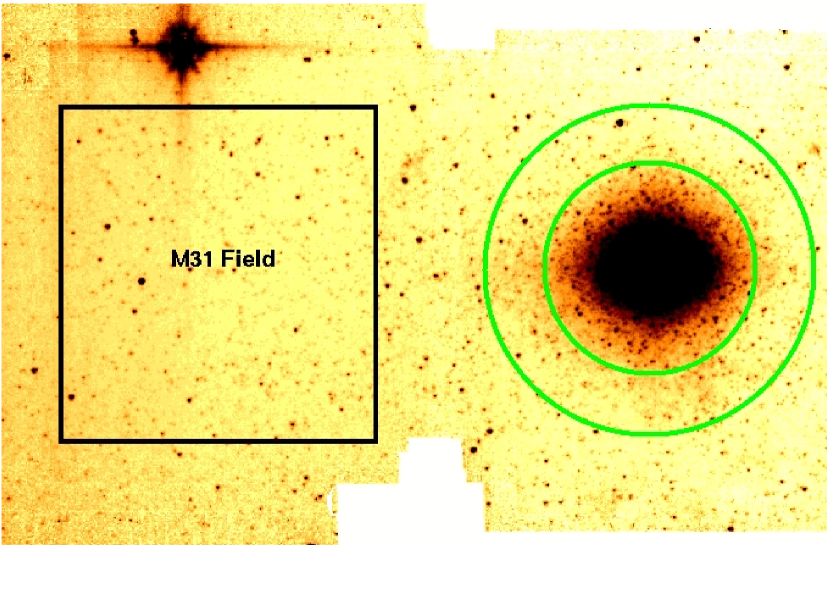
Post Basic Calibrated Dataset (PBCD) mosaics of IRAC (Fazio et al. 2004) images in [3.6], [4.5], [5.8], and [8.0] from program ID 3400 (PI Rich) were downloaded from the NASA/IPAC Infrared Science archive111http://irsa.ipac.caltech.edu/Missions/spitzer.html. The [5.8] mosaic of M32 and the surroundings is shown in Figure 1. The data were recorded with on-sky offsets to cover a field that is larger than that sampled by a single exposure, and the total exposure time varies across the mosaiced field. Only the area in the mosaics that has the largest effective exposure time, and hence the deepest and most uniform photometric characteristics, was considered for this study. The extracted M32 field covers a arcmin2 area that is centered near = 00:42:56, = 40:45:48 (E2000).
The images in all four IRAC channels were used to obtain the brightnesses of individual bright stars in and around M32, thereby allowing MIR CMDs and LFs to be constructed. In addition, the [3.6] and [4.5] images were used to examine the isophotal properties of M32. The [5.8] and [8.0] images were not considered for this latter analysis as the isophotal properties of M32 could not be traced to radii arcmin in those images.
The geometry of the IRAC detector arrays allows parallel [3.6] and [5.8] observations to be recorded of a field that samples the outer disk of M31 directly to the east of M32. This field also overlaps with moderately deep archival WIRCam data (Section 2.2). A sub-section of this field that covers a arcmin2 area and is centered near = 00:42:56, = +40:45:48.3 (E2000) was used to assess contamination from the M31 disk in the M32 IRAC data. The location of the M31 outer disk field is indicated in Figure 1.
Parallel observations that sample a field to the west of M32 were also recorded in [4.5] and [8.0]. This parallel field samples an area that is closer to the main body of M31 than M32. The stellar content is less homogeneous in this field because of increased contamination from the main disk of M31, raising the concern that it may not be representative of the M31 disk near M32. Therefore, this parallel field was not considered when assessing disk contamination.
2.2 CFHT WIRCam Data
and photometry of stars in M32 and the outer disk of M31 were obtained from archival CFHT WIRCam (Puget et al. 2004) images. The detector in WIRCam is a mosiac of four HgCdTe arrays arranged in a format with 45 arcsec gaps between arrays. Each WIRCam pointing covers a arcmin2 field with 0.3 arcsec pixel-1 sampling.
The images used here are of pointings M31-401 and M31-405 from programs 2009BC29 (PI: Sick) and 2009BH52 (PI: Tully). Twenty-five 20 sec exposures and twenty-six 20 sec exposures that had been processed with the I’IWI pipeline were downloaded from the CFHT archive at the Canadian Astronomical Data Centre 222http://www1.cadc-ccda.hia-iha.nrc-cnrc.gc.ca/en/cfht/. These were aligned to correct for on-sky offsets and the median of the pixel intensity distribution, which serves as a proxy for the mean sky level, was subtracted from each frame. The results were then stacked by finding the median intensity at each pixel location, trimmed to the area of common angular coverage, and transformed to the orientation of the IRAC images using the GEOMAP and GEOTRANS tasks in IRAF. Stars in the final images have 0.7 arcsec FWHM.
2.3 Gemini NIRI Data
Ground-based observations in the MIR are hampered by high levels of emissivity, which mushrooms in size at wavelengths longward of m to produce noise of monumental proportions. The high background levels hinder efforts to study all but comparatively bright objects in the MIR with ground-based telescopes. This severe handicap notwithstanding, the large apertures of ground-based facilities results in angular resolutions that surpass those delivered by space-based telescopes, providing a niche for ground-based MIR observing. Ground-based observations are at present the only means of obtaining sub-arcsec angular resolution images in the MIR.
The central regions of M32 were observed with NIRI (Hodapp et al. 2003) through , , and filters as part of queue program GN-2006B-Q-64 (PI: Davidge). The NIRI detector is a InSb array. The f/32 camera was used for these observations, and each exposure thus samples a arcsec2 field with 0.022 arcsec pixel-1 sampling.
2.3.1
The images were corrected for wavefront distortions using the GN facility AO system ALTAIR (Herriot et al. 2000). ALTAIR was used in natural guide star (NGS) mode, with the semi-stellar nucleus of M32 serving as the NGS. Twenty images, each consisting of three coadded 5 sec exposures, were recorded. A dither pattern that samples the corners of a arcsec square was used to facilitate the identification and suppression of cosmic rays and cosmetic defects. Five exposures were recorded at each dither position. The telescope was offset to one of four background fields that are located 90 arcsec to the North, South, East, and West of the galaxy nucleus after each dither position was observed. These background fields monitor the sky level, and allow a calibration frame to be constructed that can be used to remove thermal emission from warm sources along the optical path (see below).
The reduction of the images followed standard procedures for NIR imaging, and utilized three calibration frames. The first of these monitors the dark current, and this was constructed by median-combining frames taken of the unilluminated array that have the same exposure times as the science data. The resulting dark frame was subtracted from each image.
The second calibration frame monitors flat-field variations, and was constructed from a series of exposures that involve the Gemini facility calibration unit (GCAL). A series of images with the GCAL light source turned on were recorded, and these were followed by another sequence in which the GCAL light source was turned off. The first set of images contain signatures of the flat-field pattern (multiplicative in nature) combined with thermal emission (additive in nature), whereas the second set contains only signatures from thermal emission. Taking the difference between the two sets of exposures thus removes the thermal emission, leaving behind the flat-field information. The difference between the two sets of images was normalized to unity and the dark-subtracted images were divided by the resulting flat-field frame.
A third calibration frame was constructed to remove thermal signatures that are produced by warm objects along the optical path, such as dust on exposed optical surfaces. Such objects glow in the infrared and are out of focus, producing diffuse signatures that usually become evident only after flat-fielding. Flat-fielded images of the background fields were median-combined after the mean sky level was subtracted from each image to remove variations in the sky brightness to construct a thermal contamination calibration frame. The result was subtracted from the flat-fielded M32 images.
The images that were corrected for thermal emission were aligned and combined by taking the median intensity at each pixel location. The result was trimmed to the area common to all exposures. Stars in the final image have FWHM = 0.09 arcsec.
2.3.2 and
ALTAIR could not be used for the and observations as it has transmissive optical components that introduce background signal at wavelengths longward of m that saturates the NIRI detector. Even without ALTAIR, the high ambient background in and necessitates the use of short exposures to prevent saturation. A single observation at each dither position in consisted of 30 co-added 0.6 sec exposures, while a single observation in consisted of nine exposures, each of which was made up of 34 co-added 0.5 sec exposures. The and observations were recorded with a 5 point dither pattern that samples the four corners and the middle of a arcsec square. The dither pattern was repeated seven times in each filter, and the total on-source exposure times are 630 sec in and 5355 sec in . One of four background fields located along the cardinal axes was observed following each complete observation at a dither position.
The construction of flat-field frames in and is problematic given the high levels of thermal emission in the MIR. In any event, thermal noise dominates in these filters, and so the primary processing step is the removal of thermal emission signatures. The mean intensity and noise pattern in the background field observations varies from exposure-to-exposure, with the largest variations in . To account for this variability, a calibration image was constructed for each M32 exposure by linearly interpolating between successive background field observations. The interpolated images were then subtracted from the M32 exposures. The resulting background-subtracted images have substantially lower residual noise than those constructed using either the preceeding or subsequent background observation. Even so, residual thermal signal at the few percent level remains, indicating that the variations in the thermal background vary in a manner that is more complicated than the linear trend assumed here.
The background-subtracted and frames were aligned and the median intensity at each pixel was found after a residual mean sky level, which was measured near the edges of the field, was subtracted from each image. The images were aligned using the nucleus of M32, which is the only source detected in individual frames. The relatively modest signal from the center of M32 in introduces arcsec (i.e. a few pixels) uncertainties in the alignment of the individual exposures.
The final processing step was to trim the stacked and images to the area that is common to all pointings. Individual stars are seen in the final image, and these have FWHM = 0.18 arcsec. As for the images, these were recorded over two nights during only fair seeing conditions, and individual stars are not detected. The angular resolution of these data, measured from observations of standard stars that were observed throughout the M32 observing sequence, is 0.40 arcsec FWHM.
3 PHOTOMETRIC MEASUREMENTS
3.1 SPITZER Data
The IRAC Instrument Handbook 333http://irsa.ipac.caltech.edu/data/SPITZER/docs/irac/iracinstrumenthandbook/ advises against the use of point spread function (PSF)-fitting to extract photometry from IRAC images, with non-uniformities in pixel sensitivity and the undersampling of the PSF cited as concerns. Still, numerous studies of the stellar contents of nearby galaxies have used PSF-fitting to extract photometry from IRAC images (e.g. Meixner et al. 2006, McQuinn et al. 2007; Mould et al. 2008), as it is an accepted means of performing photometry in crowded environments. To assess the best means of measuring stellar brightnesses in the current study, two sets of photometric measurements were made from the [3.6] and [5.8] images: (1) aperture photometry with brightnesses obtained from the PHOT routine in the DAOPHOT (Stetson 1987) package, and (2) PSF-fitting photometry using ALLSTAR (Stetson & Harris 1988). Sources within 90 arcsec of the center of M32 were not photometered, as surface brightness fluctuations in this high-density region can masquerade as individual stars. Both sets of photometry were calibrated using flux zeropoints calculated by Reach et al. (2005).
Crowding is an obvious concern when conducting aperture photometry in external galaxies. To mitigate against crowding, the aperture measurements were made with a comparatively narrow 3 pixel (1.8 arcsec) radius. Final brightnesses were then obtained by applying an aperture correction that was measured from stars in uncrowded parts of the images. An additional concern for crowded extragalactic environments is that non-uniformities in the integrated surface brightness can occur over angular scales that are comparable to the area where the local sky level is measured, and these introduce errors into both aperture and PSF-fitting measurements. To correct for localized sky structure, a running boxcar median filter with dimensions that are sufficient to suppress stars was applied to the images, and the resulting smoothed image was subtracted from the data.
PSFs were constructed using tasks in DAOPHOT (Stetson 1987). A single PSF was constructed for each filter, and faint objects close to PSF stars were subtracted out using progressively improved versions of the PSF. Once a final PSF was obtained then the final photometric measurements were made with the PSF-fitting routine in ALLSTAR (Stetson & Harris 1988).
The PHOT and ALLSTAR routines estimate the uncertainty in photometric measurements using the properties of the source and the surrounding background. The photometric measurements of objects that are in crowded environments and/or that are non-stellar in appearance have higher uncertainties than those in uncrowded environments that have a star-like light profile. To remove sources with problematic photometry, objects that depart from the general trend on the error magnitude relation for each filter were removed from the photometric catalogue. This parallels the procedure applied by Davidge (2010) to PSF-fitting photometry, where objects were rejected using the uncertainty computed by ALLSTAR. Davidge (2013) found that the properties of the final sample culled using photometric error are similar to those that result when other object characteristics, such as image sharpness, are used to identify sources with problematic photometry.
The CMDs obtained from aperture and PSF-fitting measurements for sources in M32 and the M31 disk field are compared in Figure 2. The standard deviation about the mean [3.6]–[5.8] for objects with [5.8] between 15.75 and 16.25, , is shown for each CMD. This brightness interval samples AGB stars in a heavily populated part of each CMD, and is well above the faint limit. An iterative rejection filter was applied to suppress outliers when computing .
The CMDs constructed with PSF-fitting sample a larger number of objects and go significantly fainter than those obtained from aperture measurements. While the differences between computed from the aperture and PSF-fitting photometric measurements are modest, the AGB sequence when [5.8] in the PSF-fitting CMD of M32 is better defined than in the aperture photometry CMD. Given (1) the differences in the number of objects between the two sets of CMDs, and (2) the tightness of the bright end of the M32 CMD obtained with PSF-fitting, then PSF-fitting is adopted as the prefered photometry technique.
3.2 WIRCam and Gemini NIRI Data
The PSF-fitting program ALLSTAR was used to obtain photometric measurements from the WIRCam and NIRI images. As with the IRAC observations, the PSFs were constructed from bright, isolated stars, and an iterative scheme was applied to suppress faint neighboring stars. No attempt was made to photometer objects within 90 arcsec of the galaxy center in the WIRCam images, as crowding confounds efforts to resolve individual stars there unless the data have an angular resolution arcsec FWHM (e.g. Davidge et al. 2000). The WIRCam photometry was calibrated using zeropoints obtained from standard star observations that were recorded during the same semester, and this information is available on the CFHT web site 444http://www.cfht.hawaii.edu/Instruments/Imaging/WIRCam/WIRCamStandardstars.html. The NIRI photometry was calibrated using zeropoints obtained from standard star observations that were recorded as part of the baseline calibration set for this program.
The IRAC observations have angular resolutions that are significantly poorer than the WIRCam data. The WIRCam data can then be used to assess in a preliminary way the effect of crowding on the MIR data. Emphasis is placed on the [3.6] data for these experiments, as (1) this passband is closest in wavelength to the WIRCam observations, and (2) at longer wavelengths crowding is expected to become less of an issue because of the increased contrast between the brightest AGB stars and the vast majority of other stars in M32.
Stars in the IRAC [3.6] observations have a FWHM of 1.8 arcsec, and so the and WIRCam images were convolved with a Gaussian that degrades the angular resolution to match that of the [3.6] observations. The CMDs of objects between 1.5 and 2.5 arcmin distance from the center of M32 obtained from the unsmoothed and smoothed WIRCam images are compared in Figure 3. While there are obvious differences near the faint end, there is reasonable agreement at the bright end, most noteably near the AGB-tip.
The contrast between AGB stars and the vast body of fainter stars increases towards longer wavelengths, and so the method described above is a conservative approach for assessing the impact of crowding. It is thus significant that the comparisons in Figure 3 suggest that the angular resolution of the [3.6] data should not skew the properties of the brightest stars in the outer regions of M32. Additional evidence to support this claim is presented in Section 4.2.
4 RESULTS: CMDs
4.1 Near-Infrared CMDs
The CMDs of the M31 outer disk and of three annuli centered on M32 that sample equal areas on the sky are shown in Figure 4. The inner and outer boundaries of the region where resolved stars in M32 are investigated are indicated in Figure 1. The dominant plume of objects in each CMD is populated by AGB stars, and the color and peak brightness of the AGB sequence are consistent with those measured by Davidge & Jensen (2007). It should be recalled that the WIRCam CMDs sample a much larger portion of M32 than those presented by Davidge & Jensen (2007). The peak brightness in the Inner annulus is , which is similar to the peak brightness near the center of the galaxy (e.g. Davidge et al. 2000). The absence of a radial trend in the peak brightness is one indicator that the photometry of the brightest stars is not affected by crowding. The M31 CMD extends to fainter magnitudes than the M32 CMDs, owing to the lower stellar density in that field.
A significant fraction of the brightest AGB stars near the center of M32 are long period variables (LPVs) with light curve amplitudes in that may exceed two magnitudes (Davidge & Rigaut 2004). Such variability complicates efforts to determine ages from CMDs using the brightest stars. To mitigate the impact of such variability, in the remainder of this section emphasis is placed on the photometric properties of stars that are midway down the AGB on the CMD, where the affects of LPV-like variations should average out. The SFH of M32 is investigated in Section 5 using model LFs that account for LPV behaviour.
Basic insights into the stellar contents of M32 and the outer disk of M31 can be gleaned by comparing the mean colors of the AGB sequences. To this end, mean colors were computed for objects with between 16.75 and 17.25. This magnitude interval samples an area of the CMD that is well above the faint limit and is richly populated in both M32 and M31. A iterative rejection filter was applied to suppress outliers.
The mean colors in the CMDs of the Inner, Middle, and Outer annuli of M32 are , , and , where the uncertainties are the standard error of the mean. Modelling of long-slit spectra suggests that the stellar content of M32 changes with radius (Worthey 2004; Rose et al. 2005; Coelho et al. 2009). Still, the systematic absorption line gradients that are typical of large pressure-supported galaxies (e.g. Davidge 1992; Davies et al. 1993; Sanchez-Blazquez et al. 2006) are not seen (Davidge 1991; Davidge et al. 2008, but see also Hardy et al. 1994). Some of the features that do vary with radius in M32 show behaviour that is contrary to what might be expected when compared with classical elliptical galaxies (e.g. Davidge, de Robertis & Yee 1990).
The progressive increase in towards larger radius in M32 is contrary to what is expected in the absence of large-scale spectroscopic gradients. Rather than sampling an instrinsic radial change in the properties of M32, it is likely that the radial increase in mean is due to contamination from stars in the M31 disk. The mean color in the M31 disk field is , and the fractional contamination from M31 disk stars in the M32 CMDs increases towards larger radii. Indeed, band surface brightness measurements of M32 from the 2MASS Large Galaxy Atlas (Jarrett et al. 2003) indicate that the number of stars in the Outer annulus that belong to M32 is 75% lower than in the Inner annulus. However, the Outer annulus contains 40% fewer stars than in the Inner annulus, indicating that the fractional contribution from M31 disk stars grows with increasing radius. Adding an AGB component with a color like that in the M31 disk field to a population with a mean color like that in the Inner annulus will produce a radial trend in the mean M32 colors in the same sense as that found here.
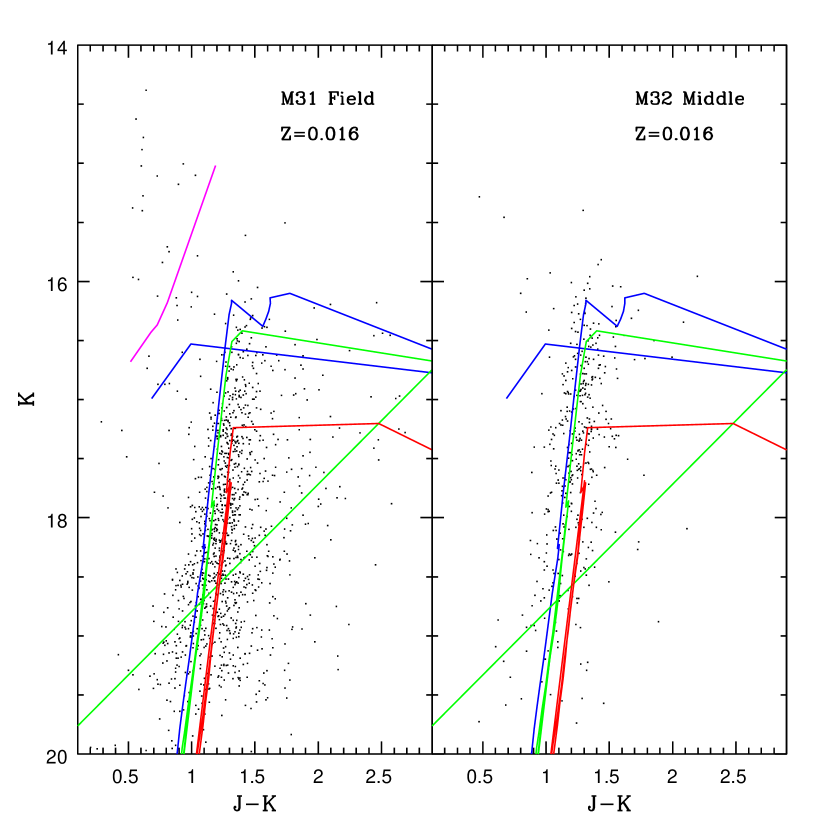
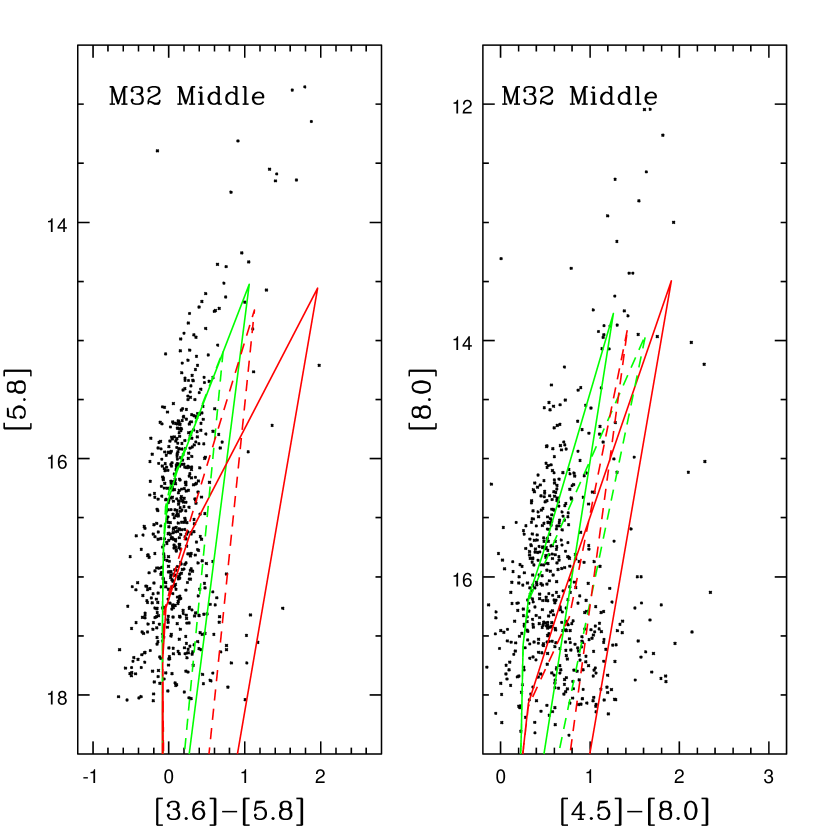
The mean color of AGB stars in M32 is bluer on average than in the M31 disk, suggesting differences in mean metallicity and/or mean age. Quantitative insights into the stellar contents of M32 and the M31 outer disk can be obtained by making comparisons with isochrones, and the CMDs of the M31 outer disk and the M32 Middle annulus are compared with model sequences from Marigo et al. (2008) in Figure 5. These sequences, and all other models used in this paper, were downloaded from the Padova Observatory website 555http://stev.oapd.inaf.it/cgi-bin/cmd, and are based on the most recent versions of the models constructed by this group that include the thermally-pulsing (TP) phase of AGB evolution. This phase of evolution is critical for understanding the MIR properties of the most evolved AGB stars.
The models shown in Figure 5 have Z = 0.016 and ages 1 Gyr, 3 Gyr, and 10 Gyr. Based on previous estimates of the metallicity of M32, it is anticipated that the number of C stars will be modest, and the majority of stars will be oxygen-rich M giants. Thus, the 60% AlOx 40% silicate composition model discussed by Groenewegen (2006) is assumed for circumstellar dust. While the chemical composition of the circumstellar disk is of only secondary importance for the NIR photometric properties of AGB stars, this is not the case in the MIR (Section 4.2).
The 3 Gyr isochrone tracks the ridgeline of the M32 sequence in the right hand panel of Figure 5, while the 1 and 10 Gyr isochones more-or-less follow the blue and red envelopes of the AGB sequence. In contrast, the majority of bright stars in the M31 outer disk have isochrone-based ages Gyr when compared with the solar metallicity sequences. That the AGB stars in the M31 field tend to have colors that are suggestive of a sizeable old population is consistent with the SFH measured in other fields in the outer disk of M31 (e.g. Davidge et al. 2012; Bernard et al. 2012), including close to M32 (Monachesi et al. 2012).
A fiducial Galactic RSG sequence, constructed from the entries in Table 5 of Koornneef (1983), is included in the left hand panel of Figure 5. The objects that populate the plume with and in the M31 outer disk CMD have colors that are consistent with them being G and K supergiants, indicating that the outer disk field contains moderately young stars. Relatively young stars are expected in this part of M31 as (1) there are areas of recent star formation in nearby fields (van den Bergh 1964; Hodge 1979), and (2) members of other groupings may drift into this field due to the motions that these objects attain as they interact with large interstellar clouds. Significant mixing of stars in the low-density outer regions of disks can occur over time scales of only a few tens of Myr (e.g. Davidge et al. 2011).
4.2 Mid-Infrared CMDs
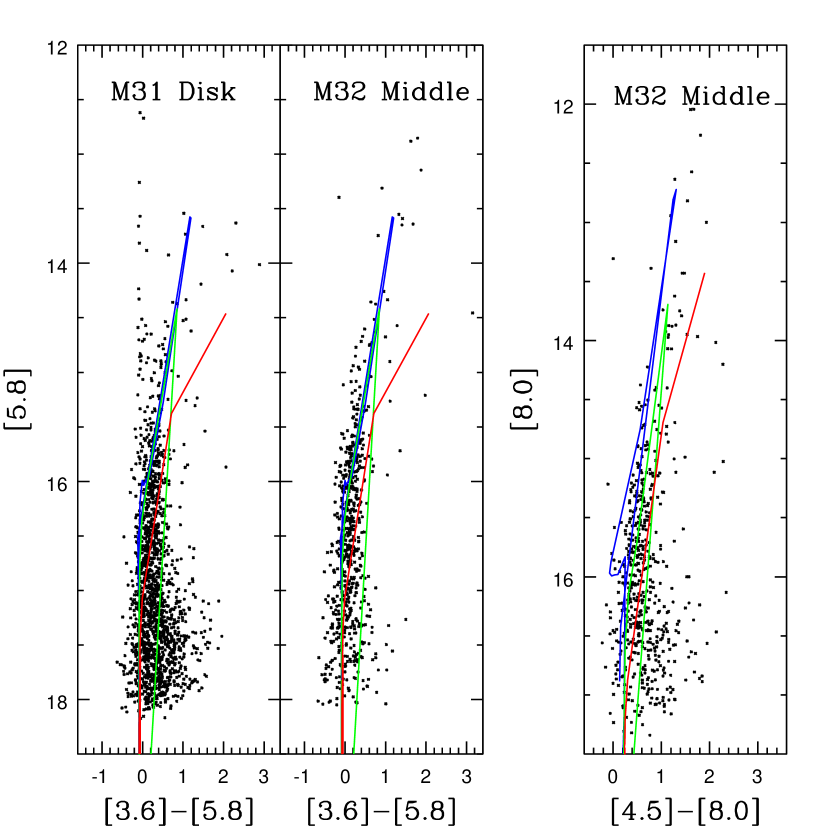
The CMDs of objects in M32 and the M31 outer disk are shown in Figure 6, while the CMDs of M32 are shown in Figure 7. The majority of stars in these CMDs are evolving on the AGB, and there are few – if any – RGB stars. The Marigo et al. (2008) models predict that the red giant branch (RGB)-tip in solar metallicity systems with ages Gyr has an absolute magnitude in each IRAC filter, which corresponds to apparent magnitudes in M32. Given that the number density of RGB stars is higher than that of AGB stars, then it is perhaps not unexpected that the faint limit of the CMDs coincides with the expected location of the RGB-tip, as the resulting increase in crowding near the RGB-tip will impose a limiting magnitude if individual RGB stars can not be resolved.
The vertical sequence with [3.6] – [5.8] in the left hand panel of Figure 6 contains a mix of foreground main sequence stars, evolved stars in M31 and M32 that do not have circumstellar envelopes, and extragalactic sources. This plume is less well populated in the M32 CMDs due to the smaller sky coverage of each annulus. The number of extragalactic sources in the CMDs can be estimated from the source counts given by Fazio et al. (2004). Assuming a uniform distribution on the sky then there should be extragalactic objects in the M31 outer disk field with [5.8] between 15.5 and 16.5, and 56 objects towards M32. For comparison, there are 359 objects detected in this magnitude range in the M31 outer disk field, and 432 towards M32. Background galaxies thus account for 10 – 20% of the objects in the CMDs. These are upper limits to extragalactic contamination as ALLSTAR rejects sources that are obviously non-stellar.
The M31 outer disk field contains objects with [5.8] that span a broader range of colors than those in the M32 CMDs. There is evidence that many of the brightest objects in the M32 Middle and Outer annulus CMDs likely belong to the M31 disk. In particular, outside of the region within 90 arcsec of the center of M32 where individual stars are most susceptible to blending, objects with appear to have a more-or-less uniform distribution, as expected if they belong to the outer disk of M31.
The and ) CMDs of the Middle annulus of M32 are compared with Z=0.016 isochrones from Marigo et al. (2008) in Figure 8. While the 1 and 3 Gyr isochrones match the ridgeline of the M32 CMD, the agreement with the brightest objects is poor. The isochrones on the CMD also fall short of the brightest stars in the Middle annulus of M32, although the ridgeline of colors is consistent with ages Gyr. The inability of the models to match the observations near the bright end may be because some of the brightest AGB stars are LPVs. Comparisons with the two color diagram (TCD) – discussed below – indicates that the predicted spectral-energy distribution (SEDs) disagree with the observations by 0.1 – 0.2 magnitudes.
The isochrones also indicate that old, metal-rich AGB stars should be detected with these data. The 10 Gyr isochrone more-or-less skirts the red envelope of objects in M32 when , with LPVs possibly accounting for the modest number of objects with [3.6]–[5.8] colors that are redder than the 10 Gyr sequence. A similar situation holds for the CMD. There is thus photometric evidence in the MIR for an old metal-rich population, and in Section 6 it is demonstrated that these objects contribute significantly to the number counts.
The CMD of the M31 outer disk field is compared with isochrones in the left hand panel of Figure 8. The main locus of the CMD of the M31 outer disk when is consistent with a mean age that is similar to M32. The isochrones suggest that the objects with [3.6]–[5.8] near [5.8] may be highly evolved AGB stars with ages between 3 and 10 Gyr. Still, some of these may be LPVs, in which case their location on the CMD may not reflect their true age and metallicity. The CMD of the M31 outer disk field is consistent with stars being present that formed over a broad range of ages.
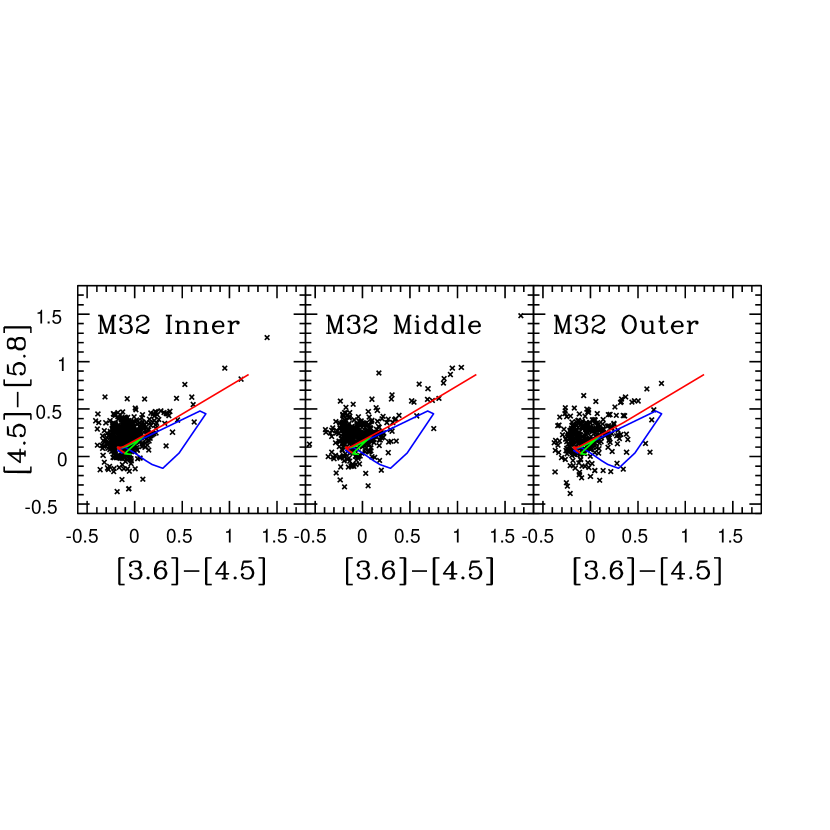
TCDs are a means of comparing model SEDs with those that are observed. The TCDs of sources in M32 with [4.5] are compared with post-RGB models from Marigo et al. (2008) in Figure 9. There is a red plume in each radial interval that has a dispersion of a few tenths of a magnitude. Even though the stars on this plume are highly evolved and many expected to be LPVs, the comparatively modest scatter is likely a consequence of the simultaneous nature of the IRAC observations, coupled with the smaller amplitude of LPV variations towards longer wavelengths. Still, the red plumes predicted by the models systematically fall 0.1 – 0.2 magnitudes below the observations.
The properties of isochrones on the upper reaches of MIR CMDs depends on the composition of the circumstellar dust, as this material can be a significant source of emission at these wavelengths. The comparisons in Figures 8 and 9 assume that circumstellar dust around M stars has a 60% ALOx % silicate mix. Do the ages obtained above change if different dust compositions are adopted? The role that dust composition plays on MIR isochrones is investigated in Figure 10, where the and CMDs of the M32 Middle annulus are compared with Z=0.016 isochrones from Marigo et al. (2008) that assume 100% silicate (solid lines) and 100% ALOx (dashed lines) compositions.
At a fixed age, the comparisons in Figure 10 indicate that model-to-model differences in peak brightness amount to only a few tenths of a magnitude. The mean [3.6]–[5.8] color of the 3 Gyr isochrone is also not sensitive to the chemical properties of the dust, although this is not the case for the 10 Gyr [3.6]–[5.8] colors. Dust composition has a greater impact on isochrones in the CMD, due to the greater contribution from thermal emission near [8.0] and the differences in absorption efficiencies that grow with wavelength (e.g. Figure 1 of Groenewegen 2006). Indeed, the 3 and 10 Gyr isochrones that assume a 100% ALOx composition overlap on the CMD. Neither 100% ALOx sequence gives a satisfactory match to the M32 CMD, with both falling redward of the M32 ridgeline. This suggests that some silicates must be present to reproduce the [4.5]–[8.0] colors of evolved AGB stars in M32.
4.3 The CMD
The NIRI and images are of special interest as they have an angular resolution that allows the brightest stars to be resolved to within a few arcsec of the galaxy nucleus. The magnitudes can be transformed into the IRAC [3.6] photometric system, allowing the behaviour of objects on the CMD to be examined over a wider range of radii than is possible with the IRAC data alone. The CMDs of stars in M32 and the M31 outer disk are shown in Figure 11. The M32 Center CMD is constructed exclusively from the NIRI observations. Objects within 2 arcsec of the nucleus of M32 have been excluded, as the photometry in that region is compromised by crowding and/or surface brightness fluctuations. The CMDs in the other panels use magnitudes from the WIRCam observations and [3.6] magnitudes from the IRAC images.
The peak [3.6] magnitudes in the M32 Center, Inner, and Middle annuli agree to within magnitude. Thus, the AGB peak brightness does not change greatly with radius, and there is not a central concentration of luminous AGB stars. With the exception of the outer annulus CMD, the peak [3.6] brightness of objects in the M31 outer disk field is magnitude brighter than in the M32 CMDs. If the brightest stars in the M31 outer disk were uniformly distributed then similar objects might be expected in the inner and middle annuli, although a population of bright field stars would not be expected in the M32 Center field due to the modest area covered on the sky when NIRI is used in f/32 mode.
5 RESULTS: LFs AND THE SFH DURING INTERMEDIATE EPOCHS
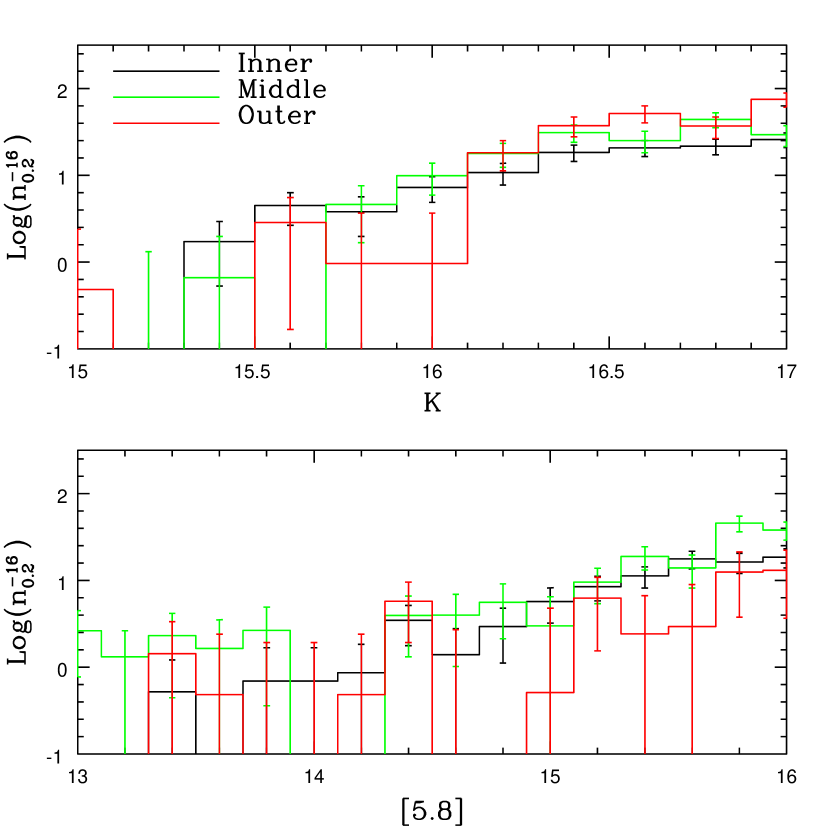
The LFs of stars in the inner, middle, and outer annuli of M32 are compared in Figure 12. Contamination from foreground stars, background galaxies, and stars in the disk of M31 is a concern, and so the M31 outer disk LFs were subtracted from the M32 LFs after adjusting for differences in sky coverage. A potential source of uncertainty in this correction is that the stellar content of the M31 disk field may differ from that of the disk near M32 (e.g. Figure 11).
The entries in Figure 12 are specific frequencies that give the number of objects per 0.2 magnitude interval in a system with M. The scaling to M was done using integrated annular brightnesses computed from the M32 surface brightness measurements in the 2MASS Large Galaxy Atlas (Jarrett et al. 2003). It can be seen from Figure 12 that the specific frequency in does not vary significantly from annulus to annulus, in agreement with the results found by Davidge & Jensen (2007). However, there is a tendency for the specific frequencies of stars in the [5.8] LF of the outer annulus to fall below those in the inner and middle annuli, although the differences for individual bins are not statistically significant. It should be recalled that the and [5.8] passbands sample different sources of emission, with the [5.8] LFs being more sensitive to AGB stars that have circumstellar envelopes than the LFs.
The interpretation of the LF of AGB stars is complicated by the rapid pace of evolution on the upper AGB, so that small number statistics may make signatures associated with changes in the SFR difficult to detect. Photometric variablity will also blur the LFs, smoothing features that might otherwise provide insight into the SFH. Finally, models of AGB evolution are prone to uncertainties in the stellar physics (e.g. Marigo et al. 2008). The expectation of uncertainties in the models notwithstanding, it is encouraging that there is consistency between the isochrones and observations on the CMDs and TCDs (Section 4).
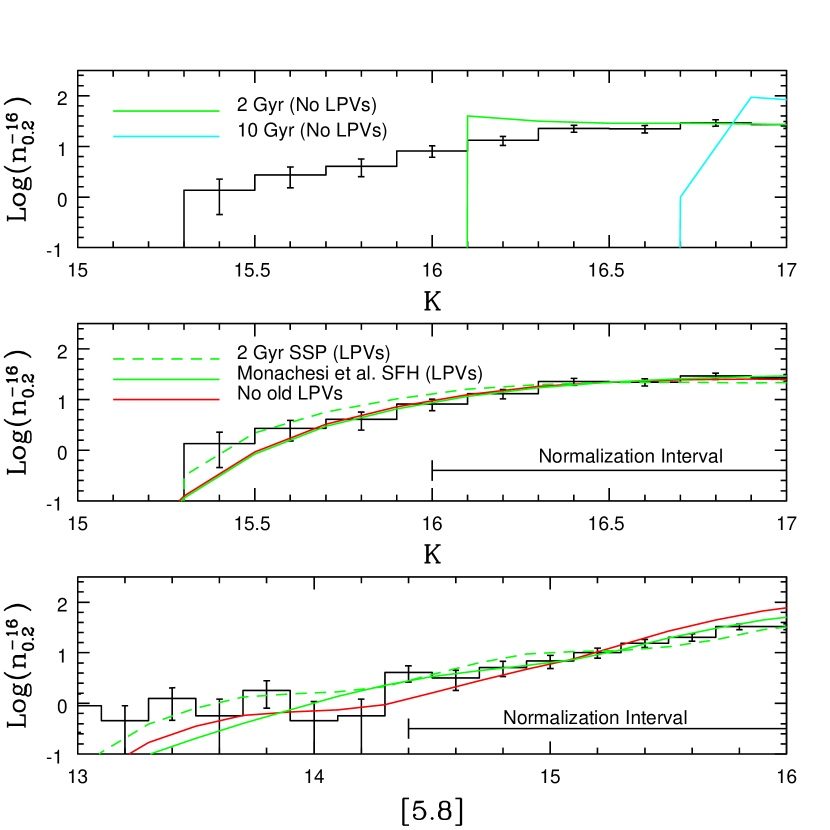
Rather than attempt to deduce an independent SFH from the LFs, the present analysis is restricted to comparisons with models that follow pre-defined SFHs. The simplest models are those that assume a simple stellar population (SSP), and in the top panel of Figure 13 the mean LFs of AGB stars in the inner and middle annuli are compared with 2 and 10 Gyr SSP sequences constructed from the Marigo et al. (2008) models. The models assume Z=0.016, a 60% silicate 40% AlOx circumstellar dust mix, and that none of the stars are photometric variables. The models in this panel have been scaled to match the number counts in the two faintest bins.
The 10 Gyr model covers only the faintest part of the plotted LF. In contrast, the 2 Gyr model in the top panel of Figure 13 provides a reasonable match over many magnitudes to the band LF. Still, the 2 Gyr model predicts a peak band magnitude that is magnitude fainter than observed. Comparisons involving the [5.8] LF yield similar results.
The majority of bright AGB stars in M32 are LPVs, with light curve amplitudes that approach magnitude in (Davidge & Rigaut 2004), and the light distribution in the models changes significantly if LPV-like photometric variability is added to the models. This is demonstrated in the middle panel of Figure 13, which shows the 2 Gyr model LF convolved with the distribution that Davidge & Rigaut (2004) obtained from the light curves of Galactic bulge LPVs tabulated by Glass et al. (1995). After convolution with this amplitude kernel, the 2 Gyr model LF matches the peak of the observed LF as well as the approximate shape of the LF near the bright end.
Photometric variability can also be folded into models that cover the IRAC passbands. The amplitude of LPVs near m is that in (e.g. Table 4 of Le Bertre 1993), and so a modified kernel, that was compressed along the magnitude axis by a factor , is applied to the [5.8] models. The 2 Gyr model constructed in this manner is shown in the bottom panel of Figure 13, and there is reasonable agreement with the [5.8] LF.
While the comparisons with the 2 Gyr SSP model in Figure 13 are consistent with a large intermediate age population, in reality M32 is a composite stellar system containing stars that span a range of ages and metallicities. Monachesi et al. (2012) have investigated the SFH of M32 using stars near the MSTO, and model LFs that are based on the SFH shown in their Figure 13a are compared with the observations in the middle and lower panels of Figure 13. The models follow a Chabrier (2001) mass function, and were convolved with the and [5.8] amplitude kernels described above. Tacit assumptions are that: (1) all AGB stars regardless of mass have the same variability characteristics, and (2) all of the AGB stars in M32 are LPVs. The models further assume that the brightest AGB stars have a solar metallicity, which is not unreasonable given the metallicity distribution function and age-metallicity relation found by Monachesi et al. (2012).
The composite model matches the number counts when , and is a better match to the observations in this magnitude range than the 2 Gyr SSP LF. The improved agreement with the observations is because old AGB stars in the composite model bolster the number counts at the faint end, making the composite model steeper than the SSP model. The agreement between the composite model and observations degrades when , although the differences are at less than the level. The agreement with the [5.8] LF is similarly good when [5.8] , with the overall shape of the observed LF reproduced at these magnitudes. The agreement is also better than was achieved with the 2 Gyr SSP model. However, as with the LF, the composite model does not match the bright end of the LF as well as the 2 Gyr SSP model.
Despite the promising agreement between the composite model and the observations, the model falls short near the bright ends of the and [5.8] LFs. There are uncertainties in the structure models of the most evolved AGB stars, and the cumulative impact of any uncertainties are expected to be greatest near the AGB-tip. Uncertainties in the LPV amplitude distribution function may also contribute to difficulties matching the numbers of very bright objects. A single amplitude kernel that is based on one population of objects (LPVs in the Galactic bulge) was adopted for this study. The agreement between the models and the bright end of the LFs in Figure 13 would improve if the amplitude distribution function were to be extended to larger amplitudes and/or was skewed to contain a larger fraction of objects at the high amplitude end.
The differences between the observations and the composite models might also indicate a mix of ages that differs from that predicted by the Monachesi et al. (2012) SFH. A larger fractional contribution from moderately young stars should boost the number of stars near the observed AGB-tip. To investigate this possibility, a model LF that follows the Monachesi et al. (2012) SFH from the present day to 7 Gyr, but that has no stars older than 7 Gyr, was constructed and the result is shown in Figure 13.
The suppression of star formation more than 7 Gyr in the past has a significant impact on the agreement with the observations. The differences are more pronounced in [5.8] than in as the AGB sequences of old populations extend to brighter intrinsic magnitudes in the MIR. The comparison between the [5.8] LF and the truncated SFH model thus indicates that M32 must contain a substantial metal-rich population that formed during relatively early epochs. This demonstrates that MIR observations provide a direct means of probing the SFH of a system over a wide range of epochs.
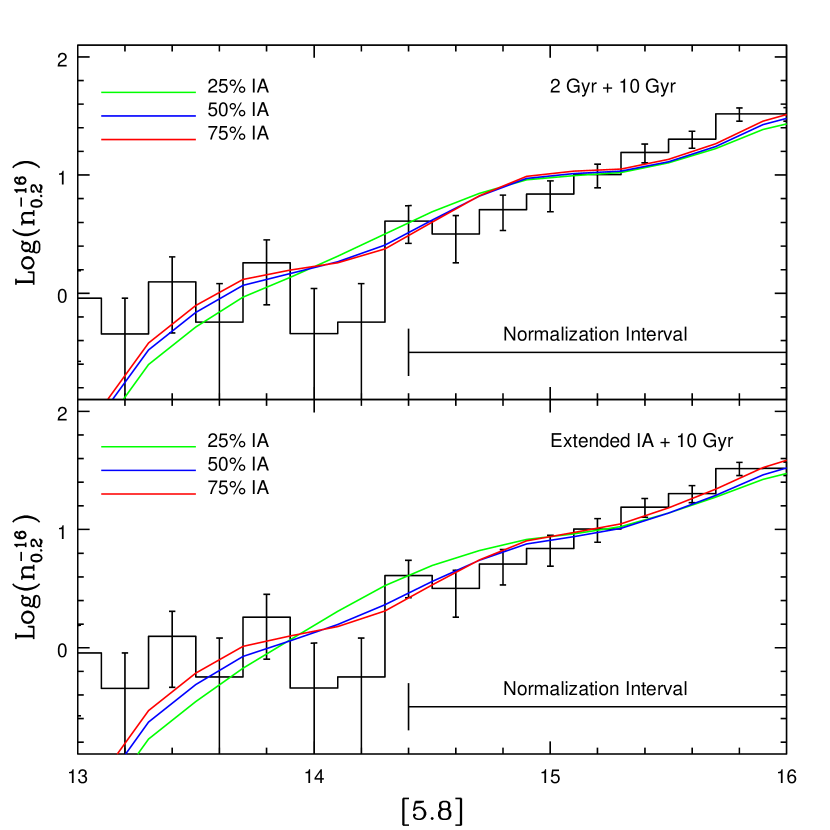
How sensitive is the [5.8] LF to changes in the size of star-forming events during intermediate epochs? The [5.8] LF of M32 is compared with models that contain an old population and an intermediate age component in Figure 14. Two flavors of intermediate age component are investigated: a discreet burst, which is represented by a 2 Gyr SSP, and a star-forming event with a constant SFR that has a 1 Gyr duration, and occured between 2 and 3 Gyr in the past. A solar metallicity is assumed.
Models in which the intermediate age component contributes three different stellar mass fractions are shown in Figure 14. It can be seen that (1) the composite models provide a better fit to the LFs than SSPs, and (2) models that involve an extended period of star-forming activity during intermediate epochs give a better match to the LF in the [5.8] interval between 14.5 and 16.0. In fact, the slope of the LF in this brightness interval, which corresponds to M[5.8] between –8.5 and –10.0, is sensitive to the age mix of the system. Models that assume a dominant intermediate age component yield a better match to the bright end of the [5.8] LF, although this is where the evolutionary models are least reliable and there is susceptibility to uncertainties in the nature of the amplitude distributions of LPVs (see above).
To summarize this section, model LFs that assume that the brightest AGB stars in M32 are LPVs better match the LFs in and [5.8] than those that assume no variability. Models that contain an intermediate age component – including those based on the SFH constructed by Monachesi et al. (2012) – match the shape of the LFs in M32 in and [5.8] over a range of magnitudes. It is also shown that the presence of an old population is required to explain the overall shape of the [5.8] LF of M32. These results highlight the potential utility of MIR observations of AGB stars to probe the stellar contents of moderately distant galaxies.
6 RESULTS: SURFACE BRIGHTNESS PROFILES AND STAR COUNTS
6.1 The Main Body of M32
The light profile of a galaxy forms part of its fossil record and can be used to gain insights into its evolution. In this section, the structural characteristics of M32 are examined over a range of wavelengths to search for possible radial differences in stellar content that might provide clues into the past history of the galaxy. To this end, the structure of M32 in , and [4.5] was investigated using the isophote-fitting task ellipse (Jedrzejewski 1987), as implemented in STSDAS. The analysis was performed on star-subtracted images. In addition to removing resolved stars that belong to M32, star subtraction also removes bright stars that belong to M31, but does not account for unresolved light from M31. To account for this, residual background sky levels were measured near the edges of the observed field and the result was subtracted prior to the isophotal analysis. This procedure assumes that the light from the M31 disk is uniformly distributed across the field, with the areas where the background light levels are measured being representative of this part of M31.
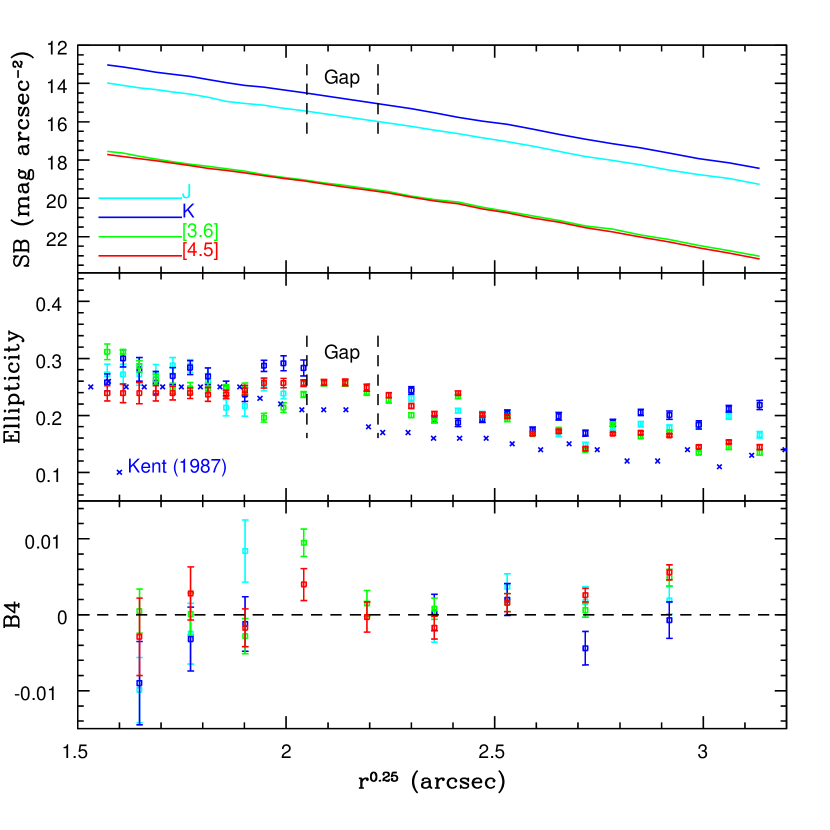
The light profiles are compared in the top panel of Figure 15. A cluster of bad pixels causes a gap in the radial coverage of the WIRCam observations, and the affected interval is indicated. The surface brightness profile in the central 150 arcsec of M32 can be fit with an R1/4 law (e.g. Choi et al. 2002). The effective radius, Re, and surface brightness, , obtained by fitting an R1/4 law to the WIRCam and SPITZER images are listed in Table 1. The Re measurements made by Kent (1987) and Choi et al. (2002) at visible/red wavelengths are also listed for comparison.
The errors in Re are random uncertainties that reflect the scatter about the fitted relation. Systematic effects, which are not included in the error estimates, have the potential to introduce uncertainties that are much larger than the random errors. For example, Choi et al. (2002) and Kent (1987) measure Re at similar wavelengths, but their results differ by 3 arcsec. This suggests that a more realistic total uncertainty in Re may be arcsec, which is larger than the random uncertainties. Still, it is encouraging that the Re values measured in , [3.6], and [4.5] agree within their random uncertainties, while the [3.6] and [4.5] Re measurements agree with the Re measured in the filter by Kent (1987) at the level. Given the uncertainties in Re, the entries in Table 1 suggest that Re is constant with wavelength, at least to within a few arcsec. The spatial distribution of the components that dominate the light at visible wavelengths, which includes a substantial contribution from main sequence stars, is thus not greatly different from the spatial distribution of the red stars that contribute significantly to the unresolved NIR and MIR light.
Additional insights into the evolution of M32 can be gleaned from isophote shapes. The ellipticities measured from the WIRCam and Spitzer images are compared with ellipticity measurements from Table III of Kent (1987) in the middle panel of Figure 15. The error bars show uncertainties that reflect the scatter about the fitted ellipses. These are internal errors, and the point-to-point jitter in the eccentricity measurements in a given filter suggests that at large radii the actual uncertainties may be a few times larger than those computed by ellipse.
There are no systematic differences between the NIR, MIR and R-band ellipticities at radii arcsec. However, between 16 and 45 arcsec the R-band ellipticities consistently fall below those measured at longer wavelengths, suggesting that the NIR and MIR isophotes at these radii are flatter than at visible wavelengths. The uncertainties in the ellipticities computed by ellipse would have to be in error by almost an order of magnitude to overlap with the eccentricity measurements. In fact, the ellipticities measured in and from the WIRCam data agree with those obtained by Peletier (1993) in the same filters, while the ellipticities measured by Kent (1987) agree with those measured by Choi et al. (2002). Hence, the differences found here are consistent with other independent measurements.
The ellipticity measurements suggest that at least some of the unresolved NIR and MIR light originates from objects that have a flatter distribution on the sky than the objects that dominate the light at shorter wavelengths. Such a distribution is suggestive of a disk, and evidence of a disk in the outermost regions of M32 has been found by Choi et al. (2002) and Graham (2002). The coefficient of the fourth order cosine term in the fourier expansion of the isophotes is a sensitive indicator of isophote shape (e.g. Carter 1978). If this coefficient then the isophote is ‘boxy, whereas if it is then the isophote is ‘disky’. The fourth order cosine coefficients – B4 – measured from the NIR and MIR data are plotted in the lower panel of Figure 15. The B4 values typically have only modest departures from zero, and to suppress random errors the points that are plotted in the lower panel of Figure 15 are the averages of coefficients from three adjacent isophotes.
The entries in the lower panel of Figure 15 indicate that when arcsec the B4 coefficient tends to be predominantly negative, indicating a boxy morphology. However, at larger radii there is a higher incidence of positive B4 values. The mean B4 values at arcsec and at arcsec are compared in Table 2, and it is evident that B4 changes with radius in , [3.6], and [4.5]. In fact, (1) the mean B4 entries in these filters in a given radial interval all agree, and (2) at arcsec the B4 coefficient in these filters exceeds zero at the or greater level. Still, the B4 measurements made from the images differ from those in the other three filters. Those measurements notwithstanding, the B4 values from the other three filters provide tantalizing evidence that the structural properties of M32 when arcsec is different from that at arcsec.
6.2 The Central Regions of M32
The center of M32 samples the deepest part of the gravitational potential well, and so may harbor signatures of past events that shaped its evolution. The angular resolution of the NIRI and observations allow the light distribution near the center of M32 to be investigated on spatial scales parsec. The central regions of M32 have been examined previously at sub-arcsec resolutions, although not at wavelengths m. Lauer et al. (1998) and Corbin et al. (2001) find no evidence of radial color variations in the visible and NIR, while Peletier (1993) and Davidge (2000) find that the narrow-band CO index in M32 may strengthen with decreasing radius in the central 3 arcsec.
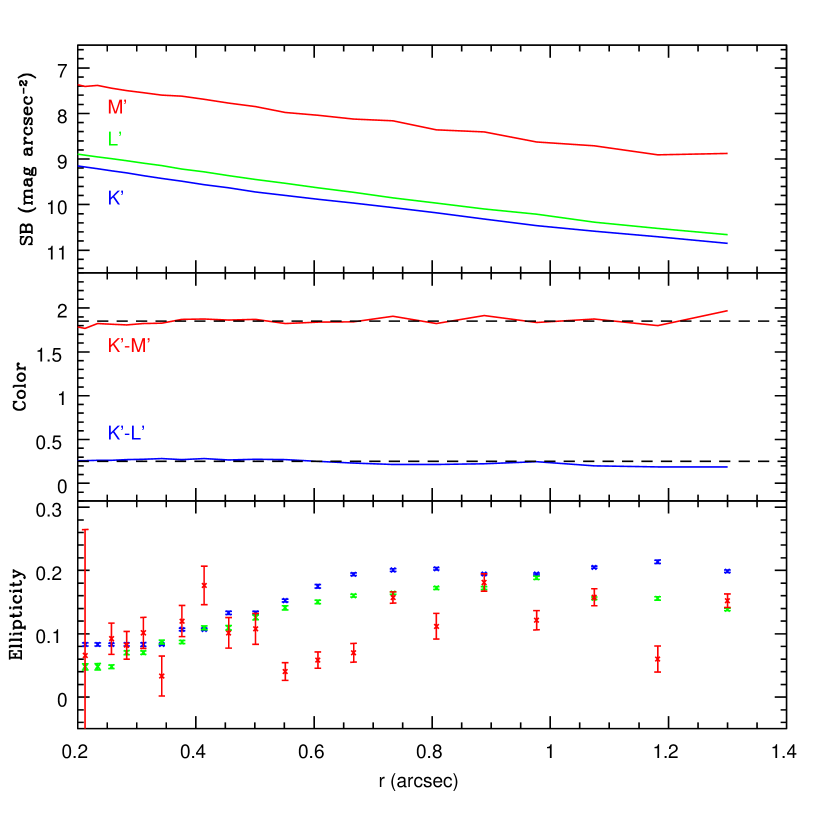
The and NIRI observations were smoothed to the angular resolution of the data, and the resulting light, color, and ellipticity profiles are shown in Figure 16. The central structural properties of M32 change substantially over small angular scales, and subtle variations in the character of the outer wings of the PSF may significantly affect colors in these regions. Therefore, no effort is made to examine the isophotal properties of the central 0.2 arcsec of M32.
The light profiles in the top panel of Figure 16 have similar slopes, and the and colors are more-or-less constant. The ellipticities measured from the and images are similar out to 1.3 arcsec. However, between 0.5 and 0.7 arcsec the ellipticities fall below those in and . While the centroiding of the individual images was subject to arcsec jitter (Section 2), this can not explain the dispersion in ellipticities at these radii. Uncertainties due to centroiding errors were assessed by conducting simulations involving a mock image that was constructed using the isohophotal analysis of the actual image. As the final science image was the result of median-combining 35 individual images, this mock image was replicated 35 times, with each replicant randomly offset by arcsec in radius. The 35 images with simulated image jitter were then median-combined, and was run on the result. A number of such realizations were run, and a comparison of the ellipticities measured from all of these indicates that a arcsec centroiding error introduces error in the ellipticities at a radius of 0.2 arcsec, and error at 0.4 arcsec. Uncertainties in image centroiding thus can not explain the difference between the and shorter wavelength ellipticity measurements near 0.5 arcsec radius. It would be of interest to obtain additional images near m to investigate further the MIR ellipticities between 0.5 and 0.7 arcsec.
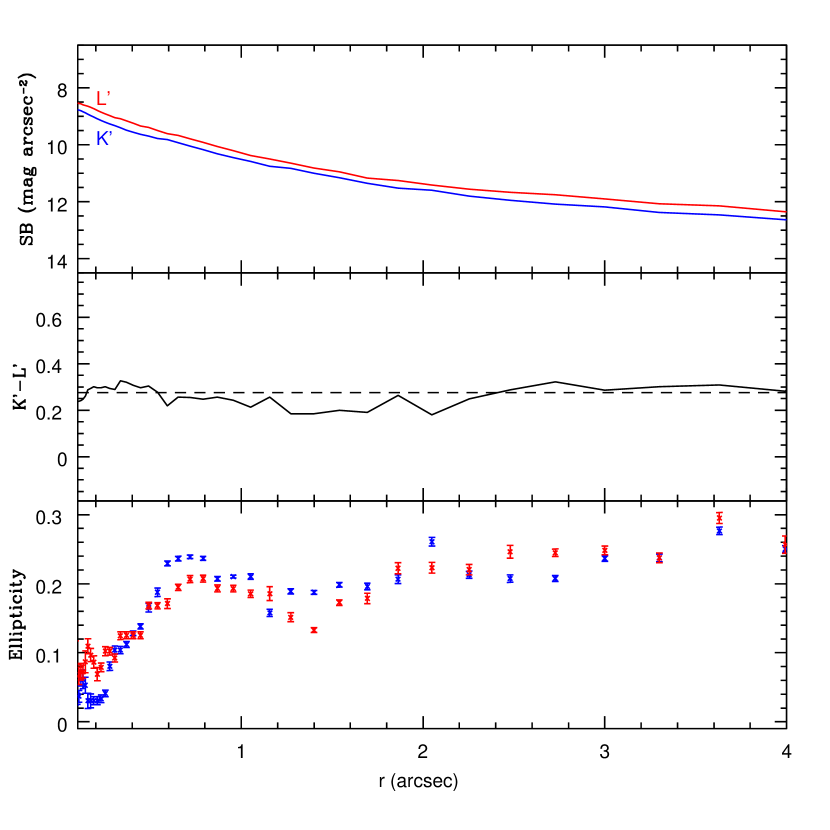
The isohotal properties of the and images, with the image smoothed to the angular resolution of the image, are compared in Figure 17. The angular resolution of the data used to construct Figure 17 is thus 0.2 arcsec, as opposed to the 0.4 arcsec resolution of the data used for Figure 16. The and surface brightness profiles have similar slopes, and this is reflected in the flat profile, shown in the middle panel. The and ellipticity measurements are also similar at radii arcsec. The tendency for ellipticity to decrease at radii arcsec is likely due – at least in part – to seeing effects (e.g. Erwin & Sparke 2003). The comparisons in Figures 16 and 17 indicate that the ‘stubborn normalcy’ in stellar content near the center of M32 noted by Lauer et al. (1998) is evident at angular resolutions 0.2 – 0.4 arcsec in the NIR and MIR.
7 DISCUSSION & SUMMARY
The stellar content of the Local Group cE galaxy M32 has been investigated using ground and space-based images that span the m wavelength region. A goal of this study is to use M32 as a foil to consider the utility of MIR observations for investigating the stellar contents of more distant galaxies. M32 is a favorable target for checking models and developing techniques that might be applied to trace the evolution of more distant galaxies as it is relatively nearby, allowing stars near the MSTO to be resolved, and has been extensively studied.
It is demonstrated that accounting for the LPV nature of bright AGB stars in M32 is an essential element of successfully modelling the NIR and MIR photometric properties of these objects. In the current study this has been done by convolving model LFs with an amplitude distribution that is based on Galactic LPVs. While variability smooths out features in the LF, it does not completely obliterate information that can be used to probe the SFH. Indeed, the overall shape of the smoothed [5.8] LF can be used to investigate the contributions made by stars with intermediate and old ages. Comparisons between the NIR and MIR LFs and models constructed from the Bressan et al. (2012) sequences indicate that M32 is not a SSP, and must contain an old, metal-rich stellar component. Model and [5.8] LFs that assume the SFH found by Monachesi et al. (2012) match the observations in both filters. The potential limitations imposed by stellar variability notwithstanding, the results in this paper indicate that observations of more distant systems in the MIR, such as those that will be conducted with facilities such as the JWST, will prove useful for constraining the fraction of old and intermediate age stars in galaxies where other moderately bright age indicators, such as core helium burning stars, can not be resolved.
It would be of interest to investigate the NIR and MIR LFs of Local Group galaxies that contain AGB stars with ages and/or metallicities that differ from those in M32. Models predict that the rate of mass loss on the upper AGB, and hence the size of circumstellar envelopes, depends on progenitor mass and metallicity (e.g. Bowen & Willson 1991), although there is still not extensive observational evidence to support a metallicity-dependence (e.g. Lagadec 2010). The models predict that more massive, metal-rich AGB stars will have thicker, dustier circumstellar envelopes than less massive, more metal-poor objects, and the former are expected to be brighter in the MIR than the latter. Hence, a different fraction of the MIR light might be expected to originate from circumstellar sources in galaxies with mean metallicities that differ from that of M32.
We close the paper by briefly considering the origins of M32, as the analysis of the NIR and MIR data provides information that is relevant to this issue. The NIR and MIR images suggest that M32 may be structurally complex. The isophotal analysis discussed in Section 6 reveals a flattened structure in the unresolved NIR and MIR light that can be traced to within 16 arcsec of the galaxy center. The coefficient of the fourth order cosine expansion of the MIR isophotes is also indicative of a disky morphology at arcsec. These results are interesting given that Graham (2002) and Choi et al. (2002) find evidence for a diffuse disk-like distribution in the outer regions of M32.
If a disk is present then clues to its origins will be found in its stellar content. For example, a diffuse remnant of a once-larger progenitor disk might be expected to show a SFH that was truncated at the time of the events that disrupted the disk, and there might be evidence for elevated galaxy-wide star-forming activity. On the other hand, a diffuse disk that formed during cosmologically recent epochs from the accretion of high angular momentum gas that was able to cool and form stars might show a star-forming history that is distinct from the main body of the galaxy, and that continued to relatively recent epochs.
The changes in structural characteristics found here are not accompanied by an obvious radial change in stellar content. There are no large-scale gradients in absorption line strengths in M32, although fortuitous gradients in age and metallicity that conspire to negate absorption line gradients can not be ruled out (Davidge 1991; Worthey 2004; Rose et al. 2005). While in Section 4 it is shown that there is a radial gradient in the mean color of the M32 AGB sequence, this trend is consistent with progressively larger fractional contamination from stars in the outer disk of M31 towards larger distances from the center of M32, rather than a gradient in – say – mean metallicity within M32. More rigorous constraints on stellar content variations are placed by the specific frequency of bright AGB stars, which does not vary with radius out to very large radii when normalized according to either visible or NIR surface brightnesses (Davidge & Jensen 2007). The peak m brightness of AGB stars in M32 also does not change over offsets from 2 arcsec to 176 arcsec from the galaxy center (Section 4), underscoring previous studies at shorter wavelengths that have found that the brightest AGB stars are distributed throughout the galaxy. If there is a diffuse disk around M32 then it has a stellar content that is not greatly different from that of the underlying body of the galaxy.
Could M32 be a fossil remnant of a major merger? Hammer et al. (2010) investigate the possibility of a major merger between M31 and another galaxy a few Gyr in the past. In addition to producing multiple tidal features around M31, such an event can also explain episodes of elevated star formation that are evident in the age distribution of M31 globular clusters (e.g. Puzia et al. 2005), and the diverse nature of the M31 globular cluster system (e.g. Beasley et al. 2005). It has been demonstrated in this paper that the NIR and MIR photometric properties of AGB stars in M32 are consistent with significant extended periods of star-forming activity in M32 during intermediate epochs, and this is in qualitative agreement with the interaction modelled by Hammer et al. (2010). It would be of interest to determine if there are complex debris trails in the vicinity of M31 of the type predicted by the Hammer et al. (2010) simulations that are populated by AGB stars with NIR and MIR properties like those studied here.
| Filter | R | Reference | |
|---|---|---|---|
| (arcsec) | (mag arcsec-2) | ||
| BI | 29 | 19.43 (B), 17.53 (I) | Choi et al. (2002) |
| R | 32 | 18.79 | Kent (1987) |
| J | This paper | ||
| Ks | This paper | ||
| This paper | |||
| This paper |
| Filter | ||
|---|---|---|
| (r arcsec) | (r arcsec) | |
| –0.0013 | 0.0024 | |
| –0.0045 | -0.0010 | |
| –0.0007 | 0.0024 | |
| –0.0006 | 0.0033 | |
References
- (1)
- (2) Beasley, M. A., Brodie, J. P., Strader, J., Forbes, D. A., Proctor, R. N., Barmby, P., & Huchra, J. P. 2005, AJ, 129, 1412
- (3)
- (4) Bekki, K., Couch, W. J., Drinkwater, M. J., & Gregg, M. D. 2001, ApJ, 557, L39
- (5)
- (6) Bellazzini, M., Cacciari, C., Federici, L., Fusi Pecci, F., & Rich, M. 2003, A&A, 405, 867
- (7)
- (8) Bender, R., Kormendy, J., Bower, G., et al. 2005, ApJ, 631, 280
- (9)
- (10) Bernard, E. J., Ferguson, A. M. N., Barker, M. K., et al. 2012, MNRAS, 420, 2625
- (11)
- (12) Bica, E., Alloin, D., & Schmidt, A. A. 1990, A&A, 228, 23
- (13)
- (14) Block, D. L., Bournaud, F., Combes, F., et al. 2006, Nature, 443, 832
- (15)
- (16) Bowen, G. H., & Willson, L. A. 1991, ApJ, 375, L53
- (17)
- (18) Carter, D. 1978, MNRAS, 182, 797
- (19)
- (20) Chabrier, G. 2001, ApJ, 554, 1274
- (21)
- (22) Choi, P. I., Guhathakurta, P., & Johnston, K. V. 2002, 124, 310
- (23)
- (24) Coelho, P., Mendes de Oliveira, C., & Cid Fernandes, R. 2009, MNRAS, 396, 624
- (25)
- (26) Corbin, M. R., O’Neil, E., & Rieke, M. J. 2001, AJ, 121, 2549
- (27)
- (28) Dalcanton, J. J., Williams, B. F., Lang, D., et al. 2012, ApJS, 200, 18
- (29)
- (30) Davidge, T. J. 1990, AJ, 99, 561
- (31)
- (32) Davidge, T. J. 1991, AJ, 101, 884
- (33)
- (34) Davidge, T. J. 1992, AJ, 103, 1512
- (35)
- (36) Davidge, T. J. 2000, PASP, 112, 775
- (37)
- (38) Davidge, T. J. 2010, ApJ, 725, 1342
- (39)
- (40) Davidge, T. J., 2012, ApJ, 749, L7
- (41)
- (42) Davidge, T. J. 2013, PASP, 125, 115
- (43)
- (44) Davidge, T. J., & Jensen, J. B. 2007, AJ, 133, 576
- (45)
- (46) Davidge, T. J., & Rigaut, F. 2004, ApJ, 607, L25
- (47)
- (48) Davidge, T. J., De Robertis, M. M., & Yee, H. K. C. 1990, AJ, 100, 1143
- (49)
- (50) Davidge, T. J., Beck, T. J., & McGregor, P. J. 2008, ApJ, 677, 238
- (51)
- (52) Davidge, T. J., Beck, T. J., & McGregor, P. J. 2010, PASP, 122, 241
- (53)
- (54) Davidge, T. J., Puzia, T. H., & McConnachie, A. W. 2011, ApJ, 728, L23
- (55)
- (56) Davidge, T. J., Rigaut, F., Chun, M., Brandner, W., Potter, D., Northcott, M., & Graves, J. E. 2000, ApJ, 545, L89
- (57)
- (58) Davidge, T. J., McConnachie, A. W., Fardal, M. A., et al. 2012, ApJ, 751, 74
- (59)
- (60) Davies, R. L., Sadler, E. M., & Peletier, R. F. 1993, MNRAS, 262, 650
- (61)
- (62) Erwin, P., & Sparke, L. S. 2003, ApJS, 146, 299
- (63)
- (64) Evans, N. W., Wilkinson, M. I., Guhathakurta, P., Grebel, E. K., & Vogt, S. S. 2000, ApJ, 540, L9
- (65)
- (66) Fazio, G. G., Hora, J. L., Allen, L. E., et al. 2004, ApJS, 154, 10
- (67)
- (68) Fazio, G. G., Ashby, M. L. N., Barmby, P., et al. 2004, ApJS, 154, 39
- (69)
- (70) Fiorentino, G., Contreras Ramos, R., Tolstoy, E., Clementini, G., & Saha, A. 2012, A&A, 539, A138
- (71)
- (72) Fritz, J., Gentile, G., Smith, M. W. L., et al. 2012, A&A, 546, A34
- (73)
- (74) Girardi, L., Williams, B. F., Gilbert, K. M., et al. 2010, ApJ, 724, 1030
- (75)
- (76) Glass, I. S., Whitelock, P. A., Catchpole, R. M., & Feast, M. W. 1995, MNRAS, 273, 383
- (77)
- (78) Gordon, K. D., Bailin, J., Engelbracht, C. W., et al. 2006, ApJ, 638, L87
- (79)
- (80) Graham, A. W. 2002, ApJ, 568, L13
- (81)
- (82) Grcevich, J., & Putman, M. E. 2009, ApJ, 696, 385
- (83)
- (84) Grillmair, C. J., et al. 2006, AJ, 112, 1975
- (85)
- (86) Groenewegen, M. A. T. 2006, A&A, 448, 181
- (87)
- (88) Hammer, F., Yang, Y. B., Wang, J. L., et al. 2010, ApJ, 725, 542
- (89)
- (90) Hardy, E., Couture, J., Couture, C., & Gilles, J. 1994, AJ, 107, 195
- (91)
- (92) Herriot, G., et al. 2000, Proc. SPIE, 4007, 115
- (93)
- (94) Hodapp, K. W., et al. 2003, PASP, 115, 1388
- (95)
- (96) Hodge, P. W. 1979, AJ, 84, 744
- (97)
- (98) Indebetouw, R., Mathis, J. S., Babler, B. L., et al. 2005, ApJ, 619, 931
- (99)
- (100) Jarrett, T. H., Chester, T., Cutri, R., Schneider, S. E., & Huchra, J. P. 2003, AJ, 125, 525
- (101)
- (102) Jedrzejewski, R. I. 1987, MNRAS, 226, 747
- (103)
- (104) Kent, S. M. 1987, AJ, 94, 306
- (105)
- (106) Koornneef, J. 1983, A&A, 128, 84
- (107)
- (108) Kormendy, J. 1985, ApJ, 295, 73
- (109)
- (110) Lagadec, E. 2010, MSAIt, 81, 1083
- (111)
- (112) Lauer, T. R., Faber, S. M., Ajhar, E. A., Grillmair, C. J., & Scowen, P. A. 1998, AJ, 116, 226,
- (113)
- (114) Le Bertre, T. 1993, A&AS, 97, 729
- (115)
- (116) Maraston, C. 2005, MNRAS, 362, 799
- (117)
- (118) Marigo, P., Girardi, L., Bressan, A., Groenewegen, M. A. T., Silva, L., & Granato, G. L. 2008, A&A, 482, 883
- (119)
- (120) McQuinn, K. B. W., Woodward, C. E., Willner, S. P., et al. 2007, ApJ, 664, 850
- (121)
- (122) McQuinn, K. B. W., Skillman, E. D., Dalcanton, J. J., Dolphin, A. E., Holtzman, J., Weisz, D. R., & Williams, B. F. 2011, ApJ, 740, 48
- (123)
- (124) Meixner, M., Gordon, K. D., Indebetouw, R., et al. 2006, AJ, 132, 2268
- (125)
- (126) Melbourne, J., et al. 2010, ApJ, 712, 469
- (127)
- (128) Melbourne, J., et al. 2012, ApJ, 748, 47
- (129)
- (130) Melchior, A.-L., & Combes, F. 2011, A&A, 536, A52
- (131)
- (132) Monachesi, A., Trager, S. C., Lauer, T. R., et al. 2012, ApJ, 745, 97
- (133)
- (134) Mould, J., Barmby, P., Gordon, K., et al. 2008, ApJ, 687, 230
- (135)
- (136) O’Connell, R. W. 1980, ApJ, 236, 430
- (137)
- (138) Ortolani, S., Barbuy, B., Bica, E. 1990, A&A, 236, 362
- (139)
- (140) Peletier, R. F. 1993, A&A, 271, 51
- (141)
- (142) Puget, P., et al. 2004, Proc. SPIE, 5492, 978
- (143)
- (144) Puzia, T. H., Perrett, K. M., & Bridges, T. J. 2005, A&A, 434, 909
- (145)
- (146) Reach, W. T., Megeath, S. T., Cohen, M., et al. 2005, PASP, 117, 978
- (147)
- (148) Rose, J. A. 1994, AJ, 107, 206
- (149)
- (150) Rose, J. A., Arimoto, N., Caldwell, N., et al. 2005, AJ, 129, 712
- (151)
- (152) Rosenfield, P., Marigo, P., Girardi, L., et al. 2014, accepted for ApJ (astro-ph 1406.0676).
- (153)
- (154) Sage, L. J., Welch, G. A., & Mitchell, G. F. 1998, ApJ, 507, 726
- (155)
- (156) Sanchez-Blazquez, P., Gorgas, J., & Cardiel, N. 2006, A&A, 2006, 823
- (157)
- (158) Sarajedini, A., Yang, S.-C., Monachesi, A., Lauer, T. R., & Trager, S. C. 2012, MNRAS, 425, 1459
- (159)
- (160) Schiavon, R. P., Caldwell, N., & Rose, J. A. 2004, 127, 1513
- (161)
- (162) Schlafly, E. F., & Finkbeiner, D. P. 2011, ApJ, 737, 103
- (163)
- (164) Schlegel, D. J., Finkbeiner, D. P., & Davis, M. 1998, ApJ, 500, 525
- (165)
- (166) Smith, M. W. L., Eales, S. A., Gomez, H. L., et al. 2012, ApJ, 756, 40
- (167)
- (168) Stetson, P. B. 1987, PASP, 99, 191
- (169)
- (170) Stetson, P. B., & Harris, W. E. 1988, AJ, 96, 909
- (171)
- (172) van den Bergh, S. 1964, ApJS, 9, 65
- (173)
- (174) Worthey, G. 2004, AJ, 128, 2826
- (175)
- (176) Worthey, G., Faber, S. M., Gonzalez, J. J. 1992, ApJ, 398, 69
- (177)
- (178) Zibetti, S., Gallazzi, A., Charlot, S., Pierini, D., & Pasquali, A. 2013, MNRAS, 428, 1479
- (179)