Thermodynamics around the First-Order Ferromagnetic Phase Transition of Single Crystals
Abstract
The specific heat and thermodynamics of Fe2P single-crystals around the first order paramagnetic (PM) to ferromagnetic (FM) phase transition at are empirically investigated. The magnitude and direction of the magnetic field relative to the crystal axes govern the derived - phase diagram. Strikingly different phase contours are obtained for fields applied parallel and perpendicular to the -axis of the crystal. In parallel fields, the FM state is stabilized, while in perpendicular fields, the phase transition is split into two, with an intermediate FM phase where there is no spontaneous magnetization along the -axis. The zero-field transition displays a text-book example of a first order transition with different phase stability limits on heating and cooling. The results have special significance since Fe2P is the parent material to a family of compounds with outstanding magnetocaloric properties.
pacs:
65.40.Ba, 75.30.-m, 75.40.Cx, 65.40.G-First-order magnetic phase transitions (FOMT) attract attention due to their promising applications in magnetic shape memory alloys Chernenko2008 ; Enkovaara2004 , magnetic sensing based on colossal magnetoresistance Ramirez1997 , and magnetic refrigeration Tishin03 ; Gschneidner05 ; Shen09 ; deOliveira10 ; Wang:2012wg . The FOMT may be driven by temperature, pressure or applied magnetic field, and is associated with a sudden change of structure or lattice parameters, resistivity, and magnetic entropy. Anisotropy and structural distortions play important roles for the FOMT. Materials with strong magnetic anisotropy, for instance, enable unusual and highly efficient ways in tuning magnetocaloric effects Reis08 ; Nikitin10 . Di-iron phosphide, Fe2P, is a hexagonal transition metal pnictide with strong magneto-crystalline anisotropy that undergoes a first-order paramagnetic to ferromagnetic phase transition at Wappling75 ; Fujii77 ; Lundgren78 . The transition of Fe2P is magneto-elastic, with a discontinuous iso-structural change of the dimensions of the hexagonal unit cell Lundgren78 at the Curie temperature . Below the magnetic ordering occurs along the crystallograhic -axis direction Fujii77 . The thermodynamics at the phase transition is of particular interest since Fe2P is the parent compound for an entire class of tunable first-order magnetocaloric materials built on rare-earth-free constituents Dung11 .
The anisotropic magnetic and magnetocaloric properties of Fe2P were recently studied by Caron et al. Caron13b . Specific heat for polycrystalline Fe2P in zero magnetic field has been studied earlier Beckman82 . A deeper thermodynamic understanding of the FOMT is, however, lacking. In this work we report high-resolution nanocalorimetric specific heat measurements of high-quality Fe2P single crystals in applied magnetic fields both parallel and perpendicular to the -axis. We furthermore directly probe the latent heat of the FOMT. The results provide new insights into the - phase diagram of Fe2P in the region around the magnetic phase transition, illuminating the behavior of first-order systems with strong magnetic anisotropy and present a textbook example of diverging specific heat around first order transitions in general.
High-quality single crystals of Fe2P were grown in a tin melt Madar77 ; Andersson78 . Single crystal x-ray diffraction intensities in the ferromagnetic phase at were recorded on a Bruker diffractometer. The composition was refined to be Fe1.995(2)P, where only the Fe(2) site is fully occupied. Magnetization measurements were performed using a Quantum Design MPMS XL SQUID and PPMS VSM. Specific heat measurements were performed using a differential membrane-based nanocalorimeter applying an AC-method with phase stabilized frequency feedback Tagliati12 . The device allows measurements of µg size samples with both high resolution () and good absolute accuracy. Latent heat was measured with the same nanocalorimeter operating in a differential scanning mode. The single-crystal sample used for the specific heat measurements was pillar shaped (length µm) with hexagonal basal plane (edges µm).
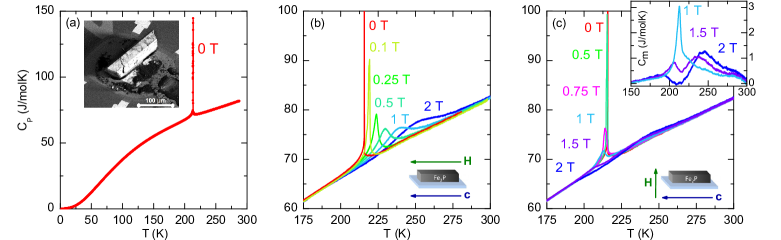
The temperature dependence of the zero-field specific heat is shown in Fig. 1(a). Specific heat values obtained by Beckman et al. Beckman82 at were used as a scale reference. The obtained sample mass agrees with the estimate from microscopy within uncertainties. The general temperature dependence and low-temperature behavior of the specific heat is in good agreement with the results in literature Beckman82 . The specific heat associated with the FOMT appears as a sharp peak at the ferromagnetic-to-paramagnetic transition with . The magnetic field dependence of the specific heat in the vicinity of the phase transition is shown in Fig. 1(b,c). For fields , the transition is broadened and shifted to higher temperatures. When , the location of the transition first appears nearly unchanged for fields below but is then split into two at higher fields, see Fig. 1(c). The lower transition shifts down in temperature while the upper shifts to higher temperatures with increasing applied field, as is evident from the inset of Fig. 1(c), showing the magnetic contribution for high fields. The background specific heat is determined as an interpolation of the lowest specific heat for any field or field direction.

To investigate the character and latent heat of the FOMT, the specific heat in zero field was measured with a small temperature oscillation amplitude on very slow heating and cooling. As seen in Fig. 2(a), there is a clear hysteresis between heating and cooling, indicating a first order transition Binder87 ; Roy2013 . By using the ac method with a small temperature oscillation amplitude on a small single crystal, the true specific heat is measured, without admixture of latent heat in the signal. At the supercooling and superheating stability limits and the system undergoes an instantaneous transition between the involved states. To quantify the latent heat of the transition, the calorimeter was turned into differential scanning mode, where the temperature difference between sample and reference calorimetric cells were measured at high speed during a slow base temperature scan. The latent heat at the transition gives rise to a sudden adiabatic temperature change of the sample and a subsequent temperature relaxation, as shown in Fig. 2(b). We find that the temperature increases by when going from high to low temperature in zero applied field, corresponding to a latent heat of or an entropy change . In magnetic fields the latent heat first decreases and finally vanishes for slightly higher than . At , the latent heat is about 15% of that in zero field. Magnetic fields , on the other hand, quickly suppress the first order character already below . As seen in Fig. 2(a), there is a divergent behavior of the zero-field specific heat on approaching the FOMT. However, this divergence does not occur around the equilibrium temperature , but at the stability limits and . This is expected for a first order transition Binder87 . The temperature dependence of is well described by a power law of the type Kim2002 ; KornblitAAhlers1973 , where , is an exponent, , and are fitting parameters for (+) using and (-) using , respectively. From fitting, using data in the reduced temperature range , we find and a ratio (not to be confused with the critical values of second order phase transitions).
When decreasing the temperature across the transition in zero magnetic field, the -axis undergoes a sudden contraction by 0.084% while the in-plane lattice parameter expands by 0.074% Fujii77 . These thermal expansions can be sensed by the thin-film thermometer of the calorimeter, acting as a thermal expansion gauge. While this method does not give absolute values of volume changes, it provides a good account for the location and character of the iso-structural transition. Figure 2(c) shows the signal from thermal expansion during cooling in magnetic fields . As seen in the figure, the magnitude of the structural transition is suppressed by the magnetic field, and the transition is broadened and shifted towards lower temperatures. The structural change in a field of still amounts to more than 60% of that in zero field, while the latent heat has been significantly decreased. From this, we conclude that the latent heat associated with the structural transition itself is at most a minor part () of the total latent heat.
To understand the nature of the observed transitions, the specific heat measurements were complemented with magnetization measurements. The field dependence of the magnetization is shown in Fig. 3(a) for (solid curves) and (dashed curves), and the corresponding temperature dependence is shown in Fig. 3(b). The results agree well with Ref. Caron13b .
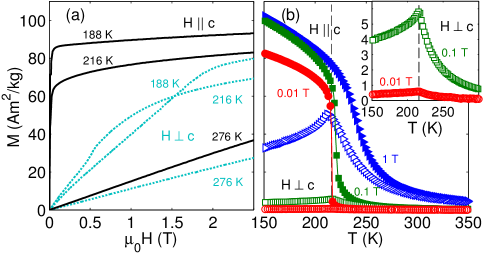
As seen from Fig. 3, the system orders spontaneously along the -axis below the Curie temperature . The sharp increase of magnetization at is accompanied by thermal hysteresis ( 1 K), indicating first-order character of the phase transition. With increasing fields along the -axis, the transition temperature to the ferromagnetic state is quickly shifting to higher temperatures. However, for the magnetization suddenly starts to decrease below , creating a cusp-shaped magnetization curve. Comparable magnetic behavior are seen, e.g., for the para-to-ferromagnetic transitions in MnP Reis08 and DyAl2 vonRanke00 ; Lima05 ; vonRanke07 . This behavior can be understood by considering the magneto-crystalline anisotropy. At low fields along the -axis, the system orders spontaneously at . A perpendicular applied field () tilts the magnetization vector away from the -axis. When the field reaches the anisotropy field, the -axis component goes to zero. At constant field the magnetization is suppressed below a certain temperature (and exhibits a cusp) due to an increasing magneto-crystalline anisotropy with decreasing temperature and the onset of magnetic ordering along the -axis.
The effects of the applied magnetic fields are well illustrated through the magnetic entropy. The magnetic entropy can be obtained from the specific heat measurements of Fig. 1 as the integral of over temperature. Putting as a reference point, the thus obtained curves for and applied along and perpendicular to the -axis are shown in Fig. 4(a).
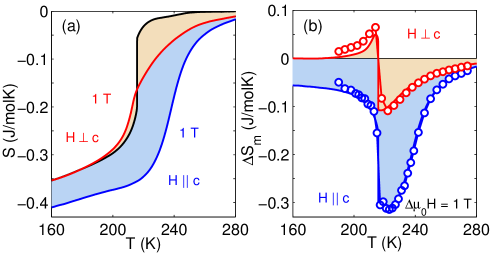
In zero field (black curve), the entropy increase due to the latent heat is added as a step function at . It is seen that the magnetic entropy for (blue curve) is lower than that of zero field, both above and below . For (hard axis) the entropy is higher than for at all temperatures.
Interestingly, is crossing at , making the low-temperature entropy for higher than that of zero field (Fig. 4(a)). This effect is clearly seen in Fig. 4(b), showing the magnetic entropy change . The magnetic entropy change due to a magnetization process can be calculated from magnetization data (Fig. 3) using Maxwell relations () Tishin03 . The thus derived are shown as open symbols in Fig. 4(b). The general behaviors of obtained from specific heat and magnetization are in good agreement, with the results from magnetic measurements giving a value 10% higher at the position of the zero field transition.
For , a strong magnetocaloric effect (entropy is decreasing with increasing field) is seen as a dip in . However, for , a positive is found below , corresponding to an inverse magnetocaloric effect. This positive magnetic entropy change reflects an increased disorder of the spin system in the temperature range where the applied magnetic field and the effective magneto-crystalline anisotropy are of equal strength (near the cusps in vs. ). Increased disorder of the spin system should be reflected in a decreased total magnetization with increasing field in this area. This is indeed seen from measurements of the total magnetization Caron13b .
The derived magnetic phase diagram for Fe2P is shown in Fig. 5. At low fields (upper panel), is shifted to higher temperatures, forming a line of first order phase transitions that ends at a critical point . Above the critical point, the continuation of the phase transition is determined from the maximum in specific heat at different applied fields (filled symbols in Fig. 5) and the maximum of at constant field (open symbols), agreeing well with each other. For the case of , lower panel of Fig. 5, the first order transition extends up to a critical or possibly tricritical point . For fields above two characteristic temperatures are observed in the magnetization and specific heat, indicated by (increasing with increasing magnetic field) and (decreasing with increasing field) in Fig. 5. The minimum in closely coincides with as obtained from specific heat. The lower characteristic temperature corresponding to is taken as the maximum in below the peak in magnetization (see Fig. 3), which decreases with increasing field and roughly coincides with the found from specific heat, as seen in the lower panel of Fig. 5.
The magnetic entropy change at the first-order part of the transition line is related to the jump in magnetization and slope of the phase boundary through the magnetic analogue of the Clausius-Clapeyron equation: . With from Fig. 3 and from the latent heat measurements, we calculate the initial slope of the phase transition line to be . From the data shown in Fig. 5 we find for fields along the -axis. For , on the other hand, there is no magnetization jump along the applied field at . Thus, is independent of for this field direction, up to the critical point where goes to zero.
To interpret the full phase diagram, first note that the zero-field transition is a combined elastic and magnetic transition from a paramagnetic (PM) phase into a ferromagnetic phase ordered along the -axis (FMc). For (Fig. 5), it is clear that magnetic fields applied in this direction stabilize the FMc phase. For at low fields (), the location of the PM-to-FMc phase boundary is unaffected by the applied field, similarly indicating that its spontaneous magnetization direction is perpendicular to the field in this case. However, at higher fields a new phase appears between and , indicated as FM⟂. This phase represents a state without spontaneous magnetization along the -axis, but with ferromagnetic order stabilized by the applied field. At the transition line the nature of the anisotropy changes from a pure uniaxial character with linear increase of the magnetization with increasing perpendicular fields into a regime with higher order anisotropy terms. This can be seen from the vs. curves in Fig. 3(a) where an increase of the field causes further alignment of the magnetization along the applied field. Such a behavior is different from the reordering transition discussed in literature Reis08 ; Becerra2000 , where the spin reordering has a first-order nature. The elastic transition is closely following the onset of magnetic ordering along the -axis, i.e., along for and for . Since the elastic transition does not bring much latent heat, it is likely that it is driven by the FMc ordering.
In conclusion, we have found that the low-field FOMT of Fe2P ends at a critical point governed by strong magneto-crystalline anisotropy. For fields applied perpendicular to the -axis, the low-temperature ferromagnetic state displays increasing magnetic entropy with increasing field, corresponding to a negative magnetocaloric effect. At higher temperatures and fields a new phase FM⟂ appears, where the -axis anisotropy becomes ineffective. This implies an orientational order (along the -axis) to disorder transition at the phase line. The structural (elastic) transition is found to be linked to this -axis ordering and exhibits associated latent heat at low fields of the total latent heat.
Acknowledgements.
Financial support from the Swedish Research Council is acknowledged (M. H., contract 2012-6562). We thank M. Fiebig (ETH) and O. Tjernberg (KTH) for hosting M. H. during his postdoc, and E. Brück, Z. Diao and V. M. Krasnov for useful discussions.References
- (1) V. Chernenko and S. Besseghini, Sensors and Actuators A: Physical. 142, 542 (2008).
- (2) J. Enkovaara, A. Ayuela, A. T. Zayak, P. Entel, L. Nordström, M. Dube, J. Jalkanen, J. Impola, and R. Nieminen, Mater. Sci. Eng. A378, 52 (2004).
- (3) A. P. Ramirez, J. Phys.: Condens. Matter 9, 8171 (1997).
- (4) A. M. Tishin and Y. I. Spichkin, The Magnetocaloric Effect and its Applications, edited by J. M. D. Coey, D. R. Tilley, and D. R. Vij (IOP Publishing Ltd, 2003).
- (5) K. A. Gschneidner Jr, V. K. Pecharsky, and V. K. Tsokol, Rep. Prog. Phys. 68, 1479 (2005).
- (6) B. Shen, J. Sun, F. X. Hu, H. Zhang, and Z. Cheng, Adv. Mater. 21, 4545 (2009).
- (7) N. de Oliveira and P. von Ranke, Phys. Rep. 489, 89 (2010).
- (8) GaoFeng Wang, Magnetic and Calorimetric Study of the Magnetocaloric Effect in Intermetallics Exhibiting First-order Magnetostructural Transitions, PhD Thesis (Universidad de Zaragoza, 2012).
- (9) M. S. Reis, R. M. Rubinger, N. A. Sobolev, M. A. Valente, K. Yamada, K. Sato, Y. Todate, A. Bouravleuv, P. J. von Ranke, and S. Gama, Phys. Rev. B 77, 104439 (2008).
- (10) S. A. Nikitin, K. P. Skokov, Y. S. Koshkid’ko, Y. G. Pastushenkov, and T. I. Ivanova, Phys. Rev. Lett. 105, 137205 (2010).
- (11) R. Wäppling, L. Häggström, T. Ericsson, S. Devanarayanan, E. Karlsson, B. Carlson, and S. Rundqvist, J. Solid State Chem. 13, 258 (1975).
- (12) H. Fujii, T. Hokabe, T. Kamigaichi, and T. Okamoto, J. Phys. Soc. Jpn. 43, 1 (1977).
- (13) L. Lundgren, G. Tarmohamed, O. Beckman, B. Carlsson, and S. Rundqvist, Physica Scripta 17, 39 (1978).
- (14) N. H. Dung, Z. Q. Ou, L. Caron, L. Zhang, D. T. Cam Thanh, G. A. de Wijs, R. A. de Groot, K. H. J. Buschow, and E. Brück, Adv. Energy Mater. 1, 1215 (2011).
- (15) L. Caron, M. Hudl, V. Höglin, N. H. Dung, C. P. Gomez, M. Sahlberg, E. Brück, Y. Andersson, and P. Nordblad, Phys. Rev. B 88, 094440 (2013).
- (16) O. Beckman, L. Lundgren, P. Nordblad, P. Svedlind, and A. Törne, Physica Scripta 25, 679 (1982).
- (17) R. Madar, P. Senateur, and R. Fruchart, 5th Internat. Conf. Crystal Growth, Boston, July 1977.
- (18) Y. Anderson, S. Rundqvist, O. Beckman, L. Lundgren, and P. Nordblad, Phys. Stat. Sol. (A) 49, K153 (1978).
- (19) S. Tagliati, V. M. Krasnov, and A. Rydh, Rev. Sci. Instrum. 83, 055107 (2012).
- (20) K. Binder, Rep. Prog. Phys. 50, 783 (1987).
- (21) S. B. Roy, J. Phys.: Condens. Matter 25, 183201 (2013).
- (22) D. Kim, B. Zink, F. Hellman, and J. Coey, Phys. Rev. B 65, 214424 (2002).
- (23) A. Kornblit and G. Ahlers, Phys. Rev. B 8, 5163 (1973).
- (24) P. J. von Ranke, I. G. de Oliveira, A. P. Guimarães, and X. A. da Silva, Phys. Rev. B 61, 447 (2000).
- (25) A. L. Lima, A. O. Tsokol, K. A. Gschneidner, V. K. Pecharsky, T. A. Lograsso, and D. L. Schlagel, Phys. Rev. B 72, 024403 (2005).
- (26) P. J. von Ranke, N. A. de Oliveira, D. C. Garcia, V. S. R. de Sousa, V. A. de Souza, A. M. G. Carvalho, S. Gama, and M. S. Reis, Phys. Rev. B 75, 184420 (2007).
- (27) C. Becerra, V. Bindilatti, and N. Oliveira, Phys. Rev. B 62, 8965 (2000).