The puzzling source IGR J17361–4441 in NGC 6388: a possible planetary tidal disruption event
Abstract
On 2011 August 11, INTEGRAL discovered the hard X-ray source IGR J17361–4441 near the centre of the globular cluster NGC 6388. Follow up observations with Chandra showed the position of the transient was inconsistent with the cluster dynamical centre, and thus not related to its possible intermediate mass black hole. The source showed a peculiar hard spectrum () and no evidence of QPOs, pulsations, type-I bursts, or radio emission. Based on its peak luminosity, IGR J17361–4441 was classified as a very faint X-ray transient, and most likely a low-mass X-ray binary. We re-analysed 200 days of Swift/XRT observations, covering the whole outburst of IGR J17361–4441 and find a trend evident in the light curve, and a thermal emission component that does not evolve significantly with time. We investigate whether this source could be a tidal disruption event, and for certain assumptions find an accretion efficiency consistent with a massive white dwarf, and a disrupted minor body mass g in the terrestrial-icy planet regime. These numbers yield an inner disc temperature of the order k keV, consistent with the blackbody temperature of k keV estimated by spectral fitting. Although the density of white dwarfs and the number of free-floating planets are uncertain, we estimate the rate of planetary tidal disruptions in NGC 6388 to be in the range to . Averaged over the Milky Way globular clusters, the upper limit value corresponds to 0.05 yr-1, consistent with the observation of a single event by INTEGRAL and Swift.
keywords:
accretion, accretion disc white dwarfs globular clusters: individual: NGC 6388 X-rays: individual: IGR J17361 44411 Introduction
The globular cluster (GC) NGC 6388 is considered one of the best candidates to harbour an intermediate mass black hole (hereafter IMBH; Baumgardt et al. 2005) at its centre. Optical observations allowed a first estimate of the IMBH mass of M⊙ (Lanzoni et al., 2007). Under the hypothesis that the IMBH is accreting the surronding matter, it is natural to expect signatures in the X-ray band. XMM-Newton and Chandra observations towards NGC 6388 showed that several X-ray sources exist in the GC centre (see Nucita et al. 2008, Cseh et al. 2010) so that a unique identification of the putative IMBH is missing.
Based on the correlation between the X-ray and radio flux from black holes (Merloni et al. 2003), Maccarone (2004) realized that radio observations may be very useful to pinpoint faint objects in GCs. Following this suggestion, Cseh et al. (2010) combined radio observations of the central region of NGC 6388 with the Chandra X-ray flux of the IMBH candidate, in order to put an upper limit () on the BH mass of M⊙. A similar result was obtained combining high spatial resolution and wide-field spectroscopy of more than 600 stars in the direction of NGC 6388 (Lanzoni et al., 2013).
A general excitement started on 2011 August 11 when the IBIS telescope (Ubertini et al., 2003) on-board the INTEGRAL satellite (Winkler et al., 2003) identified a new hard X-ray source, labeled IGR J17361–4441, close to the NGC 6388 centre (Gibaud et al., 2011). The discovery of this transient opened the possibility that we were witnessing the awakening of the IMBH.
In order to explore the nature of IGR J17361–4441 several observing campaigns, in particular in the X and radio domains (Bozzo et al., 2011), have been performed. The X-ray position obtained with Swift/XRT was consistent with the centre of NGC 6388 (Ferrigno et al., 2011). However, Chandra follow-up revealed that IGR J17361–4441 was located from the cluster centre and it was not consistent with the position of any known X-ray source (Pooley et al., 2011). The transient source in NGC 6388 was also the target of two XMM-Newton slew observations (see for details Nucita et al. 2012) which revealed a spectrum softer than that initially observed by XRT.
Based on the X-ray luminosity of erg s-1 estimated with XRT, Wijnands et al. (2011) classified IGR J17361–4441 as very-faint X-ray transient (VFXT; see Wijnands et al. 2006 for a discussion about VFXTs). Considering the location in a GC, these authors proposed the system being a neutron star (NS) low-mass X-ray binary (LMXB). However, they noted that the observed photon index of is atypical for LMXB transients in this luminosity range, where normally the photon index is around 1.6 – 2.2 (e. g. Del Santo et al. 2007; Degenaar et al. 2009).
After the discovery, Swift/XRT followed the evolution of the IGR J17361–4441 outburst for 200 days until 2011 November 5th when the source was no longer observable (Bozzo et al., 2012). We have reanalysed these XRT data (obtaining consistent results) and performed a deeper analysis of the light curve and spectral evolution.
We noted that a trend is clearly evident in the light curve and we started to investigate whether this source might be a tidal disruption event (TDE).
TDE have been observed over the years as X-ray (Komossa & Bade, 1999; Bloom et al., 2011; Cenko et al., 2012; Esquej, 2007) and UV (Gezari et al., 2012, 2009) transients. In most cases, such outbursts follow from the disruption of a star by a supermassive black hole (SMBH), which results in a powerful super-Eddington flare with a duration of several weeks. Recently, it has also been shown that such TDEs can also produce jets, resulting also in radio emission (Zauderer et al., 2011; Levan et al., 2011; Bloom et al., 2011). In a few cases, the luminosity of the outburst appeared to imply that the disrupted object was a relatively low mass object, such as a planet or brown dwarf. This is the case, for example, of the giant X-Ray Flare in NGC 5905 (Li et al., 2002), or, more recently, of IGR J12580+0134, a flare discovered by INTEGRAL in 2011 and associated with NGC 4845 (Nikołajuk & Walter, 2013).
In both cases, the best fit to the light curve implied the tidal disruption of a giant planet by a SMBH. In one other case, Campana et al. (2011) had interpreted the GRB101225A as a Galactic TDE, where an asteroid had been accreted by a NS. Such interpretation has, however, been ruled out by a redshift measurement of the source (Levan et al., 2014), that demonstrates its extragalactic origin.
Still, the sudden accretion of rocky objects by compact objects in the Galaxy is probably not uncommon. For example, there is substantial evidence for tidal disruption of asteroids by white dwarfs (WDs). To date, there are 30 published cases where debris is seen via thermal emission in the infrared (e.g. Farihi et al. 2010), and sometimes also gaseous metallic emission in the optical (e.g. Gänsicke et al. 2006), and via accreted metals in the stellar atmosphere. These circumstellar discs lie completely within the Roche limit of the stars, approximately , and are thus consistent with tidally disrupted planetesimals (Jura, 2003). The planetary nature of the disc material is given both by the abundance ratios in the polluted stellar atmospheres (e.g. Gänsicke et al. 2012), and via infrared emission of evolved solids associated with planet formation (Jura et al., 2009).
Among these polluted WDs, there appears to be evidence in support of intense accretion episodes of planetary debris (Farihi et al., 2013). Briefly, trace metals in an H-rich WD provide instantaneous measures of accretion rates, which are typically in the range – g s-1 (Koester & Wilken, 2006). On the other hand, atmospheric metals in a comparable He-rich WD give a historical average of accretion over time-scales up to yr (Farihi et al., 2009). Remarkably, while there are examples of stars with time-averaged accretion rates up to g s-1, no instantaneous accretion rate above g s-1 has yet been witnessed among many dozens of metal polluted WDs. Analysis of available data suggest that there are short-lived bursts ( yr) of high-rate accretion in these polluted WD systems, such that the product of is around g, or 1/6000 the mass of Earth (Farihi et al., 2012).
The structure of the paper is as follows. In Section 2, we briefly discuss the INTEGRAL and Swift data analysis. In Section 3, we analyse the spectral evolution and the lightcurve of the system, demonstrating a remarkable decline, typical of TDEs. In Section 4, we discuss the possible interpretation of the source: after ruling out a possible X-ray binary scenario, we concentrate on a TDE interpretation, showing that the parameter set that best describe the system indicates the disruption of a rocky object by a WD. We also discuss and rule out a possible interpretation as an extragalactic TDE in a background galaxy. In Section 5 we draw our conclusions.
2 Observation and data analysis
2.1 Swift/XRT
We have analysed the Swift/XRT observations performed on the target IGR J17361–4441 (Id. numbers from 00032072001 to 00032072038; see also Bozzo et al. 2012) for a total exposure time of 105 ks. Swift data have been analysed by using the standard procedures described in Burrows et al. (2005) and with the latest calibration files111. We processed the XRT data with the xrtpipeline (v.0.12.6) task and we applied standard screening criteria by using ftools (Heasoft v.6.13.0). The source spectra have been extracted from a circular region centred on the target nominal coordinates (with radius of ) by using the xselect routine. The background spectra were obtained from circular regions far enough from the IGR J17361–4441 position. When necessary, we corrected observations affected by pile-up (i.e. with source count rates above ct s-1). We then used the xrtmkarf task to create the ancillary response files. Of the 38 XRT spectra, we avoided to use the last six because of the low statistics. Each of the 32 spectrum has been rebinned in order to have at minimum 25 counts per channel with grppha. All fits have been performed with xspec (Arnaud et al., 2007) and errors calculated at 90 confidence level.
2.2 INTEGRAL/IBIS
We have analysed all data collected by the low energy IBIS detector, i.e. ISGRI (Lebrun et al., 2003), when IGR J17361–4441 was present in the total IBIS field of view (14.514.5∘). Observations have been performed in the period 2011 August 11 – October 22, i.e. INTEGRAL revolutions 1078–1101 for a total of 454 science windows (SCW) and 1 Ms time exposure. Data analysis was carried out with the Off-line Scientific Analysis (OSA) v. 10.0 distributed by the ISDC (Courvoisier et al., 2003). We processed data with the ibis_science_analysis task and extracted images in three energy bands: 18–40, 40–80, 80–150 keV. We did not get any detection at SCW level ( 2 ks), so that we mosaicked the 454 images in groups of 38, 39, 61, 63, 130 and 123. A significant signal to noise (above 5 ) has been obtained only in the first energy band (18–40 keV). The errors on the IBIS/ISGRI count rate have been obtained via the significance (signal-to-noise ratio) in output from the OSA software. We extracted an averaged ISGRI spectrum (53 ks) corresponding to the flat part of the XRT light curve (see Secion 3.2) by using the OSA task mosaic_spec (useful for faint sources).
2.3 Swift/BAT
The Swift/BAT survey data collected from 2004 November up to to end of 2013 retrieved from the HEASARC public archive were processed using batimager (Segreto et al., 2010). This code is dedicated to the processing of coded mask instrument data. We found that IGR J17361–4441 is detected in only one time interval, since MJD 55770 up to MJD 55828, with a statistical significance of 15 standard deviations in the 20–85 keV all-sky map. Lightcurve has been extracted with 5 days temporal bins.

3 Results
3.1 Temporal analysis
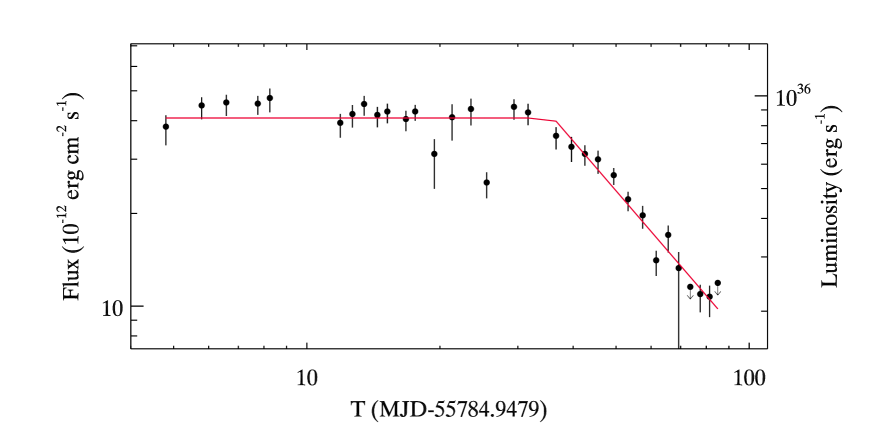
We have estimated the keV unabsorbed fluxes by fitting the 32 Swift/XRT spectra of IGR J17361–4441 with a simple power-law. Plotting the flux evolution, we noted that it could be well represented by a broken power-law. Thus, we fit the light-curve with a constant plus an exponential law (see Fig. 1). It results a plateau flux = ( erg cm-2 s-1 and a knee time of = days from the INTEGRAL trigger MJD, i.e. roughly 5 days before the first XRT follow-up observation. Then, it was very interesting to observe that after the knee the data were well fit with a law (= 1.14 with 30 d.o.f.).
In Fig. 2, the INTEGRAL/IBIS (up) and Swift/BAT (bottom) hard X-ray light curves are shown. Thanks to BAT, we found that the IGR J17361–4441 outburst was started (in hard X-rays) roughly 14 days (MJDBAT = 55770.4480) before the INTEGRAL trigger, thus implying a total event (observed) duration of 99 days, when the last XRT point (MJDstop = 55869.8738 day) is considered as the end.
3.2 Spectral analysis
Extending the XRT spectral energy range down to 0.3 keV, an additional disc blackbody component to the power-law is requested by the data. Then, the 32 XRT spectra of IGR J17361–4441 have been fit with an absorbed power-law plus diskbb (in XSPEC). The column density is constant at a mean value of cm-2 (also consistent with Bozzo et al. 2011), so that it has been fixed in our fit procedure. The evolutions of the inner disc temperature (k) and power-law slope () are shown in Fig. 3. It is interesting to note that in spite of the variation of the power-law component, i. e. an abrupt change of the power-law slope at roughly 30 days from the INTEGRAL trigger is observed, the disc temperature results constant at a value around 0.08 keV (Fig. 3).
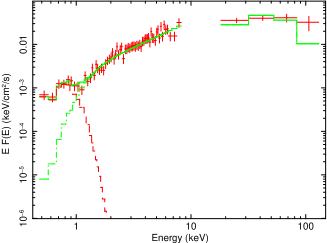
To obtain the hard X-ray spectrum up to 100 keV, we averaged the IBIS/ISGRI data corresponding to the first four bins of the light curve (Fig. 2, top). These data are simultaneous to the plateau period in the XRT light-curve, when IGR J17361–4441 did not show any spectral variation (Fig. 3). Then, we have combined the IBIS/ISGRI spectrum with one of the brighter XRT spectra and fit the broad-band spectrum with an absorbed cut-off power-law (cutoffpl) plus diskbb, obtaining parameters (see Table 1) consistent with those reported in Bozzo et al. (2011).
In addition, we fit this spectrum with a physical model by using a thermal Comptonization model (comptt in XSPEC) in place of the cutoff power law obtaining an electron population temperature of roughly 10 keV, an inner disc radius km (from the normalization of the diskbb model; Mitsuda et al. 1984) and a bolometric (0.1–100 keV) flux of about 2 erg cm-2 s-1 (see Tab. 1). Assuming a distance of 13.2 kpc (Dalessandro et al., 2008), we have estimated the bolometric peak luminosity as erg s-1.
It is known that in accreting compact objects corresponds (as first approximation) to the accretion luminosity . Thus, a lower limit to the accreted mass on to the central object can be evaluated.
We have integrated the bolometric luminosity over the time for the whole outburst duration and obtained .

| Model | k | k | (dof) | |||||
|---|---|---|---|---|---|---|---|---|
| [cm-2] | [keV] | [keV] | [keV] | erg cm-2 s-1 | ||||
| diskbb+cutoffpl | 1.0 | |||||||
| diskbb+comptt | 1.7 |
4 Discussion: what kind of source can it be?
4.1 X-ray binary scenario
Based on the peak luminosity of = erg s-1, IGR J17361–4441 has been classified as VFXT (Wijnands et al., 2011). This is a non-homogeneous class of sources characterized by a peak luminosity (in 2–10 keV) within the range erg s-1 (Wijnands et al., 2006). Very faint transients in GC are most likely LMXB with NS or BH as accreting compact object.
As discussed in details in Kulkarni et al. (1993), Portegies Zwart & McMillan (2000) and Strader et al. (2012) one expects that even if hundreds of stellar-mass BHs form in a typical GC, only a few of them survive since the others are likely ejected through dynamical interactions.
According to Kalogera et al. (2004), they are likely to have extremely low duty cycles (below about ), consistent with the absence of such an object in Galactic GC. Observational support for such picture was provided by the lack of X-ray binaries with BH in Milky Way GC until 2011, when Strader et al. (2012) proposed that two radio sources in the GC M22 are stellar-mass BH.
The possibility that IGR J17361–4441 is a binary system with a BH can be ruled out because of the low radio-to-X-ray flux ratio (see Chomiuk 2013; Bozzo et al. 2011). Ferrigno et al. (2011) reported on the ATCA non-detection of IGR J17361–4441; they inferred an upper limit of 19 at 9 GHz which translates into a luminosity at 8.5 GHz of erg s-1. We note that this value is at least a factor of 100 fainter than the typical radio luminosity observed in BH binaries with L erg s-1(see Fig. 3 in Migliari & Fender 2006). Moreover, BH transients in the hard state usually show quasi-periodic oscillation (see McClintock & Remillard 2006; Homan & Belloni 2005). These features were also observed in the very faint system Swift J1357.2–0933 (Casares et al., 2011; Armas Padilla et al., 2014). However, the power density spectrum constructed after accumulating RXTE/PCA lightcurves of IGR J17361–4441 did not show the presence of any coherent signal (against white noise) in the frequency range Hz - Hz at 3 confidence level (see Fig. 2 in Bozzo et al. 2011).
The other possibility is that IGR J17361–4441 is a LMXB with a NS accreting at very low , either with low magnetic field (possibly showing suddenly type-I X-ray bursts, i.e. burst-only sources; Cornelisse et al. 2004, Del Santo et al. 2007, Campana 2009) or with high magnetic field, i. e. an accreting millisecond X-ray pulsars (AMSP; Wijnands et al. 2008; Wijnands 2008).
However, the hard X-ray spectrum (; Tab. 1) observed at the beginning of the outburst of IGR J17361–4441 is not observed in VFXT with low magnetic field NS. Usually, these objects show in this luminosity range (see Degenaar et al. 2010 and references therein) and blackbody temperatures (when present) consistently higher than that observed in IGR J17361–4441 (i. e. 0.3–0.5 keV; see Armas Padilla et al. 2013). Moreover, the soft spectra observed at the end of the outburst are typical of the soft spectral state, which is observed in NS burster sources only when in high accretion rate regime (i.e. luminosities; Barret et al. 2000).
The possibility that the system might harbor an AMSP was proposed at the onset of the Swift observations, hypothesis which was immediately in contrast with the lack of pulsations in the PCA data (Bozzo et al., 2011). Even considering that pulsation in LMXBs might be transient as observed in Aql X–1 (Casella et al., 2008), we note that AMSPs have similar power law slopes than the non-pulsating NS and blackbody temperatures even higher, i. e. up to 1 keV (see Patruno & Watts 2012; Papitto et al. 2010). Moreover they usually do not show variations of the spectral shape at different flux levels (see Falanga et al. 2012 and references therein).
We conclude that the hypothesis either of low magnetic (burster) or high magnetic (AMSP) NS for the compact object of IGR J17361–4441 is unlikely. In addition, this is supported by the fact that neutron star transients have been observed to show (usually) quiescent luminosities of about erg s-1(see Rea et al. 2011, and references therein), i. e. higher than the upper limit of few erg s-1 derived for IGR J17361–4441.
4.2 Hints for a TDE?
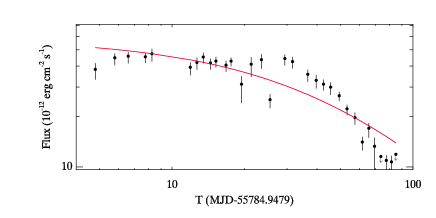
Based on the considerations reported in Section 4.1, we suggest IGR J17361–4441 being a TDE. There are two empirical evidences that point in the direction of interpreting this flare of IGR J17361–4441 as a TDE. First and foremost, the apparent decline of the light curve as , that is typical of such events, even though we can fit the expected decline only to the late light curve, while the early light curve shows a plateau which is generally not expected in TDEs. We tried to fit the light curve with a pure type law and we did not obtain a good fit (=2.3, 30 d.o.f.; see Fig. 5 ).
Secondly, several TDEs produced by the disruption of stars by a SMBH appear to be characterized by a thermal emission component that does not evolve significantly with time, as in the present case. Such component has been observed in TDEs discovered in the optical (Gezari et al., 2012; Chornock et al., 2013; van Velzen et al., 2011) and in X-rays (Donato et al., 2014; Maksym et al., 2013). A slow evolution of the thermal component is not expected from theoretical models of TDE, that imply a cooling thermal component (Lodato & Rossi, 2011), unless the fallback rate is strongly super-Eddington (Loeb & Ulmer, 1997), or unless some reprocessing of the high-energy emission by an opaque shroud of debris is invoked (Guillochon et al. 2013, which would only be able to explain the events observed in the optical).
In a TDE, the accreted mass is half of the mass of the disrupted object. According to the numbers quoted above (end of Sec. 3), we thus estimate that the disrupted minor body would have a mass of g. Even if the efficiency parameter is low, if the event is caused by accretion on to a compact object it would put the minor body in the asteroid – terrestrial planet mass range, and would thus most likely be of rocky composition.
The standard theory of TDEs (Rees, 1988; Phinney, 1989; Evans & Kochanek, 1989; Lodato et al., 2009) predicts that the debris of the disrupted object would return to pericentre at a rate given by:
| (1) |
where is the time since the beginning of the flare and is the return time of the most bound debris, given by
| (2) |
where is the mass of the compact object, is the radius of the minor body and is the tidal radius. Note the strong dependence of on the tidal radius (Sari et al., 2010; Stone et al., 2013). For an object with a density g cm-3 (appropriate for rocky bodies), the tidal radius is (Davidsson, 1999; Jura, 2003)
| (3) |
where is a numerical factor dependent on the structure of the body and is the Chandrasekhar mass. For a rocky object . Inserting equation (3) into equation (2), we obtain
where for the mass of the minor body we have used . The peak accretion rate is given by:
| (5) |
We can empirically obtain an estimate of the fallback time by the following argument: if the light curve follows exactly a decline law, then the total energy emitted, the peak luminosity and the fallback time are related by
| (6) |
where in the last equality we have used the measured peak luminosity and integrated energy of the event. Note that a fit of the lightcurve with a function of the form shown in equation (1) would not provide a good fit (since it does not reproduce well the initial plateau, as mentioned above) but would return a best fit value for in the range of 70 days, consistent with the simple estimate above. By imposing that the estimated from the observations matches the one derived from tidal disruption theory, we obtain an estimate of the accretion efficiency
| (7) |
which is consistent with the expected accretion efficiency of a WD close to the Chandrasekhar limit. With these estimate for the efficiency, we can obtain an estimate for the mass of the disrupted minor body and for the peak accretion rate as
| (8) |
| (9) |
We thus conclude that the disrupted object mass is of the order of a third Earth mass, which is in the terrestrial-icy planetary regime. With such numbers, the inner disc temperature at peak, close to the WD surface, is of the order of k keV, consistent with the blackbody temperature estimated by spectral fitting (see Section 3.2).
A critical question to be addressed is whether the disrupted material, that would initially orbit relatively far from the WD surface, would be able to accrete fast enough so that the accretion rate on to the WD matches the fallback rate given in equation (1). For this to happen, we need to require that the viscous time in the disc is much smaller than the fallback time . Two recent studies have addressed this question. Metzger et al. (2012) argue that most of the accretion occurs at a late stage after the disc formation, and estimate viscous times of the order of thousands of years. In this case, the WD would accrete at a rate much smaller than the fallback rate and the disc would shine mostly in the infrared. Conversely, Bear & Soker (2013) conclude that the energy liberated during the formation of the disc is high enough to lead to a rapid accretion of the material, which would lead to an initial spike of intense accretion at rates comparable to the fallback rate. In this case, we do expect to see the system to emit in X-rays. Thus in order to explain this source as the tidal disruption of a terrestrial planet by a WD, we need to invoke the mechanism suggested by Bear & Soker (2013).
The hard X-ray emission is interpreted to originate from inverse-Compton scattering of lower energy photons (kT keV) by high energy electrons in a hot corona (kT keV; Tab. 1) forming around the accretion flow (see also Nikołajuk & Walter 2013). This is the same mechanism which is thought to occur in all compact objects accreting matter via an accretion disc. In TDE, we do not have detailed models for the formation and evolution of the corona and the associated time-scales. On the other hand, hard X-ray emission is not uncommon in TDE candidates (Nikołajuk & Walter, 2013; Cenko et al., 2012; Burrows et al., 2011), but it is difficult to make a comparison with our IGR J17361–4441 event since they are all thought to have occurred on a SMBH.
4.3 Estimating the rate of planetary tidal disruption
In this section we estimate the rate of tidal disruption of planets by WD in the core of a GC. It should be noted that these estimates rely on a number of assumptions that are either poorly constrained observationally or poorly understood theoretically, so they should be treated with caution.
Numerical simulations have demonstrated that dissolution of planetary systems occurs on timescales that are shorter than the age of a typical open or globular clusters (Spurzem et al., 2008). We thus expect that the disruption does not follow from the deflection of a planet that is initially bound to the WD.
However the interacting object may be a free-floating planet (FFP), resulting from the dissolution of planetary systems. The retention of a population of FFP in GC is not obvious. Simple estimates based on equipartition arguments would imply that a planetary population would acquire an extremely large velocity dispersion, well in excess of the escape speed from the cluster, and would thus evaporate within a few relaxation times (note that the relaxation time for NGC 6388 is yrs at the core and yrs at the half-mass radius; Harris 1996). However, numerical simulations (Fregeau et al., 2002; Hurlay & Shara, 2002) show that a significant population of FFP is retained in relaxed systems. A possible explanation for this behaviour is due to a lack of equipartition. Indeed, again through numerical simulations including a mass spectrum, Trenti & van der Marel (2013) have shown that, as a consequence of Spitzer instability, equipartition does not occur even for relaxed stellar systems, and that the velocity dispersion depends very weakly on mass, such that . In our particular case, with a mass of a third Earth mass and an average stellar mass of , we estimate that .
The rate of tidal encounters can be simply evaluated (Binney & Tremaine, 2008; Soker et al., 2001):
| (10) |
where is the density of FFPs, is the density of WDs, is the core radius of the cluster and is the cross-section of the interaction,
| (11) |
where one has to take into account the effect of gravitational focusing, which is dominant in this case. Note that in equation 10 we assumed that the main contribution comes from the inner part of the GC, within the core radius ().
In order to estimate the rate of planetary disruptions, we need to know the number density of FFP and WD in a typical GC, both of which are very uncertain. Here, we provide a pessimistic estimate of the rate of disruptions by considering the lowest values for both parameters, and an optimistic estimate considering the highest values. For the WD number density we assume either a low value of (Raskin et al., 2009), and a high value - more appropriate for collapsed GC, such as NGC 6388 - of , in agreement with simulations performed by Ivanova et al. (2006). Estimating the number density of FFP of rocky composition is even more difficult. It has been estimated that the density of FFP in GC could exceed pc-3 (Soker et al., 2001), i.e. approximatively one per star in NGC 6388 considering the star density reported in Pryor & Meylan (1993). Indeed, N-body simulations suggested that FFPs could evolve to the current epoch with a population that exceeds the stellar population at the cluster center by a factor of (Fregeau et al., 2002; Hurlay & Shara, 2002). This is also supported by N-body simulation of planet formation performed by Ida et al. (2003). We thus assume a low value for pc-3 (i.e. ten per star) and a high value of pc-3 (i.e. 100 per star).
We take pc for the GC core radius size (Lanzoni et al., 2007) and km/s (Lanzoni et al., 2013). The tidal radius cm is estimated from Eq. (3). We thus obtain a pessimistic estimate of the rate of TDE as:
| (12) |
(where we have assumed pc-3 and pc-3) and an optimistic estimate of
| (13) |
(where we have assumed pc-3 and pc-3)
In the HST/ACS sources catalogue of NGC 6388 used by Lanzoni et al. (2007) there are 31 point sources within the Chandra error box of IGR J17361–4441. No one is a WD (Lanzoni priv. comm.). A more detailed analysis of the data available in the HST archive will be presented in a forthcoming paper. However, it is worth to note that only very bright WDs can be observable by HST in the redden core of NGC 6388 .
4.4 Extra-galactic TDE
We considered the possibility that IGR J17361–4441 has an extragalactic origin, i.e. it is due by a sudden increase in the accretion rate on an SMBH at the centre of an otherwise quiescent galaxy (see Komossa et al. 2004; Burrows et al. 2011; Saxton et al. 2012; Nikołajuk & Walter 2013).
First of all, we have estimated the number of background AGNs expected towards the target within a circle of radius through the log N–log S diagram (Hasinger et al., 2005) and by using the Chandra flux upper limit erg cm-2 s-1 (Pooley et al., 2011). Assuming a power-law model with and an absorption column density (Dickey & Lockmann, 1990), we have obtained an unabsorbed flux in the 0.5–2 keV band of erg cm-2 s-1 (by using webPIMMS v3.9222http://heasarc.gsfc.nasa.gov/Tools/w3pimms.html). The expected number of background AGNs is then . Thus, the probability of the existence of a background AGN is unlikely although not negligible.
On the other hand, we have estimated the likelihood that the event is an extragalactic TDE occurring in a background galaxy, either with an AGN activity or not. A decay time-scale of days is in agreement with the expected time-scale for the disruption of a solar type star by a SMBH. In particular we can reproduce the observed inner disc temperature at peak of k keV and a decay time-scale of 68 days if the disrupted object has a mass and the SMBH has a mass of .
The expected observed bolometric flux in this case is given by:
| (14) |
where is the mass of the disrupted star. Now, assuming a SMBH accretion efficiency of and , we can estimate the distance of the source based on the observed flux erg cm-2 s-1 and the observed decay timescale days. We then obtained Mpc, corresponding to a redshift of .
We can then use the Marconi & Hunt (2003) –MBH relation to obtain the K-band luminosity of the putative host galaxy for the assumed BH mass of . At a distance of 150 Mpc the resulting apparent luminosity magnitude would be of the order of 15. Now, such a bright and relatively nearby galaxy would be seen as extended object by HST/ACS. Indeed, the limiting magnitude for bright galaxies (above which they are observed as point sources) is around 23.3 (see Bono et al. 2010 and references therein; Blanton & Moustakas 2009). No extended source has been observed in the field of IGR J17361–4441 by HST and we can thus rule out the possibility of an extragalactic TDE.
5 Conclusion
The nature of the puzzling new INTEGRAL source IGR J17361–4441 is still unknown after a number of follow-up observations. We noted two empirical evidences typical of TDEs: a trend of the light curve and a thermal disc blackbody emission almost constant with time. Thus, we started to investigate the possibility that a minor body was tidally disrupted by a compact object. Our observational analysis and theoretical calculations indicate a free-floating terrestrial planet tidally disrupted by a WD. In particular, the mass of the disrupted body is g, while the accreting object is consistent with a WD close to the Chandrasekhar limit.
Finally, we have estimated the rate of a planetary disruption event by a WD in the GC NGC 6388: although many of the relevant parameters are highly uncertain, we estimate the rate to be in the range . The lower limit suggests that the detection of such a event in the Milky Way is unlikely. However, if we consider the optimistic estimate for the rate, and considering that the total number of GCs in the Galaxy is roughly 150, we obtain a total rate of events of about 0.05 yr-1, i.e. one every yr, comparable with the lifetime of INTEGRAL and Swift .
Acknowledgments
We acknowledge interesting discussions with Giuseppe Bertin, Piergiorgio Casella, Domitilla De Martino, Alessandra De Rosa, Immacolata Donnarumma, Giuliana Fiorentino, Barbara Lanzoni, Cristina Pallanca, Patrizia Romano, Alexander Tschekoskoy, Dimitri Veras, Andrea Tiengo, Alice Zocchi. MDS and GDC acknowledge financial support from the agreement ASI-INAF I/009/10/0 and from PRIN-INAF 2009 (PI: L. Sidoli). GL acknowledges financial support from PRIN MIUR 2010-2011, The Chemical and Dynamical Evolution of the Milky Way and Local Group Galaxies’, prot. 2010LY5N2T. MDS thanks the Mathematics and Physics Department at the University of Salento for hospitality. AN thanks INAF/IAPS for hospitality.
References
- Armas Padilla et al. (2014) Armas Padilla M., Wijnands R., Altamirano D., Mendez M., Miller J. M., Degenaar N., 2014, MNRAS, 439, 3908
- Armas Padilla et al. (2013) Armas Padilla M., Degenaar N., and Wijnands R., 2013, MNRAS, 434, 1586
- Arnaud et al. (2007) Arnaud, K., Dorman, B., & Gordon, C., 2007, ApJ, An X-ray Spectral Fitting Package - User Guide for version 12.4.0, Heasarc Astrophysics Science Division.
- Barret et al. (2000) Barret D., Olive J. F., Boirin L., Done C., Skinner G. K., Grindlay J. E., 2000, ApJ, 533, 329
- Baumgardt et al. (2005) Baumgardt, H., et al., 2005, ApJ, 589, 25.
- Bear & Soker (2013) Bear, E., & Soker, N. 2013, New Astronomy, 19, 56
- Binney & Tremaine (2008) Binney J. & Tremaine S., 2008, Galactic Dynamics: Second Edition, Published by Princeton University Press, Princeton
- Blanton & Moustakas (2009) Blanton M. R., & Moustakas J., 2009, ARA&A, 47, 159
- Bloom et al. (2011) Bloom J. S., et al., 2011, Science, 333, Issue 6039, 203
- Bono et al. (2010) Bono G., et al., 2010, PASP, 122, 651
- Bozzo et al. (2011) Bozzo, E., et al., 2011, A&A, 535, 1.
- Bozzo et al. (2012) Bozzo, E., et al., 2012, ATel, #3958.
- Burrows et al. (2005) Burrows, D. N., et al. 2005, Space Science Review, 120, 165.
- Burrows et al. (2011) Burrows D. N., et al. 2011, Nature, 476, 421
- Campana (2009) Campana S., 2009, ApJ, 699, 1144
- Chomiuk (2013) Chomiuk L., Strader J., Maccarone T. J., Miller-Jones J. C. A., Heinke C., Noyola E., Seth A. C., Ransom S., 2013, ApJ, 777, 69
- Campana et al. (2011) Campana, et al. 2011, Nature, 480, 69
- Casares et al. (2011) Casares J., Torres M. A. P., Negueruela I., Gonzalez-Fernandez C., Corral-Santana J. M., Zurita C., Llano S. R., 2011, Astron. Telegram, 3206, 1
- Casella et al. (2008) Casella P., Altamirano D., Patruno A., Wijnands R., van der Klis M., 2008, ApJL, 674, 41
- Cenko et al. (2012) Cenko S. B., et al., 2012, ApJ, 753, 77
- Chornock et al. (2013) Chornock, R., Berger, E., Gezari, S., et al. 2013, arXiv:1309.3009
- Courvoisier et al. (2003) Courvoisier T. J.-L., et al., 2003, A&A, 411, 53
- Cornelisse et al. (2004) Cornelisse R., et al., 2004, NuPhS., 132, 518
- Cseh et al. (2010) Cseh, D., et al., 2010, MNRAS, 406, 1049.
- Dalessandro et al. (2008) Dalessandro, E., Lanzoni, B., Ferraro, F. R., et al. 2008, ApJ, 677, 1069.
- Davidsson (1999) Davidsson, B. J. R. 1999, Icarus, 142, 525
- Degenaar et al. (2009) Degenaar N., & Wijnands R. , 2009, A&A, 495, 547
- Degenaar et al. (2010) Degenaar N., & Wijnands R., 2010, A&A, 524, 69
- Del Santo et al. (2007) Del Santo M., Sidoli L., Mereghetti S., Bazzano A., Tarana A., Ubertini P., 2007, A&A, 468, L17
- Donato et al. (2014) Donato D., et al., 2014, ApJ, 781, 59
- Dickey & Lockmann (1990) Dickey J. M., Lockman F. J., 1990, ARA&A, 28, 215
- Evans & Kochanek (1989) Evans C. R., & Kochanek C. S. 1989, ApJL, 346, L13
- Esquej (2007) Esquej, P., Saxton R. D., Freyberg, M. J., Read A. M., Altieri B., Sanchez-Portal M., Hasinger G., 2007, A&AL, 462, 49
- Falanga et al. (2012) Falanga M., Kuiper L., Poutanen J., Galloway D. K., Bozzo E., Goldwurm A., Hermsen W., Stella, L., 2012, A&A, 545, 26
- Farihi et al. (2009) Farihi, J., Jura, M., & Zuckerman, B. 2009, ApJ, 694, 805
- Farihi et al. (2010) Farihi, J., Jura, M., Lee, J.-E., & Zuckerman, B. 2010, ApJ, 714, 1386
- Farihi et al. (2012) Farihi, J., Gänsicke, B. T., Wyatt, M. C., et al. 2012, MNRAS, 424, 464
- Farihi et al. (2013) Farihi J., Gänsicke B. T., Koester D., 2013, Science, 342, 218
- Ferrigno et al. (2011) Ferrigno C., Bozzo E., Gibaud L., Rodriguez J., 2011,Astron. Telegram, 3566, 1
- Ferrigno et al. (2011) Ferrigno C., et al., 2011, The Astronomer’s Telegram, 3617, 1
- Fregeau et al. (2002) Fregeau J. M., Joshi K. J., Portegies Zwart S. F., Rasio F. A., 2002, ApJ, 570, 171
- Gänsicke et al. (2006) Gänsicke, B. T., Marsh, T. R., Southworth, J., & Rebassa-Mansergas, A. 2006, Science, 314, 1908
- Gänsicke et al. (2012) Gänsicke, B. T., Koester, D., Farihi, J., et al. 2012, MNRAS, 424, 333
- Gezari et al. (2009) Gezari S., et al. 2009, ApJ, 698, 1367
- Gezari et al. (2012) Gezari S., et al. 2012, Nature, 485, 217
- Gibaud et al. (2011) Gibaud, L., et al., 2011, Astron Telegrams, 3565, 1
- Guillochon et al. (2013) Guillochon J., Manukian H., & Ramirez-Ruiz E., 2013, arXiv:1304.6397
- Harris (1996) Harris W. E., 1996, AJ, 112, 1487
- Hasinger et al. (2005) Hasinger G., Miyaji T., Schmidt M., 2005, A&A, 441, 417
- Homan & Belloni (2005) Homan J., & Belloni T., 2005, Ap&SS, 300, 107
- Hurlay & Shara (2002) Hurley J, & Shara M. M., 2002, ApJ, 565, 1251
- Ivanova et al. (2006) Ivanova N., Heinke C. O., Rasio F. A., Taam R. E., Belczynski K., Fregeau J., 2006, MNRAS, 372, 1043
- Ida et al. (2003) Ida S., Kokubo E., & Kominami J., 2003, IAUS, 208, 25
- Jura (2003) Jura, M. 2003, ApJL, 584, L91
- Jura et al. (2009) Jura, M., Farihi, J., & Zuckerman, B. 2009, AJ, 137, 3191
- Kalogera et al. (2004) Kalogera V., King A. R., Rasio F. A., 2004, ApJL, 601, 171
- Klochkov et al. (2008) Klochkov D., et al. 2008, A&A, 482, 907
- Koester & Wilken (2006) Koester, D., & Wilken, D. 2006, A& A, 453, 1051
- Komossa & Bade (1999) Komossa, S., & Bade, N. 1999, A& A, 343, 775
- Komossa et al. (2004) Komossa S., et al. 2004, ApJ, 603, L17
- Kulkarni et al. (1993) Kulkarni S. R., Hut P., McMillan S., 1993, Nature, 364, 421
- Lanzoni et al. (2007) Lanzoni, B., et al., 2007, ApJ, 668, 139.
- Lanzoni et al. (2013) Lanzoni, B., et al., 2013, ApJ, 769, 2.
- Lebrun et al. (2003) Lebrun F., et al., 2003, A&A, 411, 141
- Levan et al. (2014) Levan A. J., et al. 2014, ApJ, 781, 13
- Levan et al. (2011) Levan A. J., 2011, Science, 333, 199
- Li et al. (2002) Li, L.-X., Narayan, R., & Menou, K. 2002, ApJ, 576, 753
- Lodato et al. (2009) Lodato, G., King, A. R., & Pringle, J. E. 2009, MNRAS, 392, 332
- Lodato & Rossi (2011) Lodato, G., & Rossi, E. M. 2011,MNRAS, 410, 359
- Loeb & Ulmer (1997) Loeb, A., & Ulmer, A. 1997, ApJ, 489, 573
- Maccarone (2004) Maccarone, T.J., 2004, MNRAS, 351, 1049.
- McClintock & Remillard (2006) McClintock J. E., & Remillard R. A., 2006, in “Compact stellar X-ray sources”, W. H. G. Lewin & M. van der Klis Eds., Cambridge University Press
- Maksym et al. (2013) Maksym, W. P., Ulmer, M. P., Eracleous, M. C., Guennou, L., & Ho, L. C. 2013, MNRAS, 435, 1904
- Marconi & Hunt (2003) Marconi A., & Hunt L. K., 2003, ApJL, 589, 21
- Merloni et al. (2003) Merloni A., et al., 2003, MNRAS, 345, 1057
- Metzger et al. (2012) Metzger, B. D., Rafikov, R. R., & Bochkarev, K. V. 2012, MNRAS, 423, 505
- Migliari & Fender (2006) Migliari S., & Fender R., 2006, MNRAS, 366, 79
- Mitsuda et al. (1984) Mitsuda K., et al., 1984, PASJ, 36, 741
- Nikołajuk & Walter (2013) Nikołajuk M. & Walter R., 2013, A&A, 552, 75
- Nucita et al. (2008) Nucita A. A., De Paolis F., Ingrosso G., Carpano S., Guainazzi M., 2008, A&A, 478, 763
- Nucita et al. (2012) Nucita A. A., De Paolis F., Saxton R., Read A. M., 2012, New Astronomy, 17, 589
- Papitto et al. (2010) Papitto A., Riggio A., Di Salvo T., Burderi L., D’Aí A., Iaria R., Bozzo E., Menna M. T., 2010, MNRAS, 407, 2575
- Patruno & Watts (2012) Patruno A. & Watts A. L., 2012, Review to appear in ”Timing neutron stars: pulsations, oscillations and explosions”, T. Belloni, M. Mendez, C.M. Zhang Eds., ASSL, Springer; arXiv:1206.2727
- Phinney (1989) Phinney, E. S. 1989, The Center of the Galaxy, 136, 543
- Portegies Zwart & McMillan (2000) Portegies Zwart S. F., & McMillan S. L. W., 2000, ApJL, 528, 17
- Pooley et al. (2011) Pooley, D., et al., 2011, ATel, 3627
- Pryor & Meylan (1993) Pryor C., & Meylan G., 1993, Structure and Dynamics of Globular Clusters. Proceedings of a Workshop held in Berkeley, California, July 15-17, 1992, to Honor the 65th Birthday of Ivan King. Editors, S.G. Djorgovski and G. Meylan; Publisher, Astronomical Society of the Pacific, Vol. 50, 357
- Raskin et al. (2009) Raskin C., Timmes F. X., Scannapieco E., Diehl S., Fryer C., 2009, MNRAS, 399, 156
- Rea et al. (2011) Rea N., Jonker P. G., Nelemans G., Pons J. A., Kasliwal M. M., Kulkarni S. R., Wijnands R., 2011, ApJL, 729, 21
- Rees (1988) Rees, M. J. 1988, Nature, 333, 523
- Sari et al. (2010) Sari R., Kobayashi S., Rossi E. M., 2010, ApJ, 708, 605
- Stone et al. (2013) Stone N., Sari R., Loeb A. 2013, MNRAS, 435, 1809
- Saxton et al. (2012) Saxton R. D., et al. 2012, A&A, 541, 106
- Segreto et al. (2010) Segreto A., Cusumano G., Ferrigno C., La Parola V., Mangano V., Mineo T., Romano P., 2010, A&A, 510, 47
- Soker et al. (2001) Soker, Rappaport & Fregeau 2001, ApJL, 87, 10
- Spurzem et al. (2008) Spurzem R., Giersz M., Heggie D. C., Lin D. N. C., 2008, ApJ, 697, 458
- Strader et al. (2012) Strader J., Chomiuk L., Maccarone T. J., Miller-Jones J. C. A., Seth A. C. , 2012, Nature, 490, 71
- Trenti & van der Marel (2013) Trenti M. & van der Marel R., 2013, MNRAS, 435, 3272
- Ubertini et al. (2003) Ubertini, P., et al., 2003, A&A, 411, L131.
- van Velzen et al. (2011) van Velzen S., Farrar G. R., Gezari S., et al. 2011, ApJ, 741, 73
- Winkler et al. (2003) Winkler, P., et al., 2003, A&A, 411, L1.
- Wijnands et al. (2011) R. Wijnands, Y. J. Yang, N. Degenaar, D. Altamirano, V. Tudose, C. O. Heinke, 2011, ATel #3595
- Wijnands et al. (2006) Wijnands et al. 2006, A&A, 449, 1117
- Wijnands et al. (2008) Wijnands R., Altamirano D., Soleri P., Degenaar N., Rea N., Casella P., Patruno A., Linares M., 2008, AIPC, 1068 W
- Wijnands (2008) Wijnands R., 2008, AIPC, 1010, 382
- Zauderer et al. (2011) Zauderer B. A., et al. 2011, Nature, 476, 425