Verification of the Astrometric Performance of the Korean VLBI Network, using comparative SFPR studies with the VLBA at 14/7 mm.
Abstract
The Korean VLBI Network (KVN) is a new mm-VLBI dedicated array with capability for simultaneous observations at multiple frequencies, up to 129 GHz. The innovative multi-channel receivers present significant benefits for astrometric measurements in the frequency domain. The aim of this work is to verify the astrometric performance of the KVN using a comparative study with the VLBA, a well established instrument. For that purpose, we carried out nearly contemporaneous observations with the KVN and the VLBA, at 14/7 mm, in April 2013. The KVN observations consisted of simultaneous dual frequency observations, while the VLBA used fast frequency switching observations. We used the Source Frequency Phase Referencing technique for the observational and analysis strategy. We find that having simultaneous observations results in a superior performance for compensation of all atmospheric terms in the observables, in addition to offering other significant benefits for astrometric analysis. We have compared the KVN astrometry measurements to those from the VLBA. We find that the structure blending effects introduce dominant systematic astrometric shifts and these need to be taken into account. We have tested multiple analytical routes to characterize the impact of the low resolution effects for extended sources in the astrometric measurements. The results from the analysis of KVN and full VLBA datasets agree within 2- of the thermal error estimate. We interpret the discrepancy as arising from the different resolutions. We find that the KVN provides astrometric results with excellent agreement, within 1-, when compared to a VLBA configuration which has a similar resolution. Therefore this comparative study verifies the astrometric performance of KVN using SFPR at 14/7 mm, and validates the KVN as an astrometric instrument.
1 Introduction and Basis of the SFPR Method
The interest of precision astrometry in the high frequency regime (i.e. mm-wavelengths) is at the heart of the Korean VLBI Network (KVN) design and science case. The capability to produce “bona fide” astrometrically aligned maps of emission at different frequencies provides observational evidence for a wide scope of studies. For AGN studies, the “core-shift” measurements are used as probes of the physical conditions in the innermost regions of AGN jets, and to advance the understanding of proposed jet formation mechanisms; in the Galactic domain, for studies of circumstellar envelopes and star forming regions, the relative position of maser emission from different molecular species and transitions serves to test and discriminate between proposed emission mechanisms.
While conventional “Phase Referencing” (hereafter PR) (Alef, 1988; Beasley & Conway, 1995) is an established astrometric technique, its scope of application is restricted to the cm-wavelength regime. In contrast, the “Source Frequency Phase Referencing” (hereafter SFPR) (Dodson & Rioja, 2009; Rioja & Dodson, 2011) technique achieves “bona fide” high precision Very Long Baseline Interferometry (VLBI) astrometric measurements in the frequency domain, even in the high frequency (mm-wavelength) range, where conventional PR techniques fail. The multi-channel receivers at the KVN, which enable simultaneous observations at 22/43/86/129 GHz (Han et al., 2013; Oh et al., 2011), are an ideal configuration for the application of SFPR techniques. While the KVN has been regularly observing as a stand-alone instrument (Lee et al., 2014), and together with other networks (Niinuma, 2014), for mapping purposes, its unique astrometric application is still much less explored.
The aim of this work is to verify the KVN astrometric capability using a comparative study with the NRAO Very Long Baseline Array (VLBA), a well established instrument. For that purpose we have used VLBA SFPR observations of a pair of sources at 22/44 GHz, along with KVN observations using a similar configuration, both carried out in April 2013. The VLBA observations were carried out using fast frequency switching between both bands, while the KVN used simultaneous dual frequency observations. This study will serve to deepen the understanding on the limitations imposed by the fast frequency switching observing mode (i.e. with the VLBA), and the benefits derived from simultaneous dual frequency simultaneous observations with the multi-channel receivers in the KVN. The driver for this is to investigate whether to equip global baselines with KVN-like systems or more conventional fast frequency-switching systems.
The interest and basis of the SFPR method have been described in detail in other publications (Dodson & Rioja, 2009; Rioja & Dodson, 2009, 2011; Rioja et al., 2011); most recently, the application to spectral line observations of H2O and SiO masers in evolved stars, with a non integer frequency ratio, is presented in Dodson et al. (2014). In summary, the SFPR technique provides at mm-wavelengths the benefits that conventional PR has in the cm-wavelength regime, where the moderate tropospheric phase fluctuations can be matched with the duty cycle of the telescope switching between the target and reference sources. Nevertheless, at mm and sub-mm wavelengths the faster tropospheric phase fluctuations require faster telescope source switching which, combined with the intrinsically weaker source fluxes, lower telescope sensitivity and scarcity of suitable reference sources, results in a degraded PR calibration, which prevents astrometry in general.
Alternatively, in SFPR, the tropospheric calibration is carried out using observations at a lower frequency on the same source, based on its non-dispersive nature, using fast frequency switching (with the VLBA) or simultaneous dual-frequency observations (with the KVN). Frequency switching antenna operations are faster than source switching, which allows for tracking of the dominant, highly unpredictable, rapid atmospheric fluctuations which ultimately limit the application of PR techniques; therefore it is expected that simultaneous dual frequency observations will provide the best compensation. Also, having same line-of-sight observations has important implications in the compensation of the residual zenith path length tropospheric errors, which hamper PR. The weaker source fluxes and lower telescope sensitivity constraints are also alleviated with the increased coherence time after tropospheric calibration.
For astrometric applications additional interspaced observations of a
reference source are required (i.e. “source switching”), although
the source does not need to be as close to the target nor as
regularly-sampled as for conventional PR. This compensates the
remaining, longer time scale, ionospheric and instrumental (and in
general any dispersive contribution) phase variations, which are non
negligible. Switching angles of several degrees
and switching-cycles of several minutes are acceptable.
A typical SFPR observing run consists of a few minutes-long blocks of
dual frequency observations of the target source, either with fast frequency switching, and
ideally with simultaneous observations,
preceded and followed by similar observations of the reference source.
The outcome of SFPR provides high precision “bona-fide” astrometric
registration of the brightness distributions at the observed
frequencies.
The multi-channel KVN receivers allow: precise astrometric measurements
at mm wavelengths, reaching the instrumental thermal noise limit,
as a result of the superior tropospheric compensation,;
also high sensitivity observations due to the
effective use of the observing time, of interest for weak sources.
The relatively short KVN baselines limit the astrometric accuracy in
observations of sources with extended structures, due to structure
smearing effects. This limitation might be solved in the future with longer baselines.
In this paper we present a comparative study of the astrometric measurements with VLBA and KVN at 22 and 44 GHz to validate the SFPR astrometric outcome with KVN. This dataset is part of a 2-year long series of observations with the VLBA whose scientific aim is to gain insight into the problem of the origin of jet wobbling in blazars. There is still no general paradigm to explain the phenomenon of wobbling, but it is likely that the mechanisms are tied to fundamental properties of the inner regions of the AGN because they are triggered in the innermost regions of the jets. Astrometric observations can provide the direct evidence of changes in the absolute position of the innermost region of the jet down to a level of a few tens of as. In order to achieve this, we combine SFPR observations, for a precise registration between the maps at 22 and 44 GHz, and PR observations at 22 GHz to refer these positions to an external reference. In this paper we focus on the comparative study of astrometric measurements with the two arrays for one epoch of observations. The observations are described in Section 2, the data analysis in Section 3 and the results in Section 4. A discussion of the results and ways to improve outcomes is presented in Section 5.
2 Observations
VLBA Observations: On April 3rd, 2013, we used 9 VLBA antennas for SFPR observations of a pair of sources consisting of a blazar, OJ287, and a quasar, 0854+213, 1.2 degrees away, with “fast frequency switching” observations between 22 and 44 GHz, for 4.5 hours, over a time span of 7.5 hours. The remaining 3 hours were mainly dedicated to similar observations of another pair of sources, along with occasional few minutes-long conventional PR observations of the same sources, for each pair, at 22 GHz. The latter aim at, in combination with the SFPR measurements, achieving high precision relative astrometry with respect to an external reference at 44 GHz, and are out of the scope of this paper and will be presented elsewhere.
The general layout of the observations consist of blocks of fast frequency switching. That is, alternating -minutes long scans between 22 and 44 GHz, and telescope pointing between OJ287, the reference, and 0854+213, the target, every minutes. Therefore the effective on-source time for the target (i.e. observations of the target source at the high frequency) ends up being a mere 10-15% of the total observing time, after subtracting the switching time between receivers at VLBA antennas. Finally, regular scans on a fringe finder calibrator source (NRAO150) were scheduled following the standard VLBI calibration strategy.


All stations recorded an aggregate bandwidth of 128 MHz for each scan,
subdivided into four 16-MHz channels in RHC and LHC polarization
respectively for each frequency band. The correlation was made using
the DiFX correlator in Socorro (New Mexico). Output data sets were
generated for the two frequencies, consisting of the visibility
functions averaged to 1 s, with samples every 0.5 MHz
in frequency across the bands.
KVN Observations: On April 17, 2013, we used the Korean VLBI Network (KVN) for simultaneous observations at 22 and 44 GHz of the same pair of radio sources, OJ287 and 0854+213, over a time span of 9 hours, using their multi-channel receiver. The observations followed the same sequence of sources as described above for the VLBA, alternating with -minutes long blocks between observations of OJ287 and 0854+213. The main difference being that KVN performed simultaneous dual frequency observations, while the VLBA observed using “fast frequency switching”. The former results in a much more effective use of the observing time, with longer on-source periods on each source at both frequencies. In this case, the effective on-source time for the target ends up being 50% of the observing time. These observations were also interspersed with observations of the same sources in a conventional PR mode at 22GHz, in a similar fashion as in the VLBA observations.
The three KVN stations recorded an aggregate bandwidth of 256 MHz for each scan, using eight 16-MHz channels in LHC polarization for each of the two bands, at 22 and 44 GHz. The correlation was done using the DiFX correlator with 1 s integration time and samples every 62.5 kHz in frequency across the bands.
Fig. 1 shows the uv-coverages for the KVN
and VLBA observations at 44 GHz presented in this paper, which
corresponds to the km and km maximum baseline
lengths for KVN and VLBA, respectively.
One can expect discrepancies arising from the very different uv-coverages, particularly in observations of sources with extended
structures, and in the astrometric errors. The corresponding
interferometer beams are: 800 320 micro-arcseconds (as), with PA=2o and
345 140 as, with
PA=-4o for VLBA observations at 22 and 44 GHz, respectively;
for KVN, the beams are 6.4 3 milli-arcseconds (mas), with PA=-90o,
and 3.2 1.6 mas,
with PA=-90o at 22 and 44 GHz, respectively.
The observations with both arrays were carried out at near
contemporaneous epochs,
with a difference of 2 weeks, to allow a meaningful comparative study.
3 Data Analysis
In this section we describe the analysis carried out in the VLBA and KVN datasets using the NRAO AIPS package (Greisen, 2003), for hybrid mapping and astrometric measurements. The mapping analysis for the observations of the two sources at the two frequencies is described in Sect. 3.1. The astrometric analysis is described in Sect. 3.2, following the SFPR calibration (Rioja & Dodson, 2011), and uses the hybrid maps produced in the previous mapping analysis. The SFPR-maps are the end product of the astrometric analysis. We have carried out multiple astrometric analyses as part of our comparative study and refer to them under the following headings. The labels given in this section are used through out the paper.
3.1 Hybrid Mapping
We applied standard VLBI hybrid mapping techniques in AIPS for the analysis of the VLBA and KVN observations. The analysis were carried out independently for each source, and for each frequency, following the same standard procedures. We used the information on system temperatures, gain curves and telescope gains measured at the individual antennas, to calibrate the raw correlation coefficients. The measured system temperatures by KVN were in a range of 100-130K and 140-180K for 22 and 44 GHz, respectively; the system temperatures for the VLBA were 50 K and 90-100 K, at 22 and 44 GHz, respectively.
We used the AIPS task FRING to estimate residual antenna-based phases
and phase derivatives (delay and rate) at intervals of
seconds. Next we applied the corresponding antennas phase, delay and
rate solutions to the data sets, and averaged them in time, and over
the total observed bandwidth.
Then we made hybrid maps of their brightness
distributions using a number of iterations of a cycle including the
mapping task IMAGR and phase self-calibration with CALIB.
At 22 GHz, both OJ287 and 0854+213 had direct detections within the coherence time imposed by tropospheric fluctuations, and could be imaged as described above. At 44 GHz, only OJ287 had direct detections, while 0854+213 is too weak to be detected. Nevertheless, while 0854+213 did not have direct detections at 44 GHz, the extended coherence time resulting from the frequency phase transfer calibration strategy using the observations at 22 GHz, followed by hybrid mapping techniques, allowed imaging, for both VLBA and KVN datasets. Frequency phase transfer calibration is described in more detail in the following section. The hybrid maps are presented in Section 4.
3.2 SFPR Analysis
The SFPR analysis technique preserves the relative phase information between observations at two frequency bands and enables astrometry in the frequency domain. Its implementation in the analysis consists of two steps, to eliminate non-dispersive and dispersive errors, respectively. The first step uses the antenna-based residual terms (phase, delay and rates) derived from the self-calibration analysis (i.e. with task FRING) of the data at the lower reference frequency (, here 22 GHz), to calibrate the same-source data at the higher target frequency (, here 44 GHz), after scaling the phase values by the frequency ratio; this is done for each of the two sources.
The use of the AIPS task SNCOR to scale the phase observables does not handle the situation optimally if there are multiple IFs per band. Although this might be reversed with the second FRING self-calibration run (only for the reference source) at the higher frequency for continuum observations in general, it will be an issue for spectral line analysis. Instead we used an external program written for this purpose, “use_only_mb.pl”, to scale the phase values in the SN table before being applied to the higher frequency. This first step we call Frequency Phase Transfer (FPT).
In order to avoid contamination of source structure effects in the calibration process, the corresponding hybrid maps are fed into the phase self-calibration process for both sources at 22 GHz, and for the reference source at 44 GHz. A more detailed description of the effects of the source structure in the analysis is presented in Section 3.3.
The FPT calibrated visibility phases
at the target frequency (44 GHz) should be largely free of all non-dispersive
error contributions (i.e. the effects of unmodelled perturbations
introduced by errors in the geometric and tropospheric parameters in
the “a priori” correlator models). FPT analysis with VLBA
observations requires temporal interpolation between consecutive scans
at 22 GHz, to the interleaving scan at 44 GHz, all
on the same source. This is done independently for both sources. It works under the
assumption that the duty cycle of frequency switching is shorter than
the coherence time imposed by the fast tropospheric fluctuations. We
used a frequency switching duty cycle equal to minute, which is a
typical value for the frequencies in this paper; observations with bad
weather and/or at higher frequencies would require faster switching,
which restricts the application to stronger sources. Note that this is
not an issue with simultaneous dual-frequency observations.
Moreover, the residual rates should be kept under a certain limit to
avoid phase ambiguity problems during the temporal interpolation. This
limit corresponds to a phase change of at the lower frequency,
during the duty cycle of frequency switching; in our case we estimate
a limit of 4 mHz at 22 GHz for 1-minute duty cycle observations at 22/44
GHz. If larger rates are present, as it was the case in the VLBA
observations, correction of the data is required before the analysis.
For example, we manually corrected constant instrumental residual rates equal to 30
and 4 mHz in the
correlated data for two stations, MK and OV, respectively, with CLCOR (parameter opcode ’cloc’;
and clcorprm (1)). The residual rates for the rest of stations were
much smaller. Note that, in general, the rate threshold will
decrease with increasing values of . This is not an issue with simultaneous dual
frequency observations with KVN, which makes the procedure simpler and
reduces the impact of errors.


Fig. 2 showes the FPT visibility phases for OJ287 and 0854+213 from VLBA observations, at 44 GHz. The alignment of the phases is superior for the OJ287 dataset as a result of a much higher signal-to-noise ratio (SNR); while the observations of 0854+213 are more noisy, the phases appear aligned and following the same trend as for OJ287. It should be noted again here the absence of detections on the observations of 0854+213 at 44 GHz using direct self-calibration analysis, while the FPT analysis enables longer integration times, as seen in the smooth trend of phases, and allows hybrid mapping.
The loss of coherence on the longest baselines to SC and MK stations is significantly larger than for shorter baselines and these have been excluded from the analysis. The same applies to the start of the observations with lower elevations. Nevertheless this effect does not appear for the self-calibrated dataset. While such a degradation in the coherence could be explained as a consequence of larger phase errors due to lower correlated amplitudes, this is unlikely as the self-calibrated dataset is unaffected; we believe it is due to the higher rates, which increase the impact of errors from the temporal interpolation required in “fast frequency switching” observations. The latter contribution is not an issue with simultaneous dual frequency observations.
Fig. 3 shows the FPT visibility phases for OJ287 and 0854+213, at 44 GHz, for observations with the KVN. The long term temporal sequence of FPT phases is less smooth, compared with the VLBA dataset shown in Fig. 2. The phase jumps that occur in the KVN visibility phases are related to changes in the observing mode in the schedule. Namely, changes between simultaneous dual frequency observations at 22/44 GHz, to single frequency observations for conventional PR. The system does not return to the identical phase state after this change. Nevertheless, these offsets are common for both sources and hence are compensated automatically in the second step of the SFPR analysis.


For VLBA observations, the scatter of FPT phases is about twice as large than for the self calibrated phases at 44 GHz, for OJ287. Instead, for the KVN, the scatter of FPT phases is similar to that for the self calibrated phases at 44 GHz. This is indicative of the superior quality of atmospheric compensation using simultaneous dual frequency, compared to fast frequency switching, observations.
The second step of calibration aims at eliminating the remaining unwanted dispersive errors after FPT calibration. It resembles the conventional PR technique in the sense that it involves the observations of a second source. In practice it uses the antenna-based residual terms derived from the (self-calibration) analysis of the “reference” source (OJ287) at 44 GHz, after FPT calibration, to correct the FPT dataset from the other “target” source (0854+213) at the same frequency. This works under the assumption that the angular separation between the sources is smaller than the ionospheric isoplanatic patch size (i.e. the unmodelled effects introduced by the ionospheric propagation on the observed phases of both sources are not very different, under 1 radian) and that they are observed with a duty cycle less than the temporal structure of ionospheric variations; also that any instrumental terms are common for the observations of the two sources. The outcome are the so-called SFPR visibility phases and are the end product of the calibration process. The resultant SFPR calibrated phases of 0854+213 at 44 GHz should be free from the dispersive and non-dispersive errors mentioned above, but still retain the desired signature of the frequency dependent position. Note that in order to preserve this astrometric signature no self-calibration analysis has been carried out on the observations of 0854+213 at 44 GHz.
Fig. 4 shows the SFPR visibility phases of 0854+213, at 44 GHz, from the analysis of VLBA observations. In essence they are the difference between the values of the phases for both sources shown in Figs. 2. Similarly for the KVN, Fig. 5 shows the SFPR visibility phases for 0854+213, at 44 GHz. The Fourier transformation of the SFPR calibrated visibility functions produces a SFPR-map. The offset of the brightness distribution from the centre of this map is astrometrically significant; it is a measurement of the relative (or combined)“core-shift”, between 22 and 44 GHz, for the two sources. The SFPR maps and astrometric measurements are presented in Section 4.

3.3 Source Structure effects in KVN Astrometric Analysis
In astrometric studies of extended radio sources their structural
phase contribution needs to be accounted for. If uncorrected, this
contribution will propagate into astrometric errors. In the analysis
of conventional PR observations with AIPS, this is usually implemented
by providing the map of the reference source as an input for the self
calibration algorithm (i.e. FRING). This insures that the estimated
antenna-based solutions transfered to the target source are free of
structure effects from the reference source. Then, the offset of the
peak of brightness in the PR map with respect to the origin of the
map, is an astrometric measurement of the angular separation between
the two sources; namely, between this peak component and the component
at the centre of the reference source map. These components
are therefore called “reference points”. The same situation applies to the
SFPR analysis. The selection of reference points is
arbitrary, however, for studies involving multi epoch or multi
frequency observations it is essential to select reference points that
can be identified across all maps. Failure to identify the same
reference points in maps at different epochs or at different frequencies
will lead to erroneous measurements of the proper motions or
core-shifts, respectively.
This is not always easy, even for the comparison of observations with the same resolution at different epochs. Structural changes below the resolution limit would be blended together and are equivalent to shifting the reference points for the astrometric analysis, hence the astrometric results would also be shifted. Furthermore, when comparing observations with different resolutions, i.e. observations at different frequencies with the same array, or observations from different arrays, systematic errors arising from differential structure blending effects require special consideration.
In particular, for the case study of this paper, the much lower resolution of the KVN will result in blending of the structure features visible in the high resolution VLBA maps into a single unresolved component. In order to investigate the incidence of source structure effects in KVN observations we have carried out parallel analysis, using compact source models (labelled KVN i) and using the high resolution maps from the nearly contemporaneous VLBA observations (labelled KVN ii, KVN iii). For KVN ii), the VLBA hybrid maps of OJ287 and 0854+213 at 22 GHz have been used as inputs in AIPS task “FRING”, for self-calibration of KVN observations of each source, at 22 GHz. Then the VLBA hybrid map of OJ287 at 44 GHz is fed into the FRING run on the OJ287 FPT dataset at 44 GHz for final SFPR calibration of 0854+213 at the same frequency. While the previous steps serve to identify common reference points in those 3 maps for the KVN and VLBA analysis, the position of the peak of the SFPR map generated with AIPS task “IMAGR” is still affected by the centroid shift due to convolution with the KVN resolution. In order to address this final point, in KVN iii) analysis, we have used the AIPS task “UVSUB” (opcode “div”) and the VLBA hybrid map of 0854+213 at 44 GHz to remove the structure contribution from the SFPR visibility data prior to Fourier inversion with “IMAGR”. The so-called KVN iii) analysis is meant to have common reference points in all the 4 maps. Following this strategy, the KVN SFPR map corresponds to the measurement of the separation between the “core”-components in the high resolution maps shown in Fig. 6. The results from the multiple analysis are presented in Section 4.
3.4 Matching resolutions with short VLBA baselines
Whilst we have investigated using the high resolution VLBA maps in the astrometric analysis of KVN observations (i.e. KVN ii, KVN iii) to allow for a direct comparison of measurements with both arrays, such an approach is always questionable. The uv-coverage for the KVN observations mostly lie within the unsampled inner hole of that for the VLBA observations, so large scale structure from extended sources that are relevant to the KVN visibility data could be filtered out in the VLBA observations; this would lead to residual structure contributions, and astrometric shifts.
In another attempt to reduce the impact of differences in the uv-coverages, we have selected a subset of the VLBA observations that approach the resolution of KVN observations (while containing enough uv-points for analysis). The subset comprises visibility data from baselines whose projection in the uv-plane is less than 80M at 44GHz (see Fig. 1). This includes data from 4 VLBA antennas (FD, KP, PT and LA), and a resulting beam equal to 2.1 1.6 mas, at PA=580, at 44 GHz. For comparison, the KVN beam is 3.1 1.6 mas, at PA=900. We have carried out SFPR astrometric analysis using 3 and 4 high resolution maps, in a similar fashion as for the KVN analysis described in Sect. 3.3. We label the SFPR astrometric analysis carried out in this subset of VLBA observations VLBA Short ii) and VLBA Short iii), respectively. The results are presented in Section 4.
3.5 Astrometric Error Analysis
We have carried out an error analysis to estimate the uncertainties in
the SFPR measurements presented in this paper, for VLBA and KVN
observations. Below we provide a description of the various
contributions based on the analysis in Rioja & Dodson (2011) and Rioja et al. (2011):
Angular Resolution and SNR: The spatial resolution and
sensitivity of the observations are fundamental to considerations of
the position error in the identification of reference points in the
maps. A standard calculation (Thompson et al., 2007) of the corresponding
astrometric error is given by: p = /SNR, where
is the angular resolution of the observations, and SNR
stands for the ratio between the peak of brightness in the map and the
noise level in a region away from the meaningful source structure. We
refer to this type of contribution as “thermal errors”. The VLBA
resolution at 44 GHz is 730 250as at PA = after
excluding SC and MK antennas, which had very noisy phases in the SFPR
analysis; the KVN resolution is 3.1 1.6 mas at
PA=. Therefore, based only on the spatial resolution, the
thermal (random) errors in the KVN astrometric measurements are about
four times larger than for the VLBA. The expected values for the noise
in the SFPRed maps generated with VLBA and KVN are
comparable (within 10%, with lower
noise for VLBA), following from the formula (Wrobel, 1995; Wrobel & Walker, 1999):
Jy/beam
where or “system equivalent flux density” is the system noise
expressed in Janskys, is the efficiency related to data
recording, is the number of antennas, is the recorded
bandwidth in Hz and is the total integration time on-source
in seconds. The number of antennas is 7 for VLBA, and 3 for KVN,
observations; the bandwidth is the same for both arrays; the is
a factor higher for KVN, and the on-source time is a factor
longer for KVN, with respect to VLBA. Therefore, for
example, given a SNR=50, the estimated “thermal errors” are as for the VLBA, and as for the KVN.
Semi-random small scale tropospheric errors: The estimated residual tropospheric phase rms errors from uncompensated fast tropospheric fluctuations in observations with the VLBA, using “fast frequency switching” between 22/44 GHz with a duty cycle of 60 seconds, range from for good weather, to for poor weather conditions (Rioja & Dodson, 2011). For comparison, simultaneous dual frequency observations with KVN result in no tropospheric errors as the duty cycle is in effect zero. The effect of random errors in the VLBA analysis are expected to decrease the peak flux value, while increasing the level of noise, in the SFPR map. Nevertheless, while this will affect the SNR in the map, they should not affect the astrometric results on a significant level (Rioja et al., 2011).
Systematic large scale tropospheric errors: The systematic tropospheric delay errors arising from uncertainties in the “a priori” estimates of the tropospheric zenith delay are a major contribution to astrometric errors in conventional PR observations. These are compensated in SFPR observations because of the same line-of-sight (i.e. same source) observations at the two frequencies. This is a great benefit compared to conventional PR where the observations are of two sources along different lines-of-sight. In PR a great effort is devoted to achieve an accurate “a priori” value for the zenith tropospheric delay in order to minimize, and even make possible, phase referencing (Honma et al., 2008). Instead, the SFPR technique removes this constraint, using dual frequency observations of the same source. As for any of the remaining, much smaller, dispersive tropospheric errors (Hobiger et al., 2013; Liebe et al., 1993), these can be compensated with the second cycle of calibration involving the observations of another source. Therefore, this error contribution is insignificant for both the VLBA and KVN observations presented in this paper.
Ionospheric errors: The estimated ionospheric residual phase errors, arising from typical values for the small and large scale unmodelled ionospheric fluctuations, are negligible, for the VLBA and KVN observations presented in this paper (Rioja & Dodson, 2011).
Systematic Structure-related errors: There are two structure-related aspects that can contribute to systematic errors in the KVN astrometric measurements for extended sources: poor mapping fidelity with three antennas, and structure blending resulting from low resolution. The former results in residual unmodelled phase structure contributions that can “contaminate” the calibration process, as explained in Section 3.2. In general, the latter will have a much more significant impact on the astrometric measurements. Its magnitude will vary on a “case-by-case” basis as described in Section 3.3, and can be the dominant source of astrometric errors in observations with high SNR and extended source structures. In the KVN observations presented in this paper, having the high resolution maps (from the VLBA observations) allows one to measure the magnitude of the shift in the reference points due to structure blending effects, which can be used to correct the astrometric measurements. As an example, for the particular pair of sources of interest to this paper, the magnitude of this effect is large (up to as) for 0854+213 (see Fig. 9); for OJ287 the effect is much smaller. For the general case when no high resolution maps are available, the astrometric error budgetting needs to take this effect into account. Note that observations of compact sources are free of these effects. For VLBA observations, the larger number of antennas and longer baselines greatly reduces the impact of these aspects; in this case, further insight into the effect of sub-beam structure into astrometric measurements can be gained from super-resolution maps. The VLBA super-resolution maps of the sources of interest for this paper are presented in Sect. 4.1.
Regarding our comparative study, differential structure blending effects arising from the very different spatial resolutions are expected to be the dominant source of differences in the astrometric measurements with the VLBA and KVN. The origin of these differences lies in the misidentification of the same reference points in the presence of extended source structure, and differences in uv-coverage, as described in Sects. 3.3 and 3.4. We have attempted to minimize and quantify their impact in this comparative study by carrying out multiple analyses, using VLBA maps to eliminate the structure contribution in the KVN analysis (KVN ii, KVN iii), and matching the spatial resolutions (VLBA Short ii, VLBA Short iii). The results of these analysis are presented in Sect. 4.2.
4 Results
4.1 Hybrid Maps
The KVN maps for the two sources at 22 and 44 GHz consists of unresolved single components. Fig. 6 shows the hybrid maps for OJ287 and 0854+213 at 22 and 44 GHz, from VLBA observations. The maps were obtained using conventional self calibration algorithms, except for 0854+213 at 44 GHz that was only recoverable after the increased coherence time from FPT analysis, which allowed one to run FRING with a solution interval of 5-minutes (i.e. 10 times longer). Fig. 7 shows the resultant visibility phases, which produced the map of 0854+213 at 44 GHz shown in Fig. 6. The VLBA maps show the typical “core-jet” extended structure. In all maps, the peak of brightness corresponds to the VLBI “core” component and is the “reference point” selected for the astrometric analysis.


Other maps of interest for the systematic structure-related errors listed in Sect. 3.5 are shown in Fig. 8 and in Fig. 9. The first one corresponds to the super-resolved VLBA maps for OJ287 and 0854+213 at 22 and 44 GHz, restored with a circular beam of 0.15 mas. The super-resolved map of OJ287 at 44 GHz is split into two components, with fluxes 1.8 and 1.7 Jy, and a relative separation of 95 and 145 as in right ascension and declination, respectively (model parameters derived using AIPS task JMFIT). The second figure shows the VLBA maps of 0854+213 at 22 and 44 GHz restored with the corresponding KVN-like beam at each frequency. The shift of the peak with respect to the center of each map is an estimate of the shift of the “reference points” (with respect to the “core” component in the high resolution maps) due to structure smearing effects arising from the lower KVN resolution. The shift is largest for 0854+213 at 22 GHz, -225 and -80 as, in right ascension and declination, respectively; at 44 GHz, the values of the shift are -165 and -69 as. The corresponding maps for OJ287 at 22 and 44 GHz show unresolved components with much smaller shifts, all under 30as. These shifts are expected to have a direct impact on the astrometric measurements from both arrays.


4.2 SFPR Outcomes: Maps and Astrometric Measurements
Fig. 10 shows the so-called SFPR map of 0854+213 at 44 GHz, which corresponds to the Fourier Transformation of the SFPR 7-antenna VLBA visibility data shown in Fig. 4. The flux recovery, defined as the ratio between the peak fluxes in the SFPR map, and after a self-calibration run with CALIB, is 88%, and the peak flux and rms map noise are 96 and 2 mJy/beam, respectively. The flux recovery serves as a figure of merit to quantify the incidence of random phase errors into the analysis, which is estimated to be (following the formula , Thompson et al. (2007)). This value is in agreement with our theoretical estimate of residual phase errors arising from uncompensated fast tropospheric fluctuations under good weather conditions, in Sect. 3.5. Note that the maps shown in Fig. 6, for both sources at 22 GHz and for OJ287 at 44 GHz, have been used to generate structure-free observables in both phase-transfer steps (i.e. between frequencies, and between sources), of the SFPR analysis, respectively. This analysis is labeled as VLBA Full i).

Figs. 11 a) b) and c) shows the KVN SFPR maps of 0854+213 at 44 GHz, from analysis with different source models to compensate for the structure contribution: i) using a single component model (label KVN i, as explained in Sect. 3.3), ii) using the high resolution VLBA maps of OJ287 at 22 and 44 GHz, and of 0854+213 at 22 GHz shown in Fig. 6 (label KVN ii), and iii) same than ii), plus the map of 0854+213 at 44 GHz with UVSUB (label KVN iii). The flux recovery in the KVN maps is %, and the peak flux and rms map noise are 135 and mJy/beam, respectively.


Similar analysis to types ii) and iii) were carried out using a low resolution VLBA subset, with a limited uv-range under 80M to match the resolution of KVN. The VLBA subset was generated using AIPS task UVCOP, and parameter uvrange, with a resulting beam 2.1 1.6 mas, with PA=58o. This subset was selected to match a similar resolution to the KVN (3.2 1.6 mas), while maintain a reasonable number of data points. These analysis were labeled VLBA Short ii) and VLBA Short iii) respectively.
In all cases, we used the AIPS task MAXFIT to measure the offset of the peak of brightness in the SFPR maps with respect to the center of the map. MAXFIT defines the location of the peak in a given map region by fitting a quadratic function to the peak pixel value and those of the adjacent pixels. This offset conveys the astrometric measurement of the “core-shift” between 22 and 44 GHz, for the two sources.
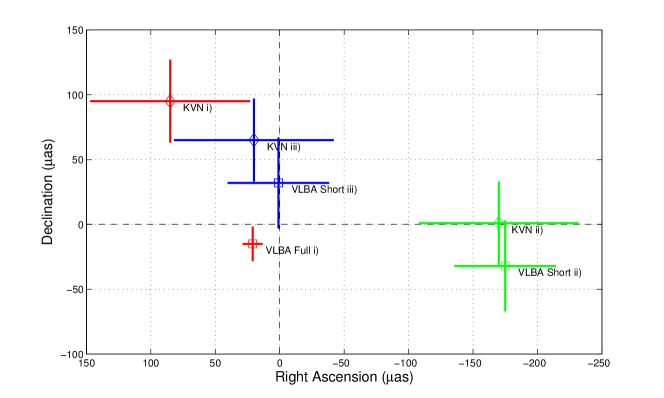
Fig. 12 shows the compendium of SFPR astrometric measurements resulting from the multiple analysis of the VLBA and KVN observations described above. Each point is a measurement of the change in the positions of the selected “reference points” in the maps of 0854+213 at 44 and 22 GHz, minus the corresponding change for OJ287. The plotted error bars are the “thermal errors” estimates (see Sect. 3.5), /SNR, projected into the right ascension and declination axis. Their magnitudes are 62 and 32 as, respectively, for all KVN analysis; for VLBA analysis, 8 and 13 as, respectively, for the high resolution analysis, and 39 and 35 as, for the subset with low resolution.
| Array | SFPR Astrometry (as) | Astrometric Error (as) | Analysis Label | ||
| KVN | +85 | +95 | 62 | 32 | KVN i) |
| KVN | -170 | 0 | 62 | 32 | KVN ii) |
| KVN | +20 | +65 | 62 | 32 | KVN iii) |
| VLBA | +21 | -15 | 8 | 13 | VLBA Full i) |
| VLBA | -175 | -32 | 39 | 35 | VLBA Short ii) |
| VLBA | 0 | +32 | 39 | 35 | VLBA Short iii) |
Note that the astrometric measurements from the KVN and the short VLBA baselines datasets, which have similar resolutions, are in good agreement within the “thermal error” bars of the measurements, for types ii) (in green) and iii) analysis (in blue). For type ii), the westward shift agrees with the centroid shift in the low resolution map of 0854+213 at 44 GHz shown in Fig. 9.
5 Discussions and Conclusions
The KVN is a new dedicated mm-VLBI instrument with innovative multi-channel receivers for the compensation of propagation effects in the observables. We have evaluated the KVN astrometric performance by using comparative studies of nearly contemporaneous SFPR observations with the KVN and the VLBA, at 22/44 GHz. The astrometric measurements from both arrays agree within the 2- error bar estimates derived purely from the random thermal noise contribution (i.e. from the beamwidth and dynamic range in the map). Systematic differences are nevertheless expected, due to differential structure blending effects arising from the large differences in resolutions between VLBA and KVN observations and the structure of the observed sources. These effects result in misidentification of common reference points within the source structures, which in turn lead to differences in the astrometric measurements between the arrays, and therefore undermine the use of comparative studies as a tool to evaluate the astrometric performance of KVN. The magnitude of this effect is strongly dependent on the source structure and the size of the interferometer beam in comparison to that extended structure. It is largest for extended and small for more compact sources. We have explored the routes to compensate for these systematics; in particular to use the four high resolution VLBA hybrid maps for the estimation of the source structure contribution in the astrometric analysis of KVN observations. The KVN measurement from this other analysis (label KVN iii) appears shifted, with respect to that from before (label KVN i), by a significant amount in the direction of the VLBA result, showing a residual dominantly North-South discrepancy between the results from the two instruments. The magnitude of the shift is and as in the right ascension and declination coordinates, respectively, and agrees in magnitude and direction with the change between the positions of the centroids in the VLBA maps of 0854+213 at 22 and 44 GHz when convolved with the corresponding KVN beams (see Fig. 9). This highlights the importance that structure blending effects will have in astrometric studies with the KVN, and provides a way for estimating their magnitude, providing high resolution images are available. Also, it can serve as a guideline for estimating plausible systematic error contributions that need to be taken into account in the error analysis when no contemporary high resolution images are available. Along the same lines we interpret the residual north-south discrepancy in the astrometric measurements as a consequence of imperfect structure compensation in KVN observables using the VLBA maps. This is based on the alignment between the astrometric discrepancy and the structure in the super-resolved image of OJ287 at 44 GHz (see Fig. 9). However we do not have such a clear demonstration of this as there was for 0854+213. In this case the offset could be either due to structural changes undergone in one or both of the sources in the few days between the VLBA and KVN observations, or due to the differences in the structure spatial frequencies sampled by both arrays. It could also be a combination of these effects. There is no overlap between the KVN uv-sampling and the VLBA uv-sampling, hence it is possible that there may be large scale structure that the KVN responds to, which is filtered out in the VLBA observations. In order to eliminate the possibility of KVN-specific effects as the reason for the discrepancy between the astrometric measurements, we carried out another comparative analysis on datasets with similar resolutions from both arrays (label VLBA Short iii). This type of analysis minimizes the impact of systematic effects arising from different resolutions and allows a direct comparative study. The new astrometric solution for the short-baseline VLBA subset (with a beamwidth 30% smaller than for the KVN) is shifted northwards with respect to that from the full VLBA dataset, in the direction of the KVN astrometric result. The low resolution measurements with KVN and VLBA agree within 1- of the purely thermal noise error estimate. This proves that low resolution-related effects are responsible for the residual discrepancy between KVN and full VLBA datasets, and not any KVN-specific issues. Therefore we conclude that our comparative study verifies the astrometric performance of KVN observations using SFPR technique at 22/44 GHz, and validates the use of KVN observations for astrometric studies.
Both observing strategies, fast frequency switching and simultaneous dual frequency observations, had a good performance for tropospheric compensation at 22/44 GHz, with flux recoveries of 88% and 94% for the VLBA and KVN SFPR maps of 0854+213, respectively. Nevertheless it is worth emphasizing aspects of the analysis which high-light the advantages of simultaneous observations. The scatter of the FPT visibility phases (i.e. calibrated with solutions at 22 GHz) and the self-calibrated phases are similar for KVN observations of OJ287 at 44 GHz; for VLBA, the scatter of FPT phases are a factor larger. This is indicative of the simultaneous observations providing a superior compensation of the tropospheric fluctuations in the observables compared to fast frequency switching. Although a rigorous comparison would require identical weather conditions for both arrays when following the different observing strategies, this result is compatible with the expected degradation of the tropospheric calibration introduced by the temporal interpolation required in fast frequency switching observations with a 1-minute duty cycle. Also, it is noticeable that there is an increasing degradation of the quality of phase referencing with longer VLBA baselines. While this trend could be expected from the lower SNR due to resolving the source, it is aggravated by the increasingly large phase rates on these baselines. The frequency switching strategy places restrictive limits on the maximum rates which can be allowed, to avoid ambiguity problems in the interpolation; this is not an issue for simultaneous observations. Another important benefit of simultaneous observations is the increase of effective “on-source” time. For example, the KVN “on-source” time is a factor longer than the VLBA “on-source” time, for a given interval of observing, for the observations presented in this paper. This corresponds to an increase in the sensitivity by a factor , and will have an impact in the noise in the SFPR map, the minimum flux of detectable sources and, ultimately, in the astrometric uncertainties. Our experience from the data analysis is that the simultaneous observations using the multi-channel receivers at the KVN is significantly more robust, removes the propagation of errors resulting from the temporal interpolation and can be expected to make a difference in the application to long baselines. The significance of these benefits is expected to increase for observations at higher frequencies. In general, the success of the SFPR technique is critically dependent on the frequency switching cycle between the two observing frequencies, with faster rates required at higher frequencies. This sets a practical upper limit on the frequencies that can be used with a frequency switching strategy; for a cycle time of one minute this will be around 86 GHz. Our previous SFPR observations with VLBA at 43 and 86 GHz (Rioja & Dodson, 2011) using “fast frequency switching” suffered significantly from uncompensated tropospheric residuals; we expect this would be alleviated with simultaneous dual frequency observations. Recent observations with KVN at four frequency bands 22/43/86/129 GHz will allow us to investigate this at the highest VLBI frequencies, where we expect that having simultaneous multi-frequency observations will be mandatory. Therefore we conclude that there are significant benefits from using simultaneous frequency observations for wider astrometric application: simultaneous frequency SFPR will work at higher frequencies, with weaker sources, and under a wider range of weather conditions.
The multi-channel receivers installed at KVN antennas provide an optimum compensation of tropospheric fluctuations and hence have the potential for very high precision astrometric measurements using SFPR techniques. KVN can reach accurate and precise astrometric measurements to a level of a few tens of as in observations of compact sources. On the other hand, the limited mapping capability of KVN with 3 antennas and the relatively short baselines lead to a degradation of the astrometric accuracy in observations of extended sources. These are dominated by systematic structure blending effects. A way to improve the overall situation is to increase the number of observing antennas and the baseline lengths. For example a global network of antennas with the capability of simultaneous dual frequency observations similar to those of the KVN, carrying out SFPR observations at 129 GHz, would have a resolution of as and would reach astrometric precisions of a few as. These unprecedented levels of precision match the requirements for investigation of the innermost regions of AGN jets, closer to the Black Hole, in exquisite detail. Moreover, the extra sensitivity gained from the increased coherence time after compensation of tropospheric phase fluctuations would turn it into an ultra sensitive high precision astrometric instrument. Therefore global observations with KVN-like antennas opens the possibility to tackle new fields of science, for example studies of the shadows of black holes. These have been hitherto reserved for the next generation of instruments planned for the next decade, such as VLBI with ALMA, the Event Horizon Telescope (Doeleman, 2010) and space VLBI (Hong et al., 2014) missions.
The VLBA observations presented in this paper are part of a long series to investigate the nature of the jet wobbling effect in OJ287, by monitoring the changes in the position of its core (Agudo et al., 2012) at 44 GHz. At each epoch, this position is measured, with respect to an external reference, by combining the measurements from conventional PR at 22 GHz, and SFPR at 22/44 GHz. In this paper we present the maps (with nominal resolution and super-resolved) and SFPR astrometric measurements for one epoch of observations. The splitting of the super-resolved structure of OJ287 at 44 GHz into two components along a direction which is nearly perpendicular to the jet direction in the map at 22 GHz deserves special mention (see Figs. 6, 8); this structure is compatible with that found in Agudo et al. (2012); Krichbaum et al. (2013) at other epochs of observations. The innovative contribution of the SFPR observations presented in this paper is that they enable a “bona fide” astrometric registration of the maps of OJ287 at 22 and 44 GHz. Therefore we conclude that the “core” component in the map of OJ287 at 22 GHz is located in-between the two components seen in the super-resolved map at 44 GHz, namely at a separation of as in the SE direction of the component at the center of the map in the super resolution map. Further scientific interpretation of these results, along with the monitoring from different epochs and in the context of studying the jet wobbling effect, will be presented in another paper. The study presented in this paper provides another observational demonstration of the application of SFPR techniques. Previous demonstrations include observations at 43/86 GHz with the VLBA (Dodson & Rioja, 2009; Rioja & Dodson, 2011), and most recently spectral line non-integer frequency ratio observations of H2O and SiO masers in the evolved star R LMi (Dodson et al., 2014). In this paper we have investigated the role of the source structures and the choice of reference points in the astrometric analysis. This is important to assist the interpretation of the astrometric measurements in terms of individual source contributions (i.e. the “core-shifts”) along the direction of their jets. We have also explored source structure related effects, such as differential structure blending, which would result from the different resolutions at the two frequencies. Low resolution instruments, and extended sources without a clearly dominant feature will be more vulnerable to systematic astrometric errors resulting from structure blending effects, and this should be taken into account in the error analysis for a robust interpretation of SFPR results in such cases.
References
- Agudo et al. (2012) Agudo, I., Marscher, A. P., Jorstad, S. G., et al. 2012, ApJ, 747, 63
- Alef (1988) Alef, W. 1988, in IAU Symposium, Vol. 129, The Impact of VLBI on Astrophysics and Geophysics, ed. M. J. Reid & J. M. Moran, 523
- Beasley & Conway (1995) Beasley, A. J., & Conway, J. E. 1995, in Astronomical Society of the Pacific Conference Series, Vol. 82, Very Long Baseline Interferometry and the VLBA, ed. J. A. Zensus, P. J. Diamond, & P. J. Napier, 327
- Dodson et al. (2014) Dodson, R., Rioja, M., & et al. 2014, AJ, 12006, 00
- Dodson & Rioja (2009) Dodson, R., & Rioja, M. J. 2009, VLBA Science Memo #32
- Doeleman (2010) Doeleman, S. 2010, in 10th European VLBI Network Symposium and EVN Users Meeting: VLBI and the New Generation of Radio Arrays
- Greisen (2003) Greisen, E. W. 2003, Information Handling in Astronomy - Historical Vistas, 285, 109
- Han et al. (2013) Han, S.-T., Lee, J.-W., Kang, J., et al. 2013, PASP, 125, 539
- Hobiger et al. (2013) Hobiger, T., Piester, D., & Baron, P. 2013, Radio Science, 48, 131
- Hong et al. (2014) Hong, X., Shen, Z., An, T., Liu, Q., & the Chinese Space VLBI Array team. 2014, ArXiv e-prints
- Honma et al. (2008) Honma, M., Tamura, Y., & Reid, M. J. 2008, PASJ, 60, 951
- Krichbaum et al. (2013) Krichbaum, T. P., Roy, A., Wagner, J., et al. 2013, ArXiv e-prints
- Lee et al. (2014) Lee, S.-S., Petrov, L., Byun, D.-Y., et al. 2014, AJ, 147, 77
- Liebe et al. (1993) Liebe, H. J., Hufford, G. A., & Cotton, M. G. 1993, in AGARD, Atmospheric Propagation Effects Through Natural and Man-Made Obscurants for Visible to MM-Wave Radiation 11 p (SEE N94-30495 08-32), ed. Various, 00–00
- Niinuma (2014) Niinuma, K., e. a. 2014, PASJ, 0092, 00
- Oh et al. (2011) Oh, S.-J., Roh, D.-G., Wajima, K., et al. 2011, PASJ, 63, 1229
- Rioja & Dodson (2011) Rioja, M., & Dodson, R. 2011, AJ, 141, 114
- Rioja et al. (2011) Rioja, M., Dodson, R., Malarecki, J., & Asaki, Y. 2011, AJ, 142, 157
- Rioja & Dodson (2009) Rioja, M. J., & Dodson, R. 2009, VLBA Science Memo #32
- Thompson et al. (2007) Thompson, A. R., Moran, J. M., & Swenson, G. W. 2007, Interferometry and Synthesis in Radio Astronomy, John Wiley and Sons, 2007.
- Wrobel (1995) Wrobel, J. M. 1995, in Astronomical Society of the Pacific Conference Series, Vol. 82, Very Long Baseline Interferometry and the VLBA, ed. J. A. Zensus, P. J. Diamond, & P. J. Napier, 411
- Wrobel & Walker (1999) Wrobel, J. M., & Walker, R. C. 1999, in Astronomical Society of the Pacific Conference Series, Vol. 180, Synthesis Imaging in Radio Astronomy II, ed. G. B. Taylor, C. L. Carilli, & R. A. Perley, 171