A 52 hours VLT/FORS2 spectrum of a bright HUDF galaxy:
no emission.
††thanks: This work is based on data collected at ESO VLT (prog.ID 084.A-0951(A), 086.A-0968(A), 088.A-1013(A)
and 088.A-1008(A)), and at NASA HST.
Abstract
Aims. We aim to determine the redshift of GDS_1408, the most solid galaxy candidate lying in the Hubble Ultra Deep Field.
Methods. We have used all the VLT spectra of GDS_1408 collected by us and two other groups with FORS2 at VLT in the last five years, for a total integration time of 52hr. The combined spectrum is the deepest ever obtained of a galaxy in the Reionization epoch.
Results. We do not detect any emission line or continuum over the whole wavelength range, up to 10100Å. Based on an accurate set of simulations, we are able to put a stringent upper limit of () at 3-9 sigma in the explored wavelength range, corresponding to a rest-frame equivalent width Å. Combining this limit with the SED modelling we refine the redshift to be (1-sigma). The same SED fitting indicates that GDS_1408 is relatively extinct () with a dust corrected star formation rate of . The comparison between the un-attenuated equivalent width predicted by the case-B recombination theory and the observed upper limit, provides a limit on the effective escape fraction of %. Even though we cannot rule out a major contribution of the inter/circum galactic medium in damping the line, a plausible interpretation is that G2_1408 is moderately evolved and contains sufficient gas and dust to attenuate the emission, before it reaches the intergalactic medium.
Conclusions. The redshift confirmation of even the best candidates is very hard to achieve (unless the or unusually strong rest-UV nebular emission lines are present) with the current generation of 8-10m class telescopes. We show that both JWST and E-ELT will be necessary to make decisive progresses. Currently, the increased redshift accuracy obtained with this kind of analysis makes ALMA an interesting option for the redshift confirmation.
Key Words.:
Galaxies: high - redshift; Galaxies: formation; Galaxies: distances and redshifts1 Introduction
Understanding the process of reionization of the intergalactic medium in the early Universe and the nature of the first galaxies responsible for that process are among the most important goals of modern cosmology (Robertson et al., 2010, and references therein). Thanks to the deep and panchromatic data, such as GOODS, CANDELS and Hubble Ultra Deep Field (HUDF), great progress has been made in our ability to identify and subsequently confirm (spectroscopically) galaxies at . The most prominent spectral feature in the UV rest-frame wavelengths probed by optical/NIR spectroscopy at is the emission line (e.g., Vanzella et al. 2011, V11; Pentericci et al. 2011, 2014, P11, P14; Schenker et al. 2012, 2014, Ono et al. 2012, Shibuya et al. 2012). However, at the situation is still challenging and at present only a handful objects are spectroscopically secured. There are at least two main reasons: (1) Physical processes in the galaxies: the emission is a resonant atomic transition very sensitive to dust attenuation, and can be used for a diagnostic of the physical processes occurring within the galaxy (Giavalisco et al., 1996; Atek et al., 2013), since its strength and velocity profile depend on the instantaneous star formation rate, gas and dust content, metallicity, kinematics, and geometry of the interstellar medium. Therefore an evolution of the average galaxy properties with time (gas and/or dust properties and/or ionizing emission) can make it intrinsically absent at specific cosmic epochs. (2) Reionization: the emission line may suffer of damping effect due to an increase of the neutral gas fraction in the intergalactic and/or circum galactic media (Miralda-Escudé et al., 2000; Dijkstra et al., 2011; Treu et al., 2012) or a increasing incidence of optically thick absorption systems (Bolton & Haehnelt, 2013) as the ending phase of the reionization is approached. Another limiting effect was instrumental: efficient near infrared spectrographs () with multiplexing capabilities are needed to capture UV rest-frame features for many targets at once, and only recently they are becoming available (e.g., VLT/KMOS, Keck/MOSFIRE, LBT/LUCI).
While point (1) is alleviated by the fact that (on average) the frequency of line emitters appear to increase as redshift increases (, Ouchi et al., 2008; Schaerer et al., 2011; Stark et al., 2011), the damping due to reionization may severely limit our current ability to confirm galaxies at (but see Dijkstra & Wyithe, 2010). Finkelstein et al. (2013) find only one galaxy at out of 43 candidates at with the Keck/MOSFIRE and similarly Schenker et al. (2014) find only one possible line at in the their sample of 19 , remarking that some process is making the difficult to detect. Therefore, there is a large fraction of non- emitters lying well within the first Gyr after the Big-Bang, whose nature is worth to investigate. Clearly, all these explainations assume that the efficiency of the color selection based on the -break remains extremely high at , i.e. that most of current candidates are indeed at their estimated redshifts.
In this work, we report on an ultradeep spectrum (52 hours integration) of the brightest galaxy in the Hubble Ultra Deep Field (). Being by far the brightest candidate in this well-studied region, it has been continuously selected as a high redshift candidate from the earliest NICMOS to the current ultradeep HUDF data, at variance with other targets (Yan & Windhorst, 2004; Bouwens et al., 2004; Bouwens & Illingworth, 2006; Labbé et al., 2006; Bouwens et al., 2008; Oesch et al., 2010; Fontana et al., 2010; McLure et al., 2010; Bunker et al., 2010; Yan et al., 2010; Finkelstein et al., 2010; Castellano et al., 2010; Wilkins et al., 2011; Bouwens et al., 2011; Grazian et al., 2011; McLure et al., 2013; Bouwens et al., 2014). We focus here on the combination of ultradeep spectroscopy and photometry to derive new insights about its nature.
Errors are quoted at the confidence level, unless otherwise stated. Magnitudes are given in the AB system (AB ). We assume a cosmology with and km s-1 Mpc-1.
2 FORS2 Observations and Data Reduction
HUDF-J033242.56-274656.6 galaxy (G2_1408 in Castellano et al. 2010 and hereafter) has been observed through four different VLT/FORS programs collected in the period 2009-2012, 084.A-0951(A) (P.I. A. Fontana), 086.A-0968(A) – 088.A-1013(A) (P.I. A. Bunker), 088.A-1008(A) (P.I., R. Bouwens), and 283.A-5063 (P.I., M. Carollo) with exposure times of 18 (Fontana, F18), 27 (Bunker, B27), 7 (Bouwens, B7) and 8 (Carollo, C8) hours on target, respectively, for a total of 60 hours integration time. Unfortunately, in the program 283.A-5063 the G2_1408 source was placed at a position where the CCD has a defect and no dithering has been performed, therefore we exclude the 283.A-5063 program from the following analysis. The total usable exposure time is 52 hours. The median seeing was 0.8 arcsecond in all runs. The F18 data were presented in Fontana et al. (2010) where we reported a tentative detection of a line at z=6.972. The other runs, B27 and B7, have been obtained subsequently in many different nights (especially B27), and particular care has been devoted to the alignments of the frames by using bright sources and sky emission lines. The B27 program has also been presented in Caruana et al. (2013), where they reported a at the location of the putative at . We discuss in very detail any possible presence of emission by combining all the available programs.
Data reduction has been performed as in Vanzella et al. (2011), with particular care to the sky subtraction. The classical “A-B” dithering scheme that combines the partial frames (A-B) and (B-A) is performed, with an additional treatment that equalizes for local differences in the number counts between frames (e.g., due to time variation of sky lines, distortion, etc.). The algorithm implements an “A-B” sky subtraction joined with a zero (e.g., median) or first order fit of the sky along columns that regularized possible local differences in the sky counts among the partial frames before they are combined. Finally, the two-dimensional spectra have been combined with a weighted average, and the subsequent resulting spectrum has been flux and wavelength calibrated. The two dimensional sky-subtracted partial frames are also combined (in the pixel domain) to produce the weighted RMS map, associated to the final reduced spectrum. This allows us to calculate the two dimensional signal to noise spectra, useful to access the reliability of the spectral features (as we address below with simulations).
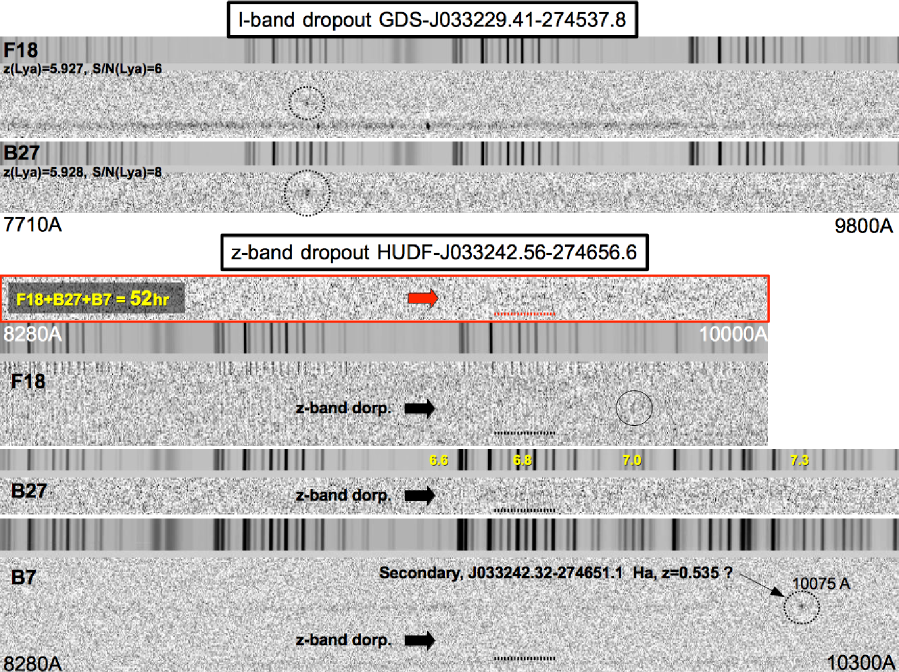
Further checks have been performed on other targets placed in the masks and on those in common between F18 and B27. In particular, Caruana et al. (2013) targeted the same faint band dropout we confirmed previously with F18 (Fontana et al., 2010), GDS J033229.41-274537.8 at . While in the F18 spectrum the continuum is not detected, in our B27 spectrum we find a very faint trace redward of the line and a with estimated flux of at S/N, about a factor 1.25 higher than F18, whose flux is estimated to be with S/N. Both flux and error estimates are compatible within the flux calibration accuracy and different integration time. The top part of Figure 1 shows the S/N spectra of the galaxy (i.e., the reduced spectrum divided by its RMS map).
Following the above approach, we have combined the 52 hours of observations of GDS_1408. The three individual S/N spectra and the conbined one are shown in the bottom part of Figure 1. The 52 hours spectrum is the deepest spectroscopic observation of a galaxy obtained to date.
3 Results
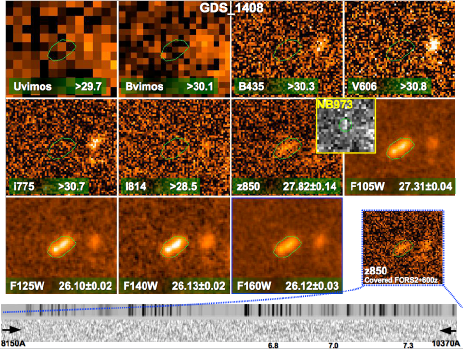
Before discussing any feature in the spectrum we note that the available photometry already constrains the redshift in the range () where FORS2 is an efficient instrument for the detection of the corresponding Ly, both in terms of wavelength coverage and response. First, we recall that globally the high redshift nature () is guaranteed by the large observed break between the ultradeep optical and near infrared bands ( magnitudes) and the well determined flat behaviour of the SED in the near infrared bands, detected with a high SNR (HST-WFC3, S/N20-50), as shown in Figure 2 and 3. This makes GDS_1408 one of the most robust candidates. Second, a reliable upper limit on the redshift is provided by the clear detections in the band () and narrow band filter, NB973 (), centered at Å and Å (Figure 3). The limit provided with the detection in the NB973 is if the entire NB973 filter is capturing the galaxy continuum, (see inset of Figure 3).
3.1 A deep upper limit to the flux
Given the above upper limit , the FORS2+600z configuration provides a safe constraint on the line flux.111As an example Figure 1 shows the secondary object in B7 spectrum in which the line is detected at z=0.535 consistently with the , and showing that the FORS2+600z configuration is still performing well at 10100Å. Indeed, there are no obvious spectral features in the three S/N spectra at the position of the G2_1408 (marked by arrows), neither in the combined one (see Figure 1).
We note that these deeper data do not confirm the tentative detection of a weak line located at Å, corresponding to a redshift of 6.972 that we reported in Fontana et al. (2010) with (and shown with a circle in the F18 spectrum of Figure 1). Exploiting the RMS map we derived, the reliability of the spectral feature in the F18 spectrum turns out to have . In the combined (52h) spectrum, however, the S/N at the same wavelength position is even smaller, , and suggests that the earlier tentative detection was most probably a noise spike.
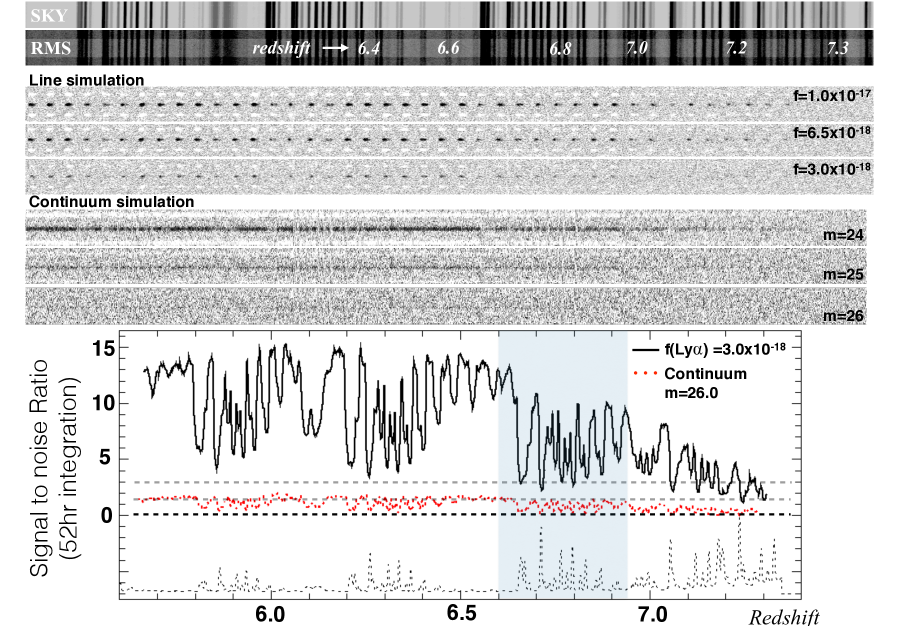
To assign a statistical significance to our 52h non-detection, we estimated the minimum line flux reachable with the deep FORS2+600z spectrum by computing simulations as in V11 and P14. Two dimensional asymmetric lines have been inserted in the science raw frames moving the line from to 7.3 with (i.e., one pixel at the given spectral resolution), including the dithering pattern, varying the FWHM and the line flux, convolving with spectral resolution along the dispersion and with the seeing along the spatial direction (extracted from the header of each science frame). Knowing the exact position of the inserted lines in the raw frames (that by definition include also the cosmic rays), and including the full reduction pipeline process and the response curve, we can reliably access the limits attainable by the instrument. The resulting S/N of the simulated lines are fully compatible with those we observed at redshift 6 and 7 (P11, P14 and V11).
The upper limit we derive from the combined 52h spectrum is () at 3-sigma (in the sky-lines) and up to 9-sigma (in sky-free regions) in the whole wavelength range, i.e., up to (see Figure 4). Adopting the F125W=26.100.02 as the estimation of the continuum under the line, and given the relatively flat UV slope in the near infrared bands, the limit on the flux corresponds to an upper limit on the equivalent width Å, with the same statistical accuracy. It represents the faintest limit on the flux ever derived at .
While absorption lines are clearly impossible to detect in our spectra, it is worth to investigate whether the non detection of the continuum in the 52h spectrum is compatible with the expected magnitude . To this aim, a set of two-dimensional continua (with flat UV slope) without any absorption line have been added to the raw frames as performed for line simulations, adopting a Gaussian profile in the spatial direction (consistent with the observed seeing). They have been added to the raw frames with dithering and dimmed in magnitude, from 23.0 to 27.0 with (in all the process the response curve has been taken into account). Figure 4 shows the results. The S/N decreases accordingly with the magnitude dimming and in the presence of sky emission lines, becoming impossible to detect at magnitude unless the object is at redshift below 6.6 (see Figure 4). Both simulations on line and continuum show the clear decrease of the S/N at the position of sky emission lines, i.e., it is lower where the sky emission is stronger. The results of the continuum simulation are in line with the observed faint galaxies, in particular with those we confirmed in P11 at based on continuum-break only.
3.2 Refined redshift
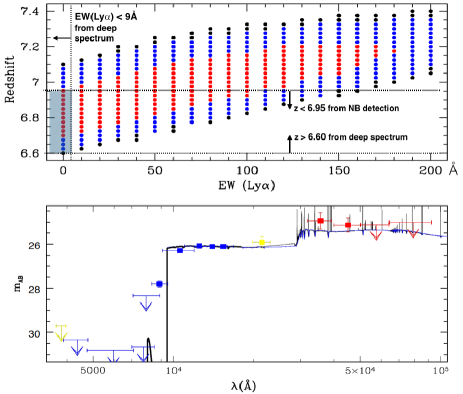
Depending on its EW, the emission can contribute significantly to the broad band photometry and as a consequence to the photometric redshift determination. In particular, the flux observed in the band (see Figure 3) depends on the position of the -line/break (i.e., the redshift), the IGM attenuation, the EW of the possible emission (), and mildly on the UV slope of the source, (). With the depth and photometric quality available for this galaxy and the upper limit derived above, the redshift value can be refined. To this aim we performed the SED fitting with Bruzual & Charlot (2003)(BC03, hereafter) templates by including different equivalent widths of the (0-200Å rest-frame) and focusing solely on the break between the optical and near infrared bands, i.e., , , , , , , and . We have not included the NB filter in this exercise since its photometry is not as accurate as the HST data. The templates adopted a range of –folding star–formation timescales ranging from to 15 Gyr (the latter being in practice a constant-star formation history), metallicities from to , and a Calzetti attenuation curve with . Figure 2 shows the plane (redshift–), in which the degeneracy is clear, i.e., a progressively stronger emission is required at increasing redshifts to compensate for the increasing absorption by the IGM. The degeneracy with the line is broken by including the result from the ultradeep 52h spectrum discussed in Sect. 3.1, that forces the to be smaller than 9Å rest-frame. Once the Ly constraints are included, the redshift of G2_1408 is constrained within and at and and at . The top panel of Figure 2 shows the resulting region where the redshift would lie, that is (at one sigma).
We note that the range is consistent with the continuum-only simulations described above and the non detection in the sky-free region of the spectrum at ÅÅ, that both suggest a lower limit of the redshift, . Less significant, but consistent with , is the slightly brighter 3.6 magnitude to respect the 4.5 channel in the data we have, that could suggest a flux boost of the [OIII]4959-5007+ structure in the first channel, while the line is outside (redward) the second one, respectively. Indeed, this is confirmed with deeper IRAC data, in which a clear break has been measured, [] (Smit et al. in preparation, Labbé et al. (2013)). This is fully consistent with our redshift estimation.
The SED fitting with and without the nebular component has then been performed including the IRAC and ground based photometry. We have included the full treatment of the nebular emission (both in lines and continuum), computed using the Schaerer & de Barros (2009) model, as described in Castellano et al. (2014). The resulting SED fits with HST-only bands and the whole photometry are shown in the bottom panel of Figure 2. The derived physical quantities in the various cases agree within a factor of two. This exercise provides an estimate of the stellar mass of , an age Gyr, a dust attenuation E(B-V) and a dust corrected star formation rate of .
4 Discussion
The combination of excellent photometry and ultradeep spectroscopic data lead us to conclude that the lack or extreme weakness of a emission is a real feature of this object. It is therefore worth investigating the reasons why the line is not present.
4.1 The effective escape fraction
Dijkstra & Jeeson-Daniel (2013) differentiate between the term ’escape’ fraction and ’effective escape’ fraction of photons, and , respectively. The former being related to the transport of photons out of the galaxy’s interstellar medium, while the latter includes further damping by the IGM, giving rise to a low-surface-brightness glow around galaxies. Therefore, can be much smaller than . If we assume ”normal” metallicities and IMFs, and that on average star formation is ongoing at equilibrium ( with constant SFR), an estimation of the luminosity can be obtained imposing SFR(UV)/SFR()1 (Hayes et al., 2011; Verhamme et al., 2008). Assuming the SFR(UV) corrected by dust extinction is representative of the total ongoing star formation activity, the intrinsic flux turns out to be , i.e., rest-frame Å. The upper limit on the observed line flux derived above corresponds to an observed Å rest-frame (at ), 13 times smaller than the expected intrinsic emission, that gives an upper limit of %.
4.2 What is attenuating the emission ?
The escape of photons from a gaseous and dusty interstellar medium is a complex process which depends sensitively on a number of physical properties, such as dust and gas mass, star formation rate, metallicity, kinematic, escaping ionizing radiation, as well as the gas geometry and filling factor and the galaxy orientation (Neufeld, 1991; Verhamme et al., 2008, 2012; Hayes et al., 2011; Yajima et al., 2014; Laursen et al., 2013; Dijkstra et al., 2014). Additionally, the neutral hydrogen in the IGM can scatter part of the photons and decrease the line luminosity. For example, Laursen et al. (2011) suggested that the average IGM transmission could be 20% at . Also in this case the transmission depends sensitively on the viewing angle and the environments of the galaxy, as it is affected by the inhomogeneous filamentary structure of IGM. At the IGM damping could be the dominant effect.
It is not possible to investigate in detail the above quantities with the current information. Therefore we have to rely on global properties, e.g., by performing a comparative analysis with lower redshift galaxies at . First, it has been shown that UV-bright star-forming galaxies () show on average a deficit of emission with respect the fainter UV counterparts (e.g., Ando et al. 2006; Vanzella et al. 2009; Lee et al. 2013; Balestra et al. 2010), explained by the fact that on average galaxies that are intrinsically brighter in the UV are also more star forming and more massive, more chemically enriched and thus more likely to be obscured by dust, especially the resonant transition that is expected to be efficiently absorbed. A decreasing trend of emission with increasing E(B-V) has also been observed in several studies (Giavalisco et al., 1996; Atek et al., 2008; Verhamme et al., 2008; Kornei et al., 2010; Hayes et al., 2011). The observed UV slope () of GDS_1408 suggests there is a dust attenuation (Castellano et al., 2014; de Barros et al., 2014). The inferred and assuming the Schmidt law (Schmidt, 1959; Kennicutt, 1998a), implies a non negligible amount of gas, , comparable to the stellar mass, and would favor a more efficient photon destruction operated by dust. The presence of dust and gas would also suggest that the escape fraction of ionizing radiation is very low, as it has been observed in star-forming galaxies at (Vanzella et al., 2010a; Boutsia et al., 2011).
Second, GDS_1408 is one of the more extended sources among the candidates (half light radius of , i.e., 1.4 proper Kpc, Grazian et al. 2011, with an elongated morphology of proper Kpc, see Figure 3). It has been shown that the equivalent width and the size observed at the 1500Å rest-frame of the stellar continuum anti-correlate, such that on average the emitters appear more compact and nucleated than the non-emitters, with average half light radius kpc (Law et al., 2007; Vanzella et al., 2009; Pentericci et al., 2010).
GDS_1408 is moderately star-forming and contains a non negligible amount of dust, it is UV bright and spatially extended. While we cannot exclude that the CGM/IGM plays an additional role, the properties of GDS_1408 are consistent with those of others lower-z star-forming galaxies that show faint emission, and is not a “smoking gun” of an increased neutral IGM at . It is worth noting that we are discussing a single galaxy case which clearly cannot be considered as representative of a population. The deficit of lines from redshift 6 to 7 recently observed is significant and is based on a statistical analysis that compares tens of star-forming galaxies selected with very similar color techniques, indepenently from the presence of the line. However, as noted also in Schenker et al. (2014), galaxies like GDS_1408 are not the best tracers of an IGM damping. The higher is the probability the emission is internally absorbed, the lower is the power of tracing the neutral gas fraction of the circum/inter-galactic medium.
Nonetheless, it is important to assess the nature of “continuum-only” star-forming galaxies at , still an unexplored line of research. As reported in this work, the tentative spectroscopic investigation of “continuum-only” galaxies at shows all the limitations of the 8-10 meter class telescopes coupled with optical spectroscopy (). Different and future facilities are needed to shed light on their nature.
4.3 Future prospects: ALMA, JWST and ELT
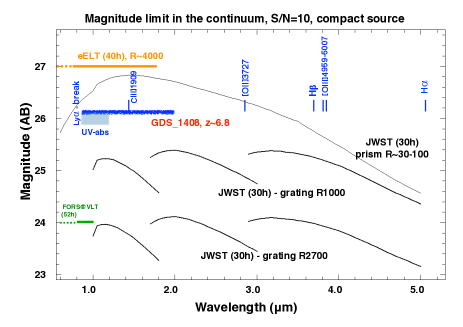
We have shown the current limits of 8-10m class telescopes in the spectroscopic characterization and redshift measurement of non- emitters at . If is a critical value above which the visibility of lines decreases drastically, then future facilities are necessary to capture the UV continuum-break and the ultraviolet absorption lines and/or optical nebular emission lines at . JWST-NIRSPEC will probe the typical nebular emission lines, e.g., [OII]3727, H, [OIII]4959-5007 up to () and the extremely large telescopes (ELT, 30-40m diameter) will allow us to cover the mid-infrared part (e.g., EELT-METIS, 8-14 ) and to probe the UV continuum with S/N=10 down to and therefore to study in detail the ultraviolet absorption lines, not to mention the possibility to perform high spatial resolution analysis.
In particular, the case of GDS_1408 is shown in Figure 5, where a schematic view of the limits on the continuum at S/N=10 are reported for the ELT, JWST and VLT telescopes. A good characterization of the ultraviolet absorption lines will be feasible with the ELT. JWST would marginally identify the trace of the continuum (), but will open for the measure of optical emission lines (up to [OIII]4959-5007).
While JWST and ELT will definitely perform these kind of studies, at present the measure of the redshift with 8-10m telescopes could be achieved looking at emission lines different from . Though unusual, lines like OIII]1661-1666 and CIII]1907-1909 could be identified by means of near infrared spectrographs. Moreover, depending on the source of ionizing photons, other lines like NV 1240, NIV]1483-1486, CIV 1550, HeII 1640 can also be measured (e.g., Osterbrock & Ferland 2006; Vanzella et al. 2010b; Raiter et al. 2010; Steidel et al. 2014).
Another promising facility that might be able to determine the spectroscopic redshift of this galaxy is ALMA. Indeed, a spectral scan of the [CII]158 line encompassing the full 2-sigma range of uncertainty could be covered with two ALMA spectral bands. Assuming that the local SFR-[CII]158 relation of Sargsyan et al. (2012) holds also at these high redshifts, based on the best-fitting SFR=20yr-1 we expect a flux of 0.24 Jy km/s, that can be secured in a relatively short time ( hours in the Cycle2 sensitivity) with ALMA. A molecular line scan that covers the 3mm window (89-115 GHz) can also reveal multiple CO transitions in GDS_1408. In particular at the transitions and (where J is the rotational quantum number) are observable. Given the UV slope and the star formation activity, and assuming the relation between CO line luminosity and SFR (see Carilli & Walter, 2013; Decarli et al., 2014), the expected CO transitions can be detected () with an ALMA 3mm scan with sensitivity limit of mJy beam-1.
5 Conclusions
We have reported the combined VLT/FORS2 spectroscopy of one of the most reliable galaxy candidates in the Hubble Ultra Deep Field. Three different programs at VLT targeted GDS_1408 in the last five years, for a total integration time of 52h. We have retrieved from the ESO archive all these data, and re-analyzed them in a consistent way. Our main results are:
-
1.
An upper limit on the Ly emission: We are able to place a stringent upper limit of () at 3-sigma (in the sky-lines) and up to 9-sigma (in sky-free regions) in the whole wavelength range, i.e., up to (see Figure 4). This corresponds to an upper limit on the equivalent width Å, with the same statistical accuracy. With the deeper data used here we do not confirm the tentative detection of a weak line located at Å, corresponding to a redshift of 6.972, that we claimed in F10.
-
2.
Redshift refinement: The combination of ultradeep spectroscopy, superb HST information and narrow band imaging, have allowed us to refine the photometric redshift value of GDS_1408, that turns out to be . The same analysis indicate that GDS_1408 has a nearly solar metallicity and is relatively dust attenuated () galaxy.
-
3.
escape fraction: We derived a %. The attenuation can be a combination of internal (ISM) and external effects (IGM).
Even though we cannot rule out a major contribution of the IGM in damping the line, the most plausible interpretation is that G2_1408 is a star-forming galaxy at moderately evolved and containing sufficient gas and dust to attenuate the emission, before it reaches the intergalactic medium. If compared with fainter (), young, less massive and less evolved counterparts that show emission and much steeper UV slopes (e.g., Balestra et al. 2013; Vanzella et al. 2014), G2_1408 appears more massive and evolved ().
An absence of the line due to dust absorption is not in contrast with recent results on the deficit of lines ascribed to a possible increase of the neutral gas fraction of the IGM between and 7 (e.g., P11, P14, Finkelstein et al. 2013). In fact, the apparent drop of lines is an evidence based on statistical samples, in which the properties of redshift 6 and 7 galaxies are compared in a differential way, and applying similar color selection techniques.
Redshift 7 sources like GDS_1408, and in general even fainter ones at , will be well studied spectroscopically with ELT and JWST telescopes, in particular for what concerns the UV absorption lines and nebular (optical) emission lines, respectively. As an example, JWST will provide the systemic redshift from rest-frame optical nebular emission lines (Oxigen, Balmer lines) and the ELT will capture the signature of the ISM in absorption in the rest-frame ultraviolet. This will be feasible not before 2018-2020. Currently, a facility that can provide redshift measures at and characterize the properties of the ISM and stellar population is ALMA. Sources like GDS_1408 with a reliable guess on the redshift value are suitable candidates for the scanning mode of ALMA.
Acknowledgements.
We thanks R. Bouwens for providing information about the deep IRAC magnitudes of the source and P. Oesch for providing information about the GDS_1408 target in the spectroscopic program 088.A-1008(A). We thank F. Vito, M. Mignoli, A. Cimatti and S. de Barros for useful discussions. Part of this work has been funded through the INAF grants (PRIN INAF 2012).References
- Ando et al. (2006) Ando, M., Ohta, K., Iwata, I., et al. 2006, ApJ, 645, L9
- Atek et al. (2008) Atek, H., Kunth, D., Hayes, M., Östlin, G., Mas-Hesse, J. M., 2008, A&A, 488, 491A
- Atek et al. (2013) Atek, H., Kunth, D., Schaerer, D., Mas-Hesse, J. M., Hayes, M., Östlin, G., Kneib, J.-P., A&A, accepted
- Balestra et al. (2010) Balestra, I., Mainieri, V., Popesso, P., et al. 2010, A&A, 512, A12
- Balestra et al. (2013) Balestra, I., Vanzella, E., Rosati, P., et al. 2013, A&A, 559, L9
- Behrens et al. (2014) Behrens, C., Dijkstra, M., & Niemeyer, J. C. 2014, A&A, 563, A77
- Bolton & Haehnelt (2013) Bolton, J. S., & Haehnelt, M. G. 2013, MNRAS, 429, 1695
- Boutsia et al. (2011) Boutsia, K., Grazian, A., Giallongo, E., et al. 2011, ApJ, 736, 41
- Bouwens et al. (2004) Bouwens, R. J., Illingworth, G. D., Blakeslee, J. P., Broadhurst, T. J., & Franx, M. 2004, ApJ, 611, L1
- Bouwens & Illingworth (2006) Bouwens, R. J., & Illingworth, G. D. 2006, Nature, 443, 189
- Bouwens et al. (2008) Bouwens, R. J., Illingworth, G. D., Franx, M., & Ford, H. 2008, ApJ, 686, 230
- Bouwens et al. (2011) Bouwens, R. J., Illingworth, G. D., Oesch, P. A., Labbé, I., Trenti, M., van Dokkum, P., Franx, M., Stiavelli, M., Carollo, C. M., Magee, D., Gonzalez, V., 2011, ApJ, 737, 90B
- Bouwens et al. (2014) Bouwens, R. J., Illingworth, G. D., Oesch, P. A., et al. 2014, arXiv:1403.4295
- Bruzual & Charlot (2003) Bruzual, G., & Charlot, S. 2003, MNRAS, 344, 1000
- Bunker et al. (2010) Bunker, A., Wilkins, S., Ellis, R., et al. 2010, MNRAS, 409, 855
- Carilli & Walter (2013) Carilli, C. L., & Walter, F. 2013, ARA&A, 51, 105
- Caruana et al. (2013) Caruana, J., Bunker, A. J., Wilkins, S. M., Stanway, E. R., Lorenzoni, S., Jarvis, M. J., Elbert, H., MNRAS in press, 2013, (arXiv/1311.0057C)
- Calzetti et al. (2000) Calzetti, D., Armus, L., Bohlin, R. C., et al. 2000, ApJ, 533, 682
- Castellano et al. (2010) Castellano, M., Fontana, A., Boutsia, K., et al. 2010a, A&A, 511, 20
- Castellano et al. (2012) Castellano, M., Fontana, A., Grazian, A., et al. 2012, A&A, 540, A39
- Castellano et al. (2014) Castellano, M., Sommariva, V., Fontana, A., et al., 2014, A&A, in press, (arXiv-1403.0743)
- de Barros et al. (2014) de Barros, S., Schaerer, D., & Stark, D. P. 2014, A&A, 563, A81
- Decarli et al. (2014) Decarli, R., Walter, F., Carilli, C., et al. 2014, ApJ, 782, 78
- Dijkstra & Wyithe (2010) Dijkstra, M., & Wyithe, J. S. B. 2010, MNRAS, 408, 352
- Dijkstra et al. (2011) Dijkstra, M., Mesinger, A., Wyithe, J. S. B., 2011, MNRAS, 414, 2139
- Dijkstra & Jeeson-Daniel (2013) Dijkstra, M., & Jeeson-Daniel, A. 2013, MNRAS, 435, 3333
- Dijkstra et al. (2014) Dijkstra, M., Wyithe, S., Haiman, Z., Mesinger, A., & Pentericci, L. 2014, MNRAS, 440, 3309
- Duval et al. (2013) Duval, F., Schaerer, D., Östlin, G., Laursen, P., 2013, A&A, accepted
- Evans et al. (2013) Evans, C., Puech, M., Barbuy, B., Bastian, N., Bonifacio, P., Caffau, E., Cuby, Jean-Gabriel, Dalton, G., Dunlop, J., Flores, H., Hammer, F., Kaper, L. et al., 2013, White paper presented at the “ Shaping E-ELT Science & Instrumentation”
- Fontana et al. (2010) Fontana, A., Vanzella, E., Pentericci, L., et al. 2010, ApJ, 725, L205
- Finkelstein et al. (2010) Finkelstein, S. L., Papovich, C., Giavalisco, M., et al. 2010, ApJ, 719, 1250
- Finkelstein et al. (2013) Finkelstein, S. L., Papovich, C., Dickinson, M., et al. 2013, Nature, 502, 524
- Giavalisco et al. (1996) Giavalisco, M., Koratkar, A., Calzetti, D., 1996, ApJ, 466, 831G
- Grazian et al. (2011) Grazian, A., Castellano, M., Koekemoer, A. M., Fontana, A., Pentericci, L., Testa, V., Boutsia, K., Giallongo, E., Giavalisco, M., Santini, P., 2011, A&A, 532, 33G
- Hayes et al. (2011) Hayes, M., Schaerer, D., Östlin, G., Mas-Hesse, J. M., Atek, H., Kunth, D., 2011, ApJ, 730, 8H
- Kornei et al. (2010) Kornei, K. A., Shapley, A. E., Erb, D. K., Steidel, C. C., Reddy, N. A., Pettini, M., Bogosavljević, M., 2010, ApJ, 711, 693K
- Kennicutt (1998a) Kennicutt, R. C., Jr. 1998, ApJ, 498, 541
- Kennicutt (1998b) Kennicutt, R. C., Jr. 1998, ARA&A, 36, 189
- Inoue (2011) Inoue, A. K. 2011, MNRAS, 415, 2920
- Labbé et al. (2006) Labbé, I., Bouwens, R., Illingworth, G. D., & Franx, M. 2006, ApJ, 649, L67
- Labbé et al. (2013) Labbé I, Oesch P. A., Bouwens R. J., Illingworth G. D., Magee D., González V., Carollo C. M., Franx M., Trenti M., van Dokkum P. G., Stiavelli, M., 2013, ApJ, 777, 19
- Laursen et al. (2011) Laursen, P., Sommer-Larsen, J., & Razoumov, A. O. 2011, ApJ, 728, 52
- Laursen et al. (2013) Laursen, P., Duval, F., Östlin, G. 2013, ApJ, 766, 124
- Law et al. (2007) Law, D. R., Steidel, C. C., Erb, D. K., et al. 2007, ApJ, 656, 1
- Lee et al. (2013) Lee, K.-S., Dey, A., Cooper, M. C., Reddy, N., & Jannuzi, B. T. 2013, ApJ, 771, 25
- Loeb et al. (2005) Loeb, A., Barkana, R., & Hernquist, L. 2005, ApJ, 620, 553
- McLure et al. (2010) McLure, R. J., Dunlop, J. S., Cirasuolo, M., et al. 2010, MNRAS, 403, 960
- McLure et al. (2013) McLure, R. J., Dunlop, J. S., Bowler, R. A. A., Curtis-Lake, E., Schenker, M., Ellis, R. S., Robertson, B. E., Koekemoer, A. M., Rogers, A. B., et al., 2013, MNRAS, 432, 2696
- Miralda-Escudé et al. (2000) Miralda-Escudé, J., Haehnelt, M., Rees, M. J., 2000, ApJ, 530, 1
- Nakajima & Ouchi (2013) Nakajima, K., & Ouchi, M. 2013, arXiv:1309.0207, MNRAS, in press
- Neufeld (1991) Neufeld, D. A. 1991, ApJ, 370, L85
- Oesch et al. (2010) Oesch, P. A., Bouwens, R. J., Illingworth, G. D., et al. 2010, ApJ, 709, L16
- Ono et al. (2012) Ono, Y., Ouchi, M., Mobasher, B., Dickinson, M., Penner, K., Shimasaku, K., Weiner, B. J., Kartaltepe, J. S., Nakajima, K., Nayyeri, H., et al., 2012, ApJ, 744, 83O
- Osterbrock (1989) Osterbrock, D. E. 1989, Astrophysics of Gaseous Nebulae and Active Galactic Nuclei (Univ. Science Books, Mill Valley, CA, USA)
- Osterbrock & Ferland (2006) Osterbrock D.E. & Ferland, G. J., 2006, Astrophysics of gaseous nebulae and active galactic nuclei, 2nd. ed. by D.E. Osterbrock and G.J. Ferland. Sausalito, CA: University Science Books, 2006
- Ouchi et al. (2008) Ouchi, M., Shimasaku, K., Akiyama, M., Simpson, C., Saito, T., Ueda, Y., Furusawa, H., at al., 2008, ApJS, 176, 301
- Pentericci et al. (2010) Pentericci, L., Grazian, A., Scarlata, C., et al. 2010, A&A, 514, A64
- Pentericci et al. (2011) Pentericci, L., Fontana, A., Vanzella, E., Castellano, M., Grazian, A., Dijkstra, M., Boutsia, K., Cristiani, S., Dickinson, M., Giallongo, E., et al, 2011, ApJ, 743, 132
- Pentericci et al. (2014) Pentericci, L., Vanzella, E., Fontana, A., et al. 2014, arXiv:1403.5466
- Raiter et al. (2010) Raiter, A., Schaerer, D., & Fosbury, R. A. E. 2010, A&A, 523, A64
- Rauch et al. (2011) Rauch, M., Becker, G. D., Haehnelt, M. G., Gauthier, J.-R., Ravindranath, S. Sargent, Wallace L. W., 2011, MNRAS, 418, 1115R
- Robertson et al. (2010) Robertson, B. E., Ellis, R. S., Dunlop, J. S., McLure, R. J., Stark, D. P., 2010, Nature, 468, 49
- Sargsyan et al. (2012) Sargsyan, L., Lebouteiller, V., Weedman, D., Spoon, H., et al., 2012, ApJ, 755,171
- Schaerer (2003) Schaerer, D. 2003, A&A, 397, 527
- Schaerer & de Barros (2009) Schaerer, D. & de Barros, S., 2009, A&A, 502, 423
- Schaerer et al. (2011) Schaerer D., de Barros S., Stark D. P., 2011, A&A, 536, A72
- Schenker et al. (2012) Schenker, M. A., Stark, D. P., Ellis, R. S., Robertson, B. E., Dunlop, J. S., McLure, R.J., Kneib, J.-P., Richard, J., 2012, ApJ, 744, 179S
- Schenker et al. (2014) Schenker, M. A., Ellis, R. S., Konidaris, N. P., & Stark, D. P. 2014, arXiv:1404.4632
- Schmidt (1959) Schmidt, M. 1959, ApJ, 129, 243
- Shibuya et al. (2012) Shibuya, T, Kashikawa, N., Ota, K., Iye, M., Ouchi, M., Furusawa, H., Shimasaku, K., Hattori, T., 2012, ApJ, 752, 114
- Siana et al. (2007) Siana, B., Teplitz, H. I., Colbert, J., et al. 2007, ApJ, 668, 62
- Stark et al. (2011) Stark, D. P., Ellis, R. S., & Ouchi, M. 2011, ApJ, 728, L2
- Steidel et al. (2014) C. C. Steidel, G. C. Rudie, A. L. Strom, M. Pettini, N. A. Reddy, A. E. Shapley, R. F. Trainor, D. K. Erb, M. L. Turner, N. P. Konidaris, K. R. Kulas, G. Mace, K. Matthews, I. S. McLean, 2014, ApJin press, (arxiv/1405.5473)
- Taylor & Lidz (2013) Taylor & Lidz, 2013, in press
- Treu et al. (2012) Treu, T., Trenti, M., Stiavelli, M., Auger, M. W., Bradley, L. D., 2012, ApJ, 747, 27
- Treu et al. (2013) Treu, T., Schmidt, K. B., Trenti, M., Bradley, L. D., Stiavelli, M., 2013, ApJ, 775, 29
- Vanzella et al. (2009) Vanzella, E., Giavalisco, M., Dickinson, M., Cristiani, S., Nonino, M., Kuntschner, H., Popesso, P., Rosati, P., Renzini, A., et al., 2009, ApJ, 695, 1163
- Vanzella et al. (2010a) Vanzella, E., Giavalisco, M., Inoue, A. K., et al. 2010, ApJ, 725, 1011
- Vanzella et al. (2010b) Vanzella E., Grazian A., Hayes M., Pentericci L., Schaerer D., Dickinson M., Cristiani S., Giavalisco M., Verhamme A., Nonino M., Rosati P., 2010, A&A, 513, 20
- Vanzella et al. (2011) Vanzella, E., Pentericci, L., Fontana, A., Grazian, A., Castellano, M., Boutsia, K., Cristiani, S., Dickinson, M., et al., 2011, ApJ, 730, 35
- Vanzella et al. (2012) Vanzella, E., Guo, Y., Giavalisco, M., Grazian, A., Castellano, M., Cristiani, S., Dickinson, M.; Fontana, A., Nonino, M., Giallongo, E., et al, 2012, ApJ, 751, 70
- Vanzella et al. (2014) Vanzella, E., Fontana, A., Zitrin, A., et al. 2014, ApJ, 783, L12
- Verhamme et al. (2008) Verhamme, A., Schaerer, D., Atek, H., Tapken, C., 2008, A&A, 491, 89V
- Verhamme et al. (2012) Verhamme, A., Dubois, Y., Blaizot, J., et al. 2012, A&A, 546, A111
- Verhamme et al. (2014) Verhamme, A., Orlitova, I., Schaerer, D., & Hayes, M. 2014, arXiv:1404.2958
- Yan & Windhorst (2004) Yan, H., & Windhorst, R. A. 2004, ApJ, 612, L93
- Yan et al. (2010) Yan, H., Windhorst, R., Hathi, N., et al. 2010, RAA, 10, 867
- Yajima et al. (2014) Yajima, H., Li, Y., Zhu, Q., et al. 2014, MNRAS, 440, 776
- Wilkins et al. (2011) Wilkins, S. M., Bunker, A. J., Lorenzoni, S., et al. 2011, MNRAS, 411, 23
- Zackrisson et al. (2013) Zackrisson, E., Inoue, A. K., & Jensen, H. 2013, ApJ, 777, 39