A domain-specific analysis system for examining nuclear reactor simulation data for light-water and sodium-cooled fast reactors
Abstract
Building a new generation of fission reactors in the United States presents many technical and regulatory challenges. One important challenge is the need to share and present results from new high-fidelity, high-performance simulations in an easily usable way. Since modern multiscale, multi-physics simulations can generate petabytes of data, they will require the development of new techniques and methods to reduce the data to familiar quantities of interest (e.g., pin powers, temperatures) with a more reasonable resolution and size. Furthermore, some of the results from these simulations may be new quantities for which visualization and analysis techniques are not immediately available in the community and need to be developed.
This paper describes a new system for managing high-performance simulation results in a domain-specific way that naturally exposes quantities of interest for light water and sodium-cooled fast reactors. It describes requirements to build such a system and the technical challenges faced in its development at all levels (simulation, user interface, etc.). An example comparing results from two different simulation suites for a single assembly in a light-water reactor is presented, along with a detailed discussion of the system’s requirements and design.
1 Introduction
Modeling and simulation has always played a vital role in nuclear engineering and its applications. It is becoming even more relevant as the community starts examining and constructing new types of reactors. Although existing computational models of the conventional fleet perform very well within the operational experience base of today’s power plants, they do not necessarily provide the predictive capability needed to enable the deployment of completely new designs or to enable the use of today’s designs for very different modes of operation. New simulation codes are under development in several efforts sponsored by the US Department of Energy’s Office of Nuclear Energy, including those from the Nuclear Energy Advanced Modeling and Simulation (NEAMS) program [2] and the Consortium for Advanced Simulation of Light Water Reactors (CASL) [1].
These new codes are much different from the existing codes. Whereas tried-and-true codes employ sophisticated engineering models calibrated based on experimental observation to describe system behavior, the new code suites leverage high-performance computing (HPC) platforms to provide truly predictive simulators. The new codes can examine the physics of nuclear reactors with an unprecedented resolution at spatial and temporal scales ranging from the microstructure of the fuel all the way to the plant itself, and they are commonly capable of coupling neutronics, fuel mechanics, structural mechanics, and thermohydraulics [8],[13],[16]. While they are very powerful, they inevitably generate many terabytes and even petabytes of data that greatly exceed what any single person can absorb and interpret alone. Even results that are refined through post-processing can still be gigabytes in size.
Additional challenges arise when the user actually examines and reviews the results. Large tables of data, even if well-organized, are not easily consumed by humans because of their size and general lack of sufficient context to eliminate ambiguity. Furthermore, in this particular area, there are often very large numbers (fluxes, ) associated with very small numbers (displacements, ) that make intuitive interpretation of the rsults difficult. More often than not, users are forced to implement their own codes on top of the post-processing routines to collect, assimilate, rescale, normalize, and plot the very small amount of data that they actually need, which is a very costly chore in terms of both time and resources. Comparing the results from new simulations to those from old simulations or experiments also requires custom code, thereby multiplying the cost of adoption.
The authors assert that it is not sufficient to leave these challenges unaddressed and “pitch it over the fence” to users and analysts. Instead, just as new codes are under development to address the physics questions, new technologies need to be developed to address data analysis. The system presented in section 2 seeks to address this issue in three ways. First, it provides specialized data structures and input/output (I/O) libraries designed specifically for storing quantities of interest from nuclear simulations. Second, it provides a user interface that complements the I/O libraries to provide highly tailored views that put data in the proper context and reduce ambiguity. Finally, it provides an extension interface for adding custom analysis routines that can be easily coupled to routines for data mining and tailored analysis. An example of the utility of the system provided in section 3 demonstrates the ease with which interesting information between two codes, one new and one seasoned, can be extracted from the system.
2 Architecture
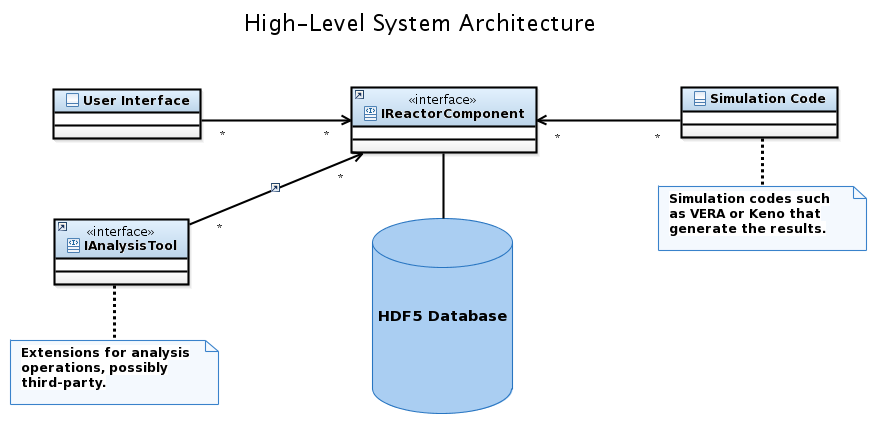
A high-level overview of the system’s logical architecture is presented in Fig. 1. The system is split into three parts, one each for users who examine data, developers who store data, and those interested in implementing custom analysis routines to examine the data. In each case, care was taken to make sure that the workflow of the respective actor was easy and intuitive for that use case.
Five high-level functional and nonfunctional requirements were used to guide the detailed design of the system based on feedback from interviews and experiments with prototypes, all of which were derived from the assumption that the simulation results must be shared with one or more people.
-
1.
The data should be organized according to the natural layout of a nuclear reactor and not on the discretized geometry of the simulation code.
-
2.
A data point has a position in three dimensions plus time with a value, uncertainty, and units.
-
3.
A reactor is composed of Parts, which are represented by custom data structures, and data can be stored for every Part (literally on every Part) available.
-
4.
The information is stored in a cross-platform, self-describing, binary compatible, open format.
-
5.
The data must be easily and equally accessible from languages used for user interfaces and from languages used to author simulation codes.
The need to compare data from two simulations led directly to requirement 1. Storing output data on the grid or mesh used by the simulation would allow only immediate and direct comparisons with other results from the same code unless grid-point mapping or mesh-to-mesh transfers [14] were performed. However, storing data based on the layout of a reactor—on cores, assemblies, pins, etc.—allows for immediate comparison of results, albeit at the cost of pulling that information from the grid or mesh during the simulation. One drawback of this design is that some data could be lost when the grid or mesh is removed. However, this is not strictly the case, since data can be mapped to any Part in the reactor and given any position.
It is extremely important that the data be stored in a binary compatible open format available on multiple platforms and readable in multiple languages (requirements 4 and 5) for three reasons. First, the subject matter experts will examine the data on workstations, not clusters or supercomputers. Second, in many situations, it must be stored in such a way that it can be reviewed if required, possibly at a much later date. Finally, someone may need to view the data who does not have the expertise to write the code to read the database but is otherwise qualified to evaluate it via a user interface.
The definition of a reactor, requirement 3, loosely follows that of real light water reactors (LWRs) and sodium-cooled fast reactors (SFRs). Reactors are hierarchically composed of a set of Parts, where a Part describes both the large-scale structures of a reactor, such as assemblies, and smaller Parts like pellets or “material blocks.” Data is stored for these Parts according to the description in requirement 2, including time, space, uncertainty and dimensional information, in addition to the value of interest.
Exact descriptions of the Parts of the nuclear reactors supported by this project are provided in section 3. The Parts are exactly the same in both supported languages, the user interface, and the I/O libraries. The design is general and based on publicly available information from Wikipedia, the Nuclear Regulatory Commission’s public website, and interviews with subject-matter experts. No proprietary designs are considered, and no proprietary information is used or provided, although it is certainly possible to add such Parts to the system with minimal effort.
The Parts are organized in a class hierarchy of data structures that uses object-oriented design principles to take advantage of both the natural hierarchy of reactors and abstractions for similar Parts (inheritance). The two different types of reactors that are currently supported—pressurized water reactors (PWRs) and SFRs—are available in their own modules but are accessed in the same way.
2.1 Input-Output Libraries
The system provides its own libraries for managing input and output to relieve software developers from the task of writing their own file parsers and emitters that conform to the shared specification. They remove the burden of writing to older data formats for developers of new codes and remove the complication of writing to newer formats, which may require significantly specialized skills, for maintainers of existing codes. Instead, developers instantiate and fill the Parts with data and then store those parts using the provided I/O routines. The workflow is shown, at a high level, in Fig. 2. In this figure, the “NiCE I/O API” represents the I/O library, and it acts as an intermediary between the simulation code and the user interface. The process is relatively simple: the developer loads the data structures needed and tells the library to write them. A user, on the other side, picks a file and the user interface loads that file.
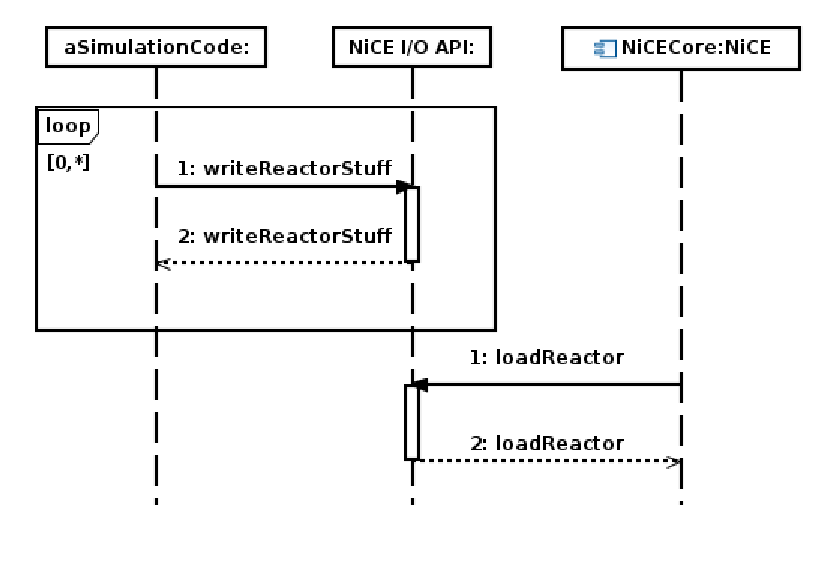
Developers may store whatever data they need on any Part. Data is stored associatively so that sets of data are stored against tags and any tag can be used. It is trivial to store data tagged with “Axial Power” right next to data tagged as “Cross sections” or “Velocity” on the same Part. Writing the data is then very simple: the developer calls a single write operation on the “highest” Part of the reactor,, which is normally the reactor core, that contains all of the other Parts the developer has. The simulation code may write multiple reactors to disk, (thus the loop in Fig. 2). Any client can read this file once it is written, such as the user interface or standalone analysis codes, using the inverse read operation with the desired data file passed as an input argument.
The file layout, which is different from the format, of the I/O libraries matches the class hierarchy of the data structures with a few exceptions. For example, it is much more memory-efficient to store the units of values in individual tables and refer to the name of the units with an integer in the file because, in practice, the integer is much smaller than a fixed-length string for representing an arbitrary system of units. A much more important optimization is the reuse of large structures like assemblies and pins, where possible. The layout of a physical reactor will have only a small number of different pin types (or assemblies) relative to the total number of pins in the reactor. Exploiting this fact by reusing the geometry and material information both in the data structures and on disk greatly reduces the amount of memory required. This detailed analysis of the layout of the data has made it possible to read and write data for “full” cores with 50 axial levels, hundreds of assemblies, and 50,000 pins in seconds.
2.2 User Interface
The ultimate goal of this system is to put simulation data into the hands of human users, and humans are much more efficient at examining visual images than raw data. The system includes a graphical user interface that presents information in multiple ways, including custom views, color maps, plots, and raw data. The user interface is designed so that users feel like they are manipulating a reactor instead of reading a paper.
The most important design requirement for the user interface is that it enable users to perform comparative analysis. That is, users must be allowed to compare results among multiple reactors side-by-side, with at least one of the reactors accepted as a “gold-standard” reference. For that matter, users must be allowed to examine the same part of a reactor with multiple views of its own data—geometry, color maps, plots, and so on.
Each Part has at least two associated graphical views, one each for geometric information, including assigned materials, and state point data, which is defined as the values of the quantities of interest at a given timestep. Views can be switched via a simple toolbar or by right-clicking on the canvas. It is possible to create plots for state point data for some Parts and, using specialized analysis routines, compute direct numerical comparisons (and create plots of those comparisons) between the state point data for two or more Parts. Each view can be saved as a PNG image file with a handy button on the toolbar.
Three-dimensional core geometries are supported by the system, but the user interface breaks this into two xy and z views. The xy view shows a cross section of the current Part at the specified axial level. The z view is next to the xy view and shows the axial geometry.
The user interface also exposes any external analysis routines that are available to users in a menu, as well as any options that can be configured for those routines. Results from the analyses are captured and presented to the user in a simple list. The file names on the local hard drive and their associate timestamps are also presented so that users can easily move the data to another system if needed. One external analysis routine is provided by default—to compute percentage differences among pins—and it is treated as a somewhat special case in that its results are automatically plotted, which is not the case for other analyses.
It is possible to view the data stored in the system using other user interfaces and techniques, c.f. section 2.4.
2.3 Integration with External Analysis Routines
The system can be extended to use external analysis routines for teams or developers who want to manipulate the data in a specific way. This mechanism is provided because it is impossible for the core development team to guess all of the possible analyses, much less implement and support the capability in the long term. The routines are referred to as “external” simply because they are plug-and-play.
External routines are exposed to users through the user interface. The external routines can be anything from simple math operations to large wrappers that ship the work off to other libraries. The development team has tested three such extensions to date: the differencing tool for pin powers mentioned previously, a k-means clustering routine to find clusters in the data, and a set of “routines” that wrap a very large visualization toolkit, VisIt [3], to create different plots from the default set. The differencing routine is the only external routine available by default, but more detailed information on findings with the k-means clustering routines can be found in [11]. K-means is a clustering algorithm used to find groups in data that can later be used for classification. Ideally, a set of external analysis routines would be available to perform classification and anomaly detection on pins and assemblies as a form of automatic data triage to locate troublesome, erroneous, or simply interesting areas of the core.
Developers can add routines by implementing the “IAnalysisTool” interface shown in Fig. 1, as well as a few other interfaces associated with it, and declaring the analysis tool as a service to the framework. Analysis routines are written in Java and are dynamically consumed by the framework at runtime. Currently, only assemblies are passed to analysis tools, not reactor cores. This capability is not available in the C++ implementation, because that implementation is primarily focused on I/O for the simulation codes. Much more detailed descriptions for all of these interfaces are presented in the project documentation at the NiCE project page [4].
2.4 Technologies
The system is built with mostly off-the-shelf components and assembled as part of the NEAMS Integrated Computational Environment (NiCE), [4][6][7]. The code for developers is written in C++ so that it can be easily used with C/C++ and Fortran codes. Version five of the Hierarchical Data Format (HDF5) [15] is used to read and write the data structures to and from disk. This greatly reduces the amount of work required to satisfy the cross-platform, multi-language requirements, as HDF5 is natively available in many languages and is completely open. HDF5 also provides multiple ways to access the data in “hdf” files in Ascii, including a command line utility—h5dump—that will dump the contents to disk and a graphical utility—hdfview—for viewing the contents of any HDF5 file.
The graphical user interface is implemented in the same system as NiCE, which uses the Eclipse Rich Client Platform (RCP) [10], and is written in Java. RCP is the platform on which the Eclipse Integrated Development Environment is built, is very flexible, and is cross-platform. It has many tools and utilities for working with graphics and connecting those graphics to data.
The k-means algorithm discussed in 2.3 was implemented in-house for NiCE, based on open literature, and is available in the source code. It is not enabled by default because the development team is exploring the possibility of using third-party capabilities to replace the home-grown version, namely Apache’s Mahout [5], and enable more data mining capabilities.
3 Parts
The system is composed of many Parts across the different levels of the reactor and is capable of storing data for PWRs and SFRs. The following discussion presents each Part in the system, the types of data that can be assigned to the Parts, and the visualizations available in the user interface.
The data presented for PWRs is taken from real simulations performed with the Virtual Environment for Reactor Analysis (VERA) [16] and KENO [12] for problem 3a of the VERA Benchmarks [9]. This problem represents a single 17 by 17 PWR fuel assembly at the beginning of its life and at constant temperature. The assembly is refined with 49 axial levels. VERA was modified for our purposes to write the results directly to file using the data structures and I/O libraries from our system. We obtained the KENO results from the author of [9] and converted them into our system using a stand-alone program. Additional assemblies were added to the geometric configuration of problem 3a to show the system’s ability to work with assemblies other than fuel assemblies, such as in-core instruments.
The results shown in the pictures for SFRs are generated and do not represent a physical system. The SFR pictures are presented solely to instruct readers about the capabilities of the data structures and the user interface.
All of the graphical views below exploit object-oriented design principles to minimize the amount of custom code needed to draw the different shapes. In many places, the same code is reused to draw Parts from PWRs and SFRs. The simplicity of using this system is also noteworthy, as the estimated time for a new user to go from importing data to exporting a plot like those shown below is merely minutes and does not require any knowledge of file formats, data layouts, or scripting languages.
3.1 Part Properties
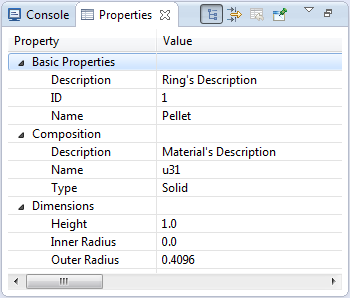
Each Part has a set of properties assigned to it that represent the most common properties of the given piece, such as material, pitch, diameter, and so on. These properties can be manipulated programmatically and are viewable within the user interface in a “Properties View,” as shown in Fig. 3.
Spatial data about a Part is stored by setting a data provider that includes data elements as described by requirement 2 in the Architecture section. Data providers are simply containers and are capable of managing arrays of data at different times. Data providers can be stored on any Part (as required by the IReactorComponent interface). However, in practice, this can destroy performance, so some Parts manage the data providers for other Parts.
3.2 Cores
Reactor cores are the highest Parts in the hierarchy at present. The PressurizedWaterReactor class represents PWRs. This class extends a generic LWR base class that defines some properties and operations common across different types of LWRs, including both PWRs and boiling water reactors333The latter is not yet fully supported and therefore is not discussed here.. Assemblies of any type are stored in their own grids, so that one type of assembly can share the same position as another type, which allows for control rod (“spider”) assemblies to be added. Control banks, fuel assemblies, in-core instruments, and “rod cluster” assemblies can be added to PWRs. Additionally, the fuel assembly pitch and the grid labels can be configured on the PressurizedWaterReactor class.
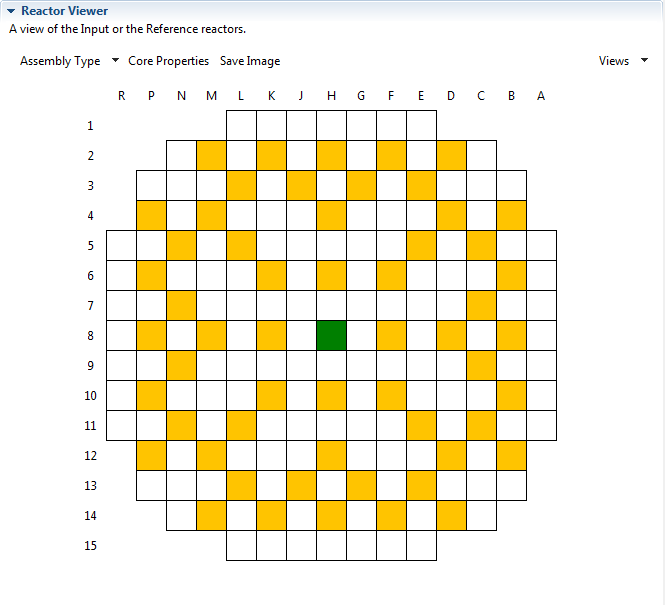
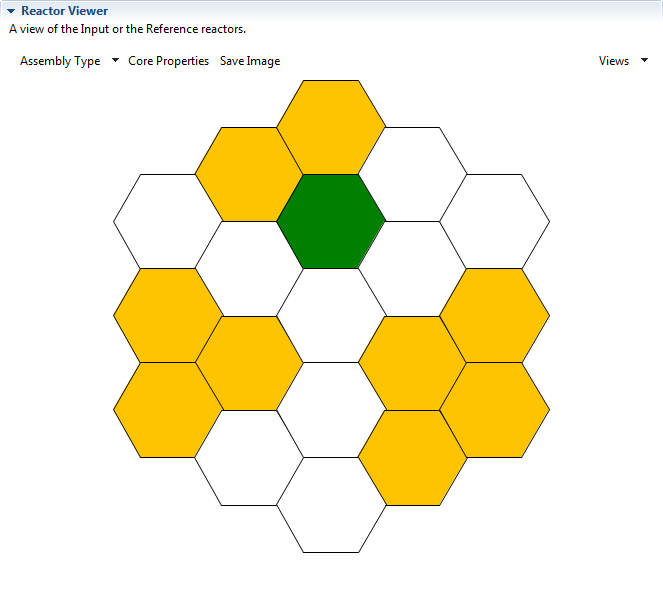
Figure 4 shows the geometric view of a PWR core in the user interface for the 3a problem. The grid labels are read as configured on the PressurizedWaterReactor class and displayed along the top horizontal and left vertical axes. Each assembly is represented by a single square on the grid. The single green assembly in the middle is a 17 by 17 fuel assembly, and the yellow assemblies are control banks. The type of assembly shown can be configured using the “Assembly Type” dropdown button.
The SFReactor class represents SFRs. Its interface is nearly identical to that of the PressurizedWaterReactor class, but the allowed assembly types and properties are different. Fuel, control, reflector, shield, and test assemblies can be added to SFRs. As for PWRs, size can be obtained for SFRs; but instead of only an assembly pitch, SFRs offer both a lattice pitch and a flat-to-flat distance. Flat-to-flat distance is stored on the core for convenience, and the system assumes that all assemblies have the same flat-to-flat distance.
The graphical representation of an SFR with fuel assemblies is shown in Fig. 5. The view shows the hexagonal layout of the core and functions exactly like the view of the PWR core.
3.3 Assemblies
Multiple assembly types can be configured for both PWRs and SFRs. Each assembly is composed of a collection of rods, and each rod is mapped to a location on a grid. “Rods” in this case are not necessarily fuel rods. They could be control rods, for example. The data providers that contain state point data for the rods, of any type, are stored on the assemblies at a specified grid location instead of directly on the rods. This is done to optimize data access times and storage (although they can still be stored on the rods themselves if needed).
PWR assemblies can store their sizes and rod/pin pitches. SFR assemblies can store their size duct thicknesses in addition to their sizes.
SFRs make a distinction between a “pin” and a “rod,” which is discussed in detail in section 3.4. PWRs make no such distinction and refer to both simply as “rods.”
PWRs support
-
•
Fuel assemblies of burnable fuel that is used in the reactor.
-
•
Control banks used to regulate the power within the reactor.
-
•
Incore instruments that represent assemblies configured with detectors or sensors within a core.
-
•
Rod cluster assemblies of (typically neutron absorbing) rods placed in and moved between fuel assemblies during refueling outages.
SFRs support
-
•
Fuel assemblies of burnable (inner fuel, outer fuel) and blanket (optional) assemblies.
-
•
Control assemblies that represent primary and secondary (shutdown) assemblies.
-
•
Reflector assemblies that are configured to reflect neutrons.
-
•
Shield assemblies for shielding against radiation.
-
•
Test assemblies that represent assemblies used for testing materials and fuels.
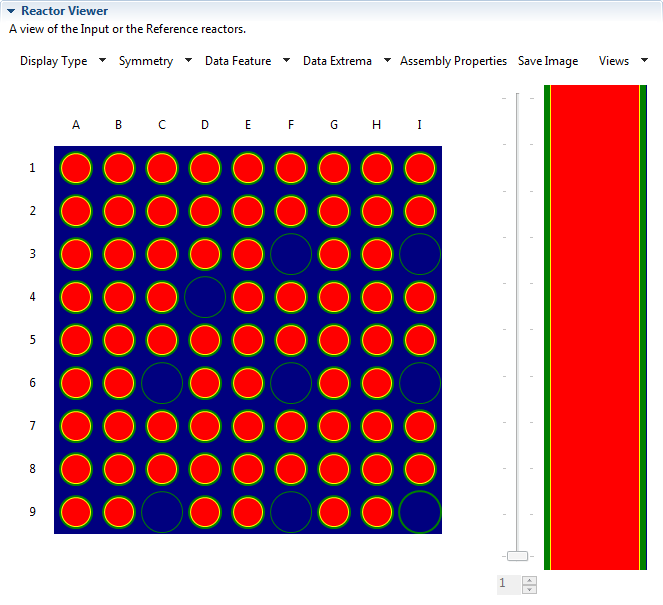
The geometry of one quarter of the PWR fuel assembly from problem 3a is shown in Fig. 6. Rods are represented by circles, with control rods represented by blue circles and fuel rods represented by red circles. The blue spaces between rods represent the coolant. The rods are arranged according to the pitch and size configured on the assembly. The “main” view on the left represents the axial level (1 in the figure) selected using the slider, spinner, or clickable axial view on the right. Like the core view, the grid labels are taken on, configured on, and read from the assembly and displayed on the top horizontal and left vertical axes.
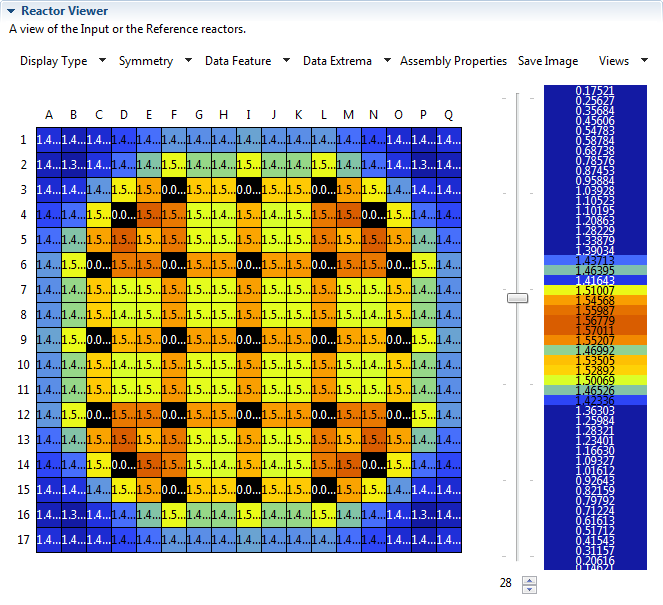
The tool bar can be used to switch this view from the geometric configuration to a view of the simulation data, as depicted in Fig. 7. The axial pin powers for problem 3a for the entire fuel assembly are shown in this view. Each square represents a rod, and the color mapping is bluer for lower values and redder for higher values. (The circles from the geometric view have been replaced with squares to make it easier to show the data values.) The color mapping in this figure was normalized for the selected axial level (level 28), but it can also be set relative to the whole assembly or all assemblies.
Figures 8 and 9 show the same views for SFRs. Both views have different grids from their PWR counterparts, but the same principles apply. Each circle in the geometric view represents a fuel pin in the SFR assembly and each hexagon in the data view represents the same fuel pin.
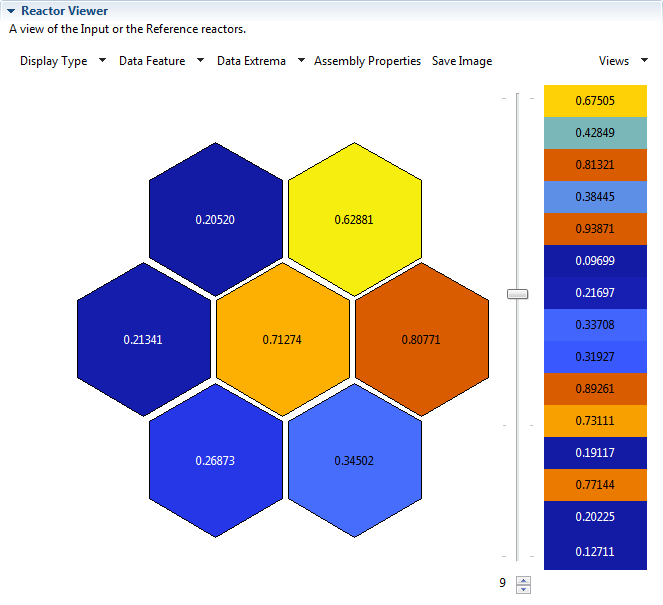
The type of data displayed in the data view, for either reactor type, can be switched with the “Data Feature” button. For the PWR example in problem 3a, both axial and total pin power data are available and can be selected. Any data stored on the assembly in a data provider will appear in the list and can be selected.
3.4 Pins and Rods
PWR assemblies are filled with rods made of either fuel or poisons or, in some cases, simply empty. The structure of a rod is defined by a collection of “material blocks” that describe the materials in a rod between two points along its axis. Material blocks are axisymmetric and are composed of concentric rings of materials. For example, a material block in a PWR fuel rod has a fuel ring, a fill gas ring, and a cladding ring. The clad and fill gas are typically defined separately from the material blocks for the fuels. Each rod can also store a pressure.
Each ring is defined by an inner and outer radius, a height, and a material type. Materials can be gases, liquids, or solids and can be labeled to match the materials in the simulation.
The SFR capability makes a further distinction between “pins” and “rods.” In SFRs, the pin is the basic unit of fuel assemblies and control assemblies. Rods are used only in reflector assemblies. Pins are identical to rods in PWRs.
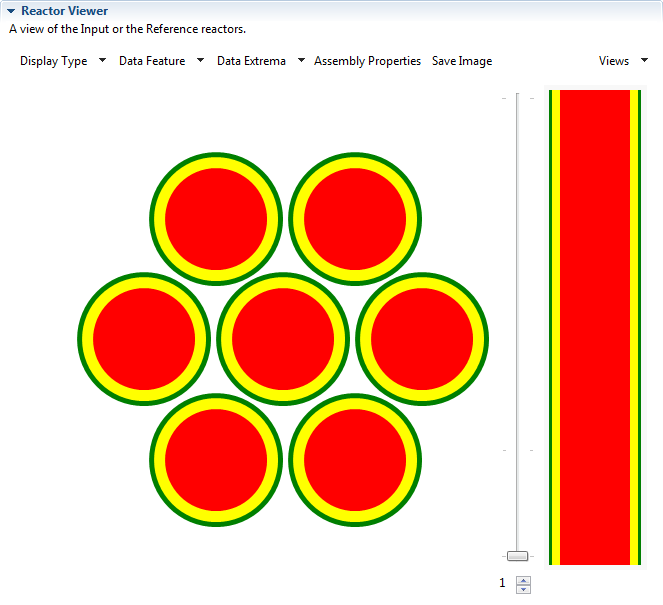
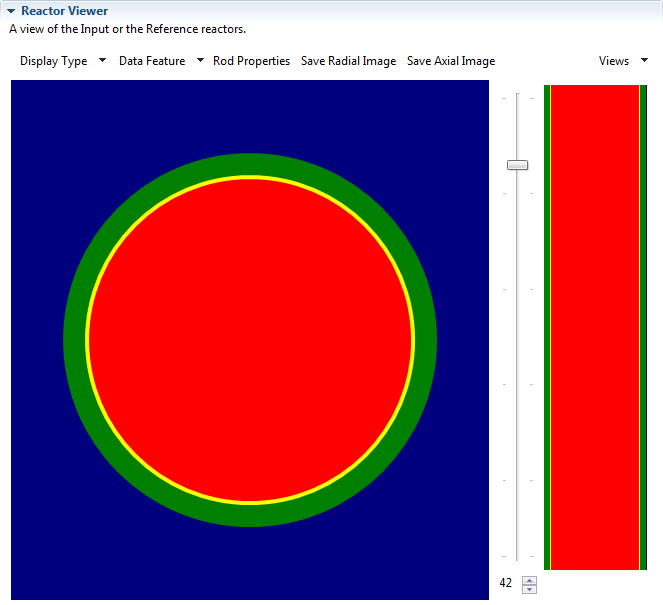
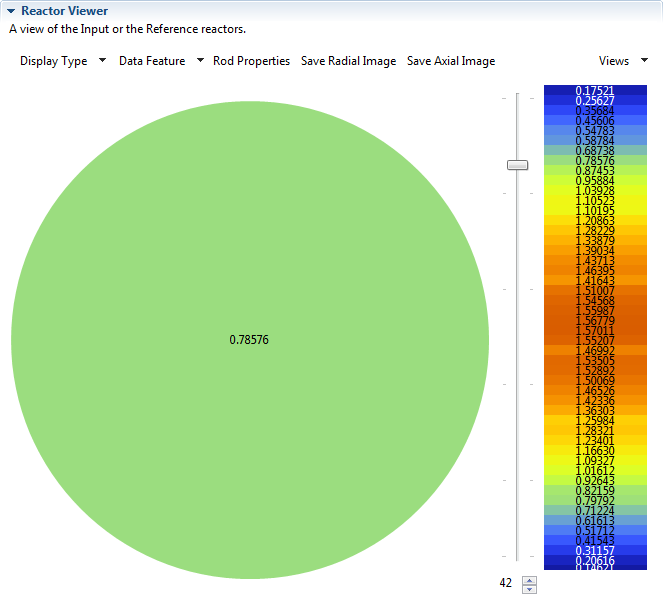
Figure 10 shows the geometry of a fuel rod in problem 3a. The rings of material are represented by the concentric circles of red, yellow, and green areas for the fuel, fill gas, and clad, respectively. Similar to the view for assemblies, the axial level can be adjusted using the slider, the spinner, or the clickable axial view. The data view for this rod showing the pin power at the 42nd axial level is shown in Fig. 11. The fuel is homogeneous in problem 3a, so only one material block and ring are shown.
The views for SFR pins are not shown because they are, for the most part, identical to the views for PWRs.
3.5 Plots and Comparisons
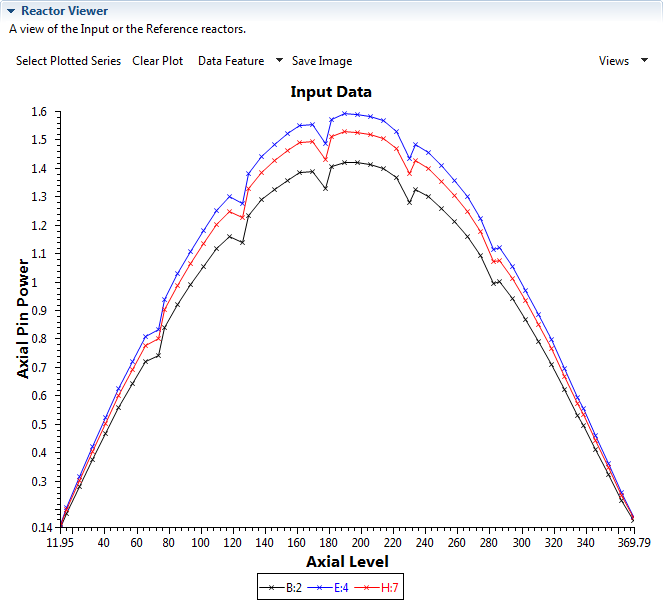
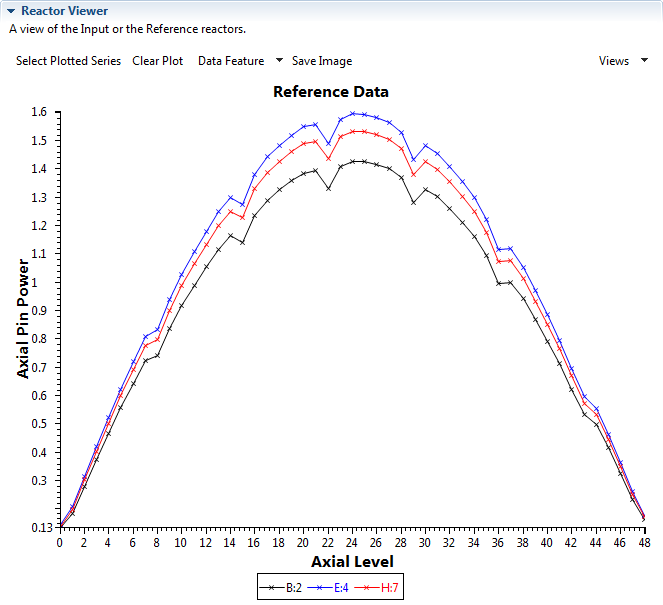
The user interface provides a limited plotting capability for information stored on assemblies and pins/rods. This allows users to make quantitative comparisons quickly and easily. Plots of the axial pin power for select fuel pins in problem 3a are shown in Figs. 12 and 13. The height from the bottom of the pin is shown on the horizontal axis, and the axial pin power on the vertical axis.
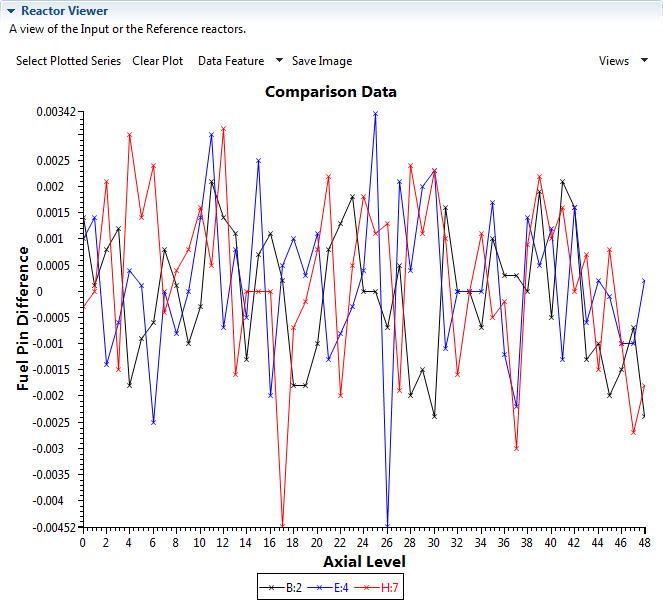
A plot showing the normalized percentage differences between the axial powers from VERA and KENO for problem 3a is shown in Fig. 14. This plot was created using the external analysis routine described in 2.3 and shows very close agreement between the two codes.
4 Availability and Ongoing Work
Source code and fully compiled binaries of this system are available as part of NiCE at http://niceproject.sourceforge.net. The system is referred to as the “Reactor Analyzer” in NiCE, and several detailed tutorials are available at the same website. Detailed source code documentation is also available. Future versions of the system will be available in NiCE, but in the near future that project will be “converted” into a new project at the Eclipse Foundation called the “Eclipse Integrated Computational Environment.” The system will then be available at http://www.eclipse.org. The current version is available under a modified BSD license, and future releases will be available under the Eclipse Public License.
Readers are encouraged to watch the recorded demonstrations published on YouTube.com at http://www.youtube.com/jayjaybillings.
Detailed Unified Modeling Language models were developed as part of this work; they are also available for download, although the format is proprietary. The authors will gladly export the Unified Modeling Language models into a more friendly format upon request.
The authors are open to feedback and contributions from readers. Those interested in contributing to the work through testing, design improvements, or source code development should contact the corresponding author.
4.1 Limitations
This system is relatively new and has several limitations. It remains highly useful considering these limitations and will only improve with time as they are addressed and other improvements added.
Performance has not been tested with very large amounts of data and many time steps. Scaling to a full core based on the 3a problem has performed well, after work to optimize the code; but even at the size of a full core, problem 3a is not very big. It is only resolved at 49 axial levels with two sets of state point data and five distinct rod types.
The system has not been tested with real data from SFR simulations. Although the authors do not expect that this will present any issues, that remains a possibility.
The system needs to be modified to include more of the regular properties of Parts. For example, the heights of rods and pins are determined by the total heights of their material blocks, but it needs to be possible to retrieve this value more easily. Plenum gas has not been considered.
4.2 Planned Future Work
There are many possible refinements to this system and a large amount of upcoming work. The most immediate refinement will be the addition of components to represent the pieces of a nuclear plant, such as generator, pipes, and other “plant-level elements.” As previously mentioned, it is also important to test the system for much larger amounts of data and with the parallel I/O capabilities natively available in the HDF5 library.
Extensions to more languages are planned, including bindings for C, Fortran, and Python. Each of these will be a wrapper around the C++ version, not a stand-alone implementation.
The authors are currently working with members of the SHARP team [13] to test the system with real data from simulations of SFRs.
The model for pins and rods will be improved in the near future after tests with Bison [17] later this year.
Extending the properties available in Parts is straightforward, and the authors are working with collaborators to extend the set of properties for each Part.
5 Conclusions
Future simulations of new nuclear reactor designs will require new ways to examine the results because of the high fidelity and resolution inherent in state-of-the-art simulation codes. The system presented herein is capable of reducing the analysis burden on both users and developers by organizing the results in an intuitive, domain-specific way and providing easy-to-use I/O capabilities and a user interface. Its application to a real-world problem with a 17 by 17 17 by 17 PWR fuel assembly from a VERA benchmark problem was shown by generating plots of the percentage difference between axial powers from VERA and KENO. Work remains to cover all of the different parts of LWRs and SFRs in sufficient detail for widespread use, as well as to optimize the system for truly large amounts of data in time and space.
Addressing the “data problem” will be critical to the success of the new modeling and simulation capabilities in development. Certainly, it is necessary to provide at least some streamlined capability to examine the large amounts of data coming from these simulations and, ideally, to make it possible to discover interesting new physics in the results through data mining and machine learning.
6 Acknowledgments
The authors are grateful to members of the NEAMS and CASL communities, others whom we have interviewed, and our program managers. The authors are grateful for the assistance of Greg Davidson, Jess Gehin, Andrew Godfrey, Ugur Mertyurek, and John Turner from Oak Ridge National Laboratory (ORNL) and Justin Thomas from Argonne National Laboratory. The authors are also grateful for the financial support provided by the NEAMS, Advanced Reactor Concepts, and CASL programs.
The authors are especially thankful to David Pointer of ORNL for his assistance, guidance, and continued support during the performance of this work and the development of the paper.
This work has been supported by the US Department of Energy, Office of Nuclear Energy, and by the ORNL Postgraduate Research Participation Program, which is sponsored by ORNL and administered jointly by ORNL and the Oak Ridge Institute for Science and Education (ORISE). ORNL is managed by UT-Battelle, LLC, for the US Department of Energy under contract no. DE-AC05-00OR22725. ORISE is managed by Oak Ridge Associated Universities for the US Department of Energy under contract no. DE-AC05-00OR22750.
7 References
References
- [1] Consortium for the Advanced Simulation of Light-water reactors web page, September 2011. \urlhttps://www.casl.gov.
- [2] Nuclear Energy Advanced Modeling and Simulation web page, September 2011. \urlhttp://www.ne.doe.gov/AdvModelingSimulation/program.html.
- [3] VisIt Web Page, September 2011. \urlhttps://wci.llnl.gov/codes/visit/home.html.
- [4] NiCE Project Page, April 2011-2014. \urlhttps://niceproject.sourceforge.net.
- [5] Apache Software Foundation. Apache Mahout. \urlhttps://mahout.apache.org, 2011-2014.
- [6] Jay Jay Billings, Andrew P. Belt, Mike Guidry, S. Forest Hull, Eric J. Lingerfelt, Greg M. Lyon, Alexander J. McCaskey, Neeti Pokhriyal, Andrew Godfrey, and Ugur Mertyurek. Simulate this! - the eclipse platform as an integrated computational environment. In EclipseCon 2013, 2013.
- [7] Jay Jay Billings, Jordan Deyton, S. Forest Hull, Alexander J. McCaskey, Taylor Patterson, and Anna Wojtowicz. Prevent three-eyed fish: Analyze your nuclear reactor with eclipse. In EclipseCon 2014, 2014.
- [8] Derek Gaston, Chris Newman, Glen Hansen, and Damien Lebrun-Grandie. Moose: A parallel computational framework for coupled systems of nonlinear equations. Nuclear Engineering and Design, 239, October 2009.
- [9] A. Godfrey. Vera core physics benchmark progression problem specifications. Technical Report CASL-U-2014-0006-002, Oak Ridge National Laboratory, Oak Ridge, TN, USA, March 2013.
- [10] Jeff McAffer, Jean-Michel Lemieux, and Chris Aniszczyk. Eclipse Rich Client Platform Second Edition. Addison-Wesley, Boston, 2010.
- [11] N. Pokhriyal, J. J. Billings, U. Mertyurek, and A. T. Godfrey. Anomaly detection for high fidelity core simulations. In Proc. 2013 American Nuclear Society Annual Meeting, 2013.
- [12] B. Rearden. SCALE: A Modular Code System for Performing Standardized Computer Analyses for Licensing Evaluation. ORNL/TM-2005/39, I-III, November 2006.
- [13] A. Siegal, T. Taugtes, A. Caceres, D. Kaushik, and P. Fischer. Software design of sharp. In Joint International Topical Meeting on Mathematics and Computation and Supercomputing in Nuclear Applications, 2007.
- [14] Timothy J. Tautges and Alvaro Caceres. Scalable parallel solution coupling for multiphysics reactor simulation. In Proc. SciDAC 2009 Journal of Physics: Conference Series, 2013.
- [15] The HDF Group. Hierarchical Data Format, version 5. \urlhttp://www.hdfgroup.org/HDF5/, 1997-2014.
- [16] J. Turner, R. Summers, and S. Palmtag. Virtual environment for reactor applications (vera). Technical Report CASL-U-2014-0006-000, Oak Ridge National Laboratory, Oak Ridge, TN, USA, March 2013.
- [17] R. L. Williamson, J. D. Hales, S. R. Novascone, M. R. Tonks, D. R. Gaston, C. J. Permann, D. Andrs, and R. C. Martineau. Multidimensional multiphysics simulation of nuclear fuel behavior. Journal of Nuclear Materials, 423, April 2012.