Investigation the connection between the intermediate gamma-ray bursts and X-ray flashes
József Kóbori1, Zsolt Bagoly1, Lajos G. Balázs2,3 and István Horváth4
1Dept. of Physics of Complex Systems, Eötvös University, Budapest, Hungary, jkoboricaesar.elte.hu
2MTA CSFK Konkoly Observatory, Budapest, Hungary,
3Dept. of Astronomy, Eötvös University, Budapest, Hungary,
4Dept. of Physics, National University of Public Service, Budapest, Hungaryű
1 Introduction
Gamma-ray bursts are a mysterious phenomenon since their discovery in 1967. In 1993, Kouveliotou et al. (1993), based on statistical studies showed that two types of GRBs can be distinguished using the quantity ( is the time during which the cumulative counts increase from 5% to 95% above the background, thus encompassing 90% of the total GRB counts): the short- ( s) and long-duration s) bursts. Later on, Horváth (1998) and Mukherjee et al. (1998) in 1998 independently have found, that an intermediate-duration type of bursts exists as well. These bursts can be connected to the short- (e.g. Řipa et al. 2012) and long-duration (e.g. Veres et al. 2010) bursts as well depending on the particular gamma-ray satellite used for constructing the sample. Since then some other types of bursts were identified: X-ray rich bursts and X-ray flashes. Statistical analyses suggest (e.g. Sakamoto et al. 2008) that common-GRBs, XRRs and XRFs can be drawn from the same population. However, the debate about the underlying physics is still going on, but thanks to the Swift mission (Gehrels et al. 2004), studying the simultaneous observations at many wavelengths allow us to constrain some of the prompt- and afterglow-emission parameters for the various types of bursts.
In this paper we report a statistical study of the prompt and afterglow emission of the intermediate group of GRBs and X-ray flashes. In §2 we describe the classification method of GRBs, then, in §3 we investigate the global parameters of the BAT lightcurves and spectra. After that, in §4 the XRT properties are analyised, while UVOT afterglows are presented in §5.
2 The data sample and the classification method
The sample used in this paper was created by Veres et al. (2010), who classified the bursts using the model based clustering (Bayesian Information Criterion) method. This method gives a probability that a burst belongs to a group, instead of a definite membership. For details of the process, please see their article. The sample consists of 408 bursts up to GRB090726: 331 long, 46 intermediate and 31 short bursts. All of the bursts were detected by the Swift satellite. The observational data was downloaded from the Swift Science Data Center (BAT fluence, XRT 11- and 24-hour flux, XRT Column Density (NH), BAT 1-sec peak photon flux, BAT photon index, XRT spectral index) and The Swift-XRT GRB Catalogue (temporal decay indices, break times).
Among the 46 intermediate bursts there are 38 bursts for which temporal decay indices are available in the XRT Catalogue, but further 5 bursts are excluded, because their lightcurve consists of more than 2 breaks and one or more flares (in these cases because of the flare activity it is difficult to fit the lightcurve, hence determine the underlying afterglow decay index). So, in the following calculations we analysed 33 bursts, and on the figures below 33 bursts are plotted as well.
If we apply the definition for XRFs adopted by Sakamoto et al. (2008) (, where ( mark two energy intervals) is the ratio of the fluences in different channels for a given burst using the usual Swift energy bands with keV as their boundaries, so ), then we can find 20 XRFs and 13 IBs in our sample.
To test whether the XRFs and IBs are drawn from the same population we compared their emission properties applying the Kolmogorov-Smirnov test to the data.
3 BAT fluences, peak fluxes and photon indices
A thorough analysis of the Swift BAT (-detector) and XRT (X-ray detector) data was carried out by Sakamoto et al. (2008), who investigated the spectral and temporal characteristics of the prompt- and X-ray afterglow-emission of XRFs and XRRs detected by Swift between 2004 December and 2006 September. They have found that XRFs, XRRs and the common GRBs form a single broad distribution. For comparison, we constructed (Fig. 2) the histogram of the quantity of our sample for the long-duration bursts, and it confirms the previous result (common distribution for ordinary GRBs, XRFs and XRRs). Nevertheless, if we plot the against the for the entire sample (short, intermediate and long GRBs) (1) we can see that the boundary for XRFs overlap the range of IBs.
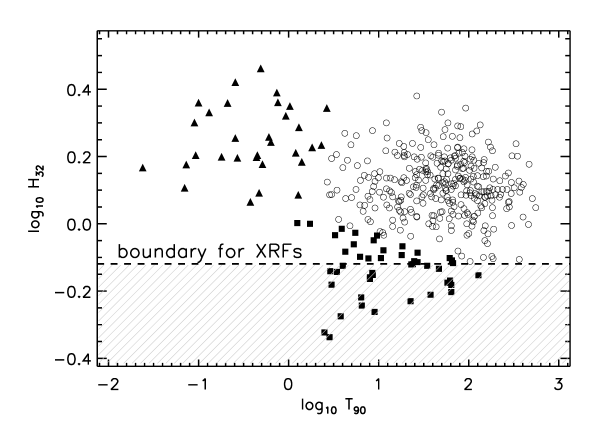
This result is discussed in details by Veres et al. (2010), and it suggests a connection between XRFs and IBs.

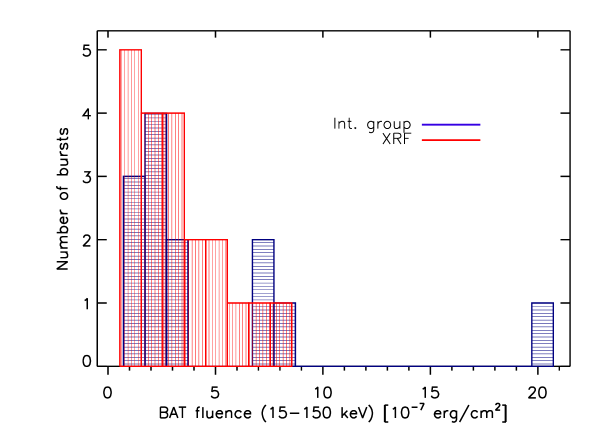
If we take a look at the histogram of BAT fluences measured between 15-150 keV (Fig. 3), we can see that there is no difference in the distribution of XRF’s and IB’s BAT fluences. The KS test supports this hypothesis with significance of 0.87.
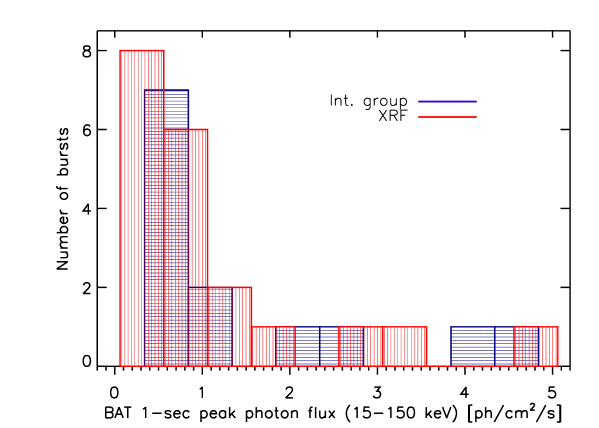
In the cases of the BAT 1-sec peak photon fluxes (Fig. 4), the result is similar, the null hypothesis is accepted with significance of 0.28.
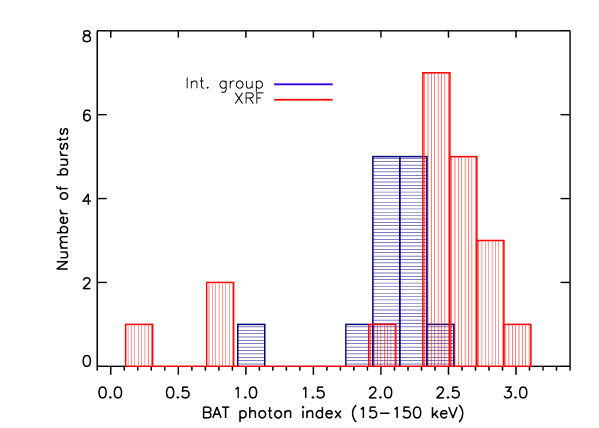
Contrary to the similarities in the fluence and peak flux distributions, a remarkable discrepancy can be observed in the distribution of the BAT photon indices. The reason of this bias is that the constrain for the XRFs () was defined arbitrarily, which means, that if we choose a higher value for as the boundary, then the difference in the distribution simply disappears.
4 XRT temporal and spectral indices
We also compared the distributions of XRT afterglow properties of the XRFs and IBs.
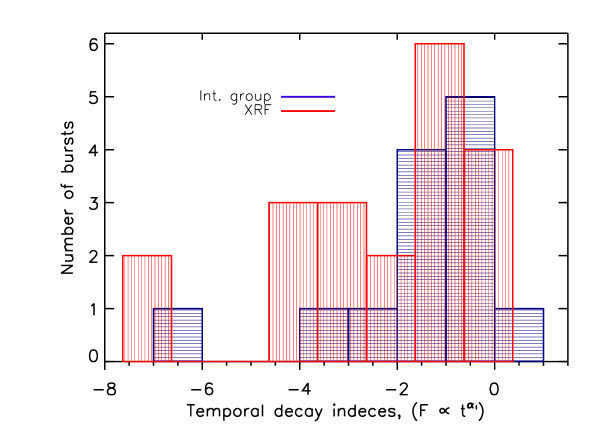
On Fig. (6) we plotted the initial temporal indices, which characterise the first power-law
segment of the XRT afterglows.
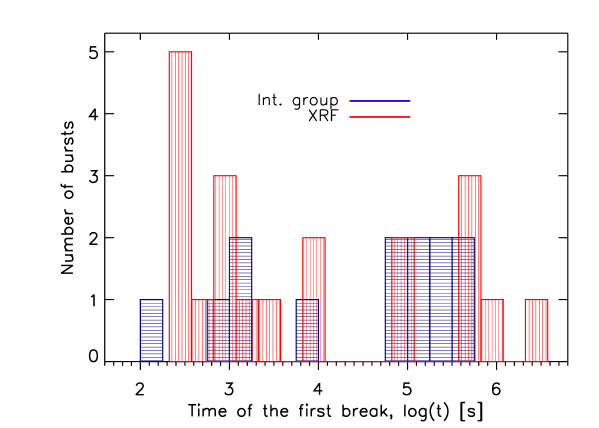
In the distribution of the first break time (Fig. 7) a slight difference can be discovered, the X-ray flashes tend to have this break earlier than the intermediate bursts.
Investigating the and indices (), the similarity between the XRFs and IBs still holds on, the significances for being drawn from the same populations are 0.42 and 0.35, respectively.
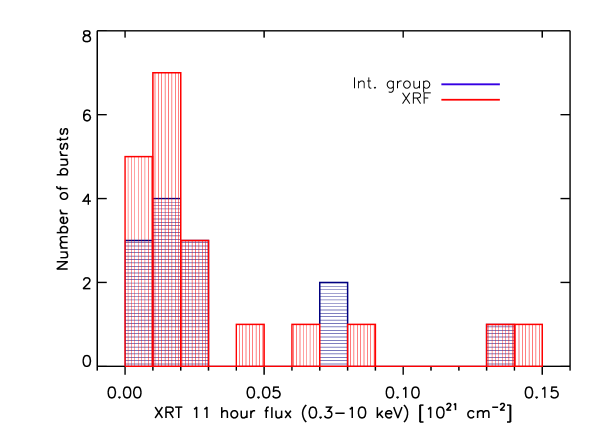
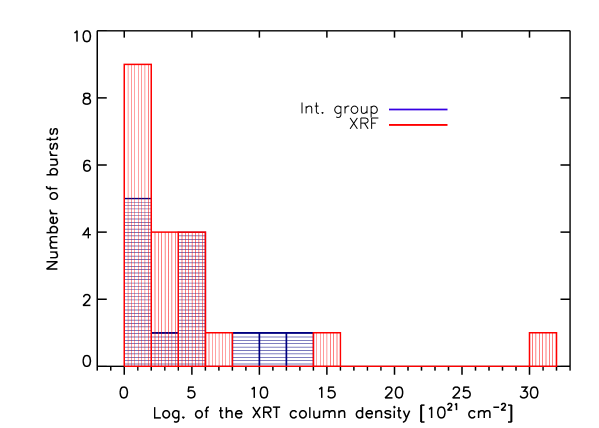
The KS test also accepts the same population hypothesis for the XRT fluxes measured at 11 and 24 hours after the trigger with probabilities of 28% and 11%, which is not surprising, since the indices form the same distribution as well. The distributions of the neutral hydrogen column densities (Fig. 9) in the host galaxies calculated from the XRT afterglows indicate that the XRFs and IBs tend to occur in similar type of galaxies, this is confirmed by the KS test, the same population hypothesis has significance of 0.43.
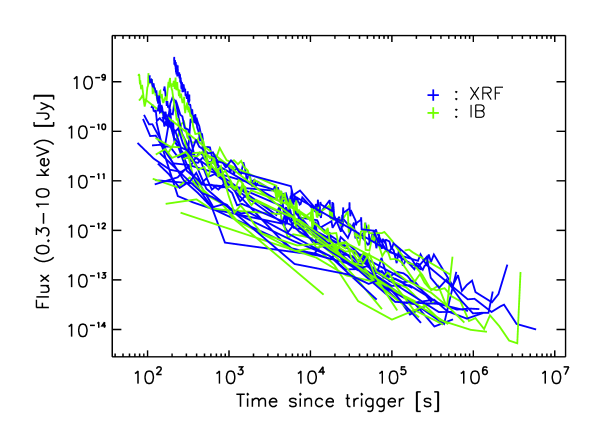
Finally, we constructed the XRT lightcurves of the XRFs and IBs (Fig. 10). As the distribution of the initial temporal decay indices suggests (Fig. 6), the XRF afterglows have a steeper initial phase, but after the first break the decay rates are consistent between the two groups.
5 UVOT afterglows
From the 46 IB, 15 has UVOT observations, but only 11 of them is bright enough
to construct the optical lightcurve. After applying the criterion for XRFs, it turns out, that
from the 11 afterglows 4 belong to the IBs and 7 belong to the XRFs.
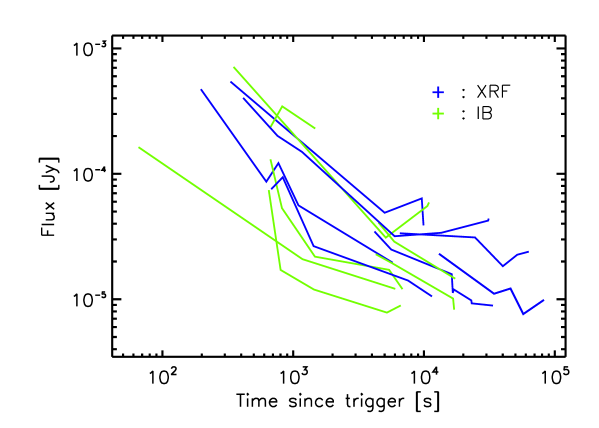
Regarding the optical lightcurves there is not any difference between the lightcurves of XRFs and IBs, they lie in the same flux range (Fig. 11).
6 Conclusion
Veres et al. (2010), based on the and distributions, showed that the IBs and XRFs probably have the same physical origin, the observable differencies in the , X-ray and optical bands may be the consequencies of the minor changes in the underlying physical processes, circumburst medium properties and/or observational effects. Our main result in this article that beside the above mentioned and the IBs and XRFs show similar properties regarding the other observed (, X-ray and optical) quantities detected by the Swift gamma-ray satellite. We have to emphasize that our conclusion concerns GRBs observed only by the Swift.
Acknowledgements
This research has made use of data obtained through the High Energy Astrophysics Science Archive Research Center Online Service, provided by the NASA/Goddard Space Flight Center and the data supplied by the UK Swift Science Data Centre at the University of Leicester. This study was supported by the Hungarian OTKA grant No. T77795.
References
- [1] Gehrels, N., Chincarini, G., Giommi, P., et al.: 2004, ApJ 611, 1005
- [2] Horváth, I.: 1998, ApJ 508, 757
- [3] Kouveliotou, C., Meegan, C. A., Fishman, G. J., Bhat, N. P., Briggs, M. S., Koshut, T. M., Paciesas, W. S., Pendleton, G. N., et al.: 1993, ApJ 413, L101
- [4] Mukherjee, S, Feigelson, E. D., Babu, G. J., Murtagh, F., Fraley, C., Raftery, A.: 1998, ApJ 508, 314
- [5] Sakamoto, T., Hullinger, D., Sato, G., et al.: 2008, ApJ 679, 570
- [6] Řipa, j., Mészáros, A., Veres, P.,Park, I. H.: 2012, ApJ 756, 44
- [7] Veres, P., Bagoly, Z., Horváth, I., Mészáros, A., Balázs, L. G.: 2010, ApJ 725, 1955