NMR investigation of spin correlations in BaCo2As2
Abstract
We use NMR techniques to investigate the magnetic properties of BaCo2As2 single crystals, the non-superconducting end member of the Co-substituted iron-pnictide high superconductor Ba(Fe1-xCox)2As2 with . We present 75As NMR evidence for enhancement of low frequency spin fluctuations below K. This enhancement is accompanied by that of static uniform spin susceptibility at the wave vector = , suggesting that the primary channel of the spin correlations is ferromagnetic rather than antiferromagnetic. Comparison between the NMR Knight shift and bulk susceptibility data uncovers the presence of two separate components of spin susceptibility with distinct temperature dependences, presumably because multiple electronic bands crossing the Fermi energy play different roles in the electronic properties of BaCo2As2
pacs:
74.70-b, 76. 60-kI Introduction
An intriguing aspect of the iron-based high superconductor LaFeAsO1-xFx ( K) Kamihara et al. (2008) and related compounds such as Ba(Fe1-xCox)2As2 ( K) Sefat et al. (2008) is their flexible nature in substituting atoms. For example, one can systematically alter the electronic properties of Ba(Fe1-xCox)2As2 by increasing the Co content from the Spin Density Wave (SDW) ordered parent phase BaFe2As2 ( K) Rotter et al. (2008), the superconducting phase Ba(Fe0.92Co0.08)2As2 ( K) Sefat et al. (2008), and to the overdoped non-superconducting phase with or greater Ni et al. (2008); Chu et al. (2009). When the Co concentration exceeds , the Fermi surface nesting effects between the hole bands at the center of the Brillouin zone and the electron bands at the edge of the Brillouin zone diminish Sekiba et al. (2009). In addition, the enhancement of antiferromagnetic spin fluctuations (AFSF) observed for the superconducting phase Ning et al. (2008, 2009a) is suppressed in the overdoped region above Ning et al. (2009b), suggesting a link between the nesting effects, AFSF, and the superconducting mechanism. Recalling that KFe2As2 with one less electron within the FeAs layers is a low superconductor Rotter et al. (2008), a natural question to ask is, what happens if one keeps increasing the Co content , and reaches BaCo2As2? Would the extra 3d electron at Co sites completely alter the electronic properties of BaCo2As2 from that of BaFe2As2?
We attempted to address these questions by synthesizing BaCo2As2 single crystals, and measuring their bulk properties Sefat et al. (2009). The in-plane electrical resistivity shows a metallic behavior with a quadratic temperature dependence below K, with a modestly large resistivity coefficient cm2. The bulk susceptibility undergoes a strong enhancement toward . In the limit, the bare magnetic susceptibility data measured along the c-axis, emu/mol, is enhanced by a factor of over the results of LDA (local density approximation) calculations, emu/mol Sefat et al. (2009). (We define the magnetic susceptibility for the formula unit throughout this paper.) The linear specific heat coefficient (mJ/K2 mol-Co) also implies a modest mass renormalization of Sefat et al. (2009). LDA results satisfy the mean-field Stoner criterion of ferromagnetism, and found a stable ferromagnetic ground state with a sizable ordered moment, 0.42/Co, even though BaCo2As2 exhibits no evidence for a ferromagnetic long range order in bulk physical properties Sefat et al. (2009) or microscopic NMR data, as shown below. The LDA results therefore hint the presence of strong ferromagnetic spin correlations Sefat et al. (2009). Recent ARPES (Angle Resolved Photo Emission Spectroscopy) measurements indeed showed that an electron pocket rather than a large hole pocket constitutes the primary Fermi surface centered around the point, eliminating the possibility of the quasi-nesting effects of the Fermi surface that tend to favor antiferromagnetic correlations Xu et al. (2013); Dhaka et al. (2013). On the other hand, by merely replacing Ba2+ ions in BaCo2As2 with Sr2+ ions, it is demonstrated that SrCo2As2 has stripe antiferromagnetic correlations, and decreases toward Pandey et al. (2013); Jayasekara et al. (2013). The contrasting behavior between BaCo2As2 and SrCo2As2 despite their analogous structures suggests that intricate details of the crystal structure, bond angles, crystal fields, and probably the electronic band structure affect their physical properties.
In this article, we will attempt to shed new light on the physical properties of BaCo2As2 through a microscopic NMR investigation. From the measurements of 75As NMR Knight shift and nuclear spin-lattice relaxation rate , we probe the nature of electronic correlations. Our results suggest that ferromagnetic spin fluctuations indeed begin to grow below about 100 K. On the other hand, comparison between and data reveals that there is a large temperature independent component in which has only a small contribution to . We therefore conclude that multiple 3d bands play different roles in BaCo2As2.
The rest of this paper is organized as follows. In section II, we will briefly describe the experimental procedures. Results and discussions, and comparison with earlier NMR works on various compositions of Ba(Fe1-xCox)2As2 will be detailed in section III. We will summarize and conclude in Section IV.
II Experimental
We grew BaCo2As2 single crystals out of CoAs flux. The details of the growth procedures and bulk characterization are described in Sefat et al. (2009). We carried out NMR measurements by assembling several pieces of small single crystals on a sample holder, and applying an external magnetic field along the aligned crystal c-axis. Typical dimensions of the crystals were mm 1mm 0.1 mm. We estimate the total mass of our NMR sample as a few mg. We employed a standard pulsed NMR spectrometer for spin echo measurements.
III Results and Discussions
III.0.1 75As NMR lineshapes and
In Fig. 1, we present representative 75As NMR lineshapes observed at various temperatures in a magnetic field of T applied along the aligned crystal c-axis. 75As nuclear spin is , hence we observe three distinct transitions at 290 K; the large sharp peak near 56.69 MHz arises from the to central transition, while two additional broad peaks located near 56.14 and 57.22 MHz are from the to satellite transitions. The growing width of the central peak at lower temperatures is primarily caused by a distribution of the Knight shift .
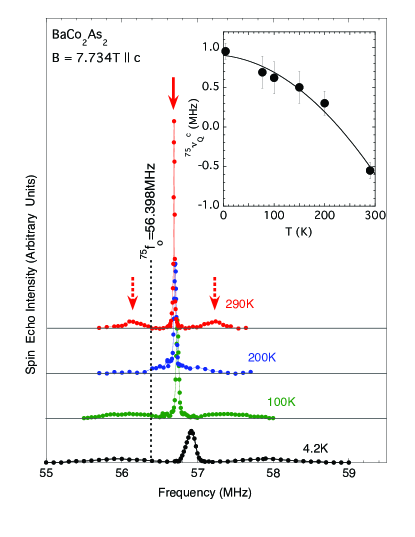
The splitting between the central and two satellite transitions is caused by the nuclear quadrupole interaction. The broader lineshape of the satellites reflects a sizable distribution of the c-axis component of the nuclear quadrupole frequency , possibly due to the presence of defects or vacancy sites. is a traceless tensor, i.e. , and is proportional to the EFG (Electric Field Gradient) tensor at the observed 75As site. NMR measurements alone do not allow us to determine the sign of EFG and . The observed magnitude of MHz at 4.2 K is comparable to MHz observed for the optimally superconducting Ba(Fe0.9Co0.1)2As2 ( K) Ning et al. (2008).
We summarize the temperature dependence of in the inset to Fig. 1, assuming that has a positive sign at 4.2 K. We emphasize that this assumption is made genuinely for convenience, to avoid confusions in the following discussions. gradually decreases with temperature up to K, where the satellite transitions are superposed with the central transition. This smooth temperature dependence is presumably caused by the thermal expansion of the lattice, which tends to decrease the magnitude of the lattice contribution Cohen and Reif (1957) to . At K, MHz becomes sizable, and we can observe distinct satellite peaks again. The implicit assumption made in our plot in the inset to Fig. 1 is that there is a negative, on-site ionic contribution to Cohen and Reif (1957). Our experimental results do not rule out an alternative possibility that the sign of remains the same, and increases from K to K. It is also interesting to recall that in the iso-structural SrCo2As2 is as large as MHz Pandey et al. (2013). An order of magnitude difference in suggests that the local charge and/or lattice environment at the As sites is markedly different between the two materials, which may be related to the fact that BaCo2As2 is ferromagnetically correlated, as shown below, while SrCo2As2 is antiferromagnetically correlated Jayasekara et al. (2013).
III.0.2 NMR Knight shift
In Fig. 2(a), we present the temperature dependence of 75As NMR Knight shift, , where is the observed peak frequency of the central transition, is the bare Zeeman frequency MHz, and the 75As nuclear gyromagnetic ratio is MHz/T. The positive frequency shift from to is caused by the Knight shift through hyperfine interactions with electron spins polarized by the applied field . For comparison, we also present reported earlier for Ba(Fe1-xCox)2As2 for representative compositions with (SDW ordered below K), (superconducting below K), and (overdoped paramagnetic metal) Ning et al. (2009b).
Quite generally, may be represented as
| (1) |
where is Avogadro’s number, and is the chemical shift. The latter may be considered temperature independent unless we are dealing with unusual circumstances, such as a change of the valence at the Co sites or a structural phase transition. is the j-th component of the spin susceptibility, and is the hyperfine coupling between the observed nuclear spin and the electrons contributing to . The superscript represents the band or orbital indices, accounting for different contributions with potentially distinct temperature dependences. We recall that all of the five 3d Fe and Co orbitals may contribute to multiple electronic bands in Ba(Fe1-xCox)2As2 and related compounds Singh and Du (2008); Kuroki et al. (2008); Graser et al. (2009); Sefat et al. (2009); Xu et al. (2013); Pandey et al. (2013); in principle associated with different bands may exhibit different temperature dependences. Analogous situation was encountered for Sr2RuO4 Imai et al. (1998). In what follows, we need to keep in our mind that is an average of various contributions of weighted by .
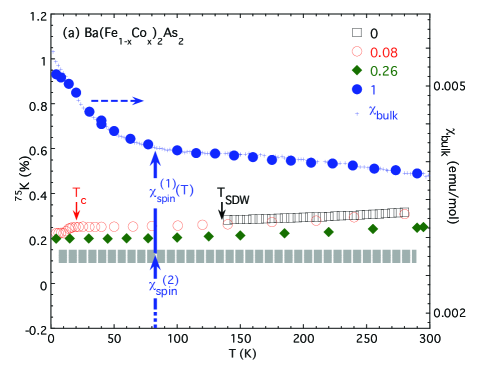
We find two striking features in our data in Fig. 2(a). First, the magnitude of in BaCo2As2 is much greater than that observed for Ba(Fe1-xCox)2As2 with . This observation is consistent with the fact that is also nearly an order of magnitude greater in BaCo2As2. Second, the observed temperature dependence of is qualitatively different from that of Ba(Fe1-xCox)2As2. In the latter, decreases with temperature, reflecting the common trend in all iron-based high superconductors, including LaFeAs(O1-xFx) Ahilan et al. (2008); Nakai et al. (2008), FeSe Imai et al. (2009), and KxFe2-ySe2 Yu et al. (2011); Kotegawa et al. (2011); Toechetti et al. (2011). Instead, in BaCo2As2 increases with decreasing temperature from 300 K, reaches a plateau below K, followed by a rapid growth below K.
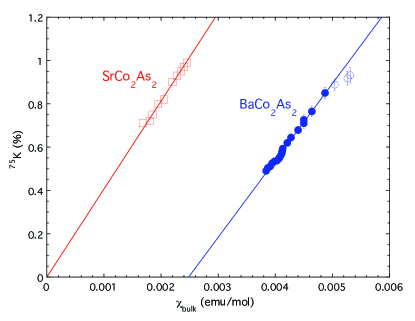
Also plotted in Fig. 2(a) using the right axis is the temperature dependence of the bulk magnetic susceptibility measured in 0.1 Tesla applied along the c-axis Sefat et al. (2009). The observed temperature dependence is qualitatively the same as that of . The upturn observed below K only for is presumably caused by a small impurity contribution obeying the Curie’s law, , because it is absent in the data. We note that is generally immune from the presence of impurity phases, and saturates below K. In Fig. 3, we plot as a function of with temperature as the implicit parameter. The straight line observed in a wide range of temperature implies that the temperature dependence of is indeed dominated by the temperature dependent component of , which we refer to .
In the case of Ba(Fe1-xCox)2As2, the temperature independent chemical shift is known to be at most % Ning et al. (2008); Kitagawa et al. (2008). Recent 75As NMR results for other compounds with Co2+ ions, SrCo2As2 Pandey et al. (2013) and LaCoAsO Ohta et al. (2010), also suggest that is negligibly small, and hence the extrapolation of the linear fit of the vs. goes through the origin. We reproduce such a linear fit observed for SrCo2As2 Pandey et al. (2013) in Fig. 3. In contrast with the case of SrCo2As2, the linear fit for BaCo2As2 crosses the horizontal axis at a large positive value of emu/mol. This term is too large to be attributed to the Van Vleck contribution, , which is of the order of emu/mol for 3d bands with a typical band width of eV. We therefore conclude that there is another temperature independent contribution emu/mol in , and we may separate the overall spin contribution into two, . We show these two separate contributions schematically with two vertical arrows in Fig. 2(a). Both the temperature dependent and temperature independent are an order of magnitude greater than the bare spin susceptibility, emu/mol, estimated by LDA calculations Sefat et al. (2009).
We can use Eq. (1) to estimate the hyperfine coupling with Co spins in the band that is responsible for . From the slope in Fig. 3, we estimate T/. This value is comparable to T/ reported for SrCo2As2 Pandey et al. (2013), and approximately twice larger than T/ reported for BaFe2As2 Kitagawa et al. (2008). The stronger hyperfine coupling might be an indication that Co orbitals responsible for enhanced ferromagnetic correlations hybridize very strongly with As 4s and/or 4p orbitals. On the other hand, Fig. 2(a) and Fig. 3 suggest that the term has a very little contribution to , which in turn implies that the hyperfine coupling with the Co 3d orbitals that are responsible for is much weaker than .
The electronic band structure calculations and ARPES measurements for BaCo2As2 revealed two new distinct features compared with the case of BaFe2As2: a small electron pocket near the point, which may favor ferromagnetic correlations, and a flat band, which tends to results in a large density of states (and hence a large contribution to Pauli susceptibility) Sefat et al. (2009); Xu et al. (2013); Dhaka et al. (2013). Therefore we tentatively attribute to the electron pocket near the point, while the temperature independent primarily to the flat portion of the band. We cannot rule out other scenarios, and call for additional theoretical analysis of the band contributions to spin susceptibility in BaCo2As2.
III.0.3 Low Frequency Spin Fluctuations As Investigated By Nuclear Spin-Lattice Relaxation Rate
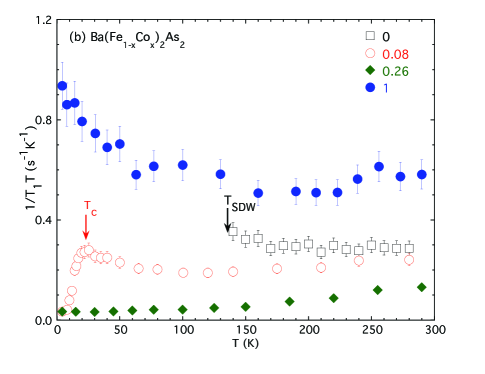
In Fig. 2(b), we present the temperature dependence of , i.e. 75As nuclear spin-lattice relaxation rate divided by temperature . In general, is a measure of the low-frequency component of spin fluctuations at the NMR frequency integrated over various wave vector modes in the first Brillouin zone Moriya (1963). for BaCo2As2 is nearly a factor of larger than that observed for the paramagnetic state of BaFe2As2 with a SDW ground state. This may be partly because the hyperfine couplings are twice larger in the present case, as discussed in the previous section.
It is important to realize that the temperature dependence of observed for BaCo2As2 below K is qualitatively similar to that of the uniform mode of the spin susceptibility, . This finding is different from the case of Ba(Fe1-xCox)2As2, where the growth of at low temperatures is caused by antiferromagnetic spin fluctuations Ning et al. (2008, 2009a, 2009b), and hence the uniform spin susceptibility does not grow at low temperatures. These considerations lead us to conclude that the primary channel of the electronic correlations in BaCo2As2 is ferromagnetic in nature.
IV Summary and Conclusions
We have reported NMR measurements of local spin susceptibility and low frequency spin fluctuations of BaCo2As2. We demonstrated that both the NMR Knight shift and grow toward due to ferromagnetic spin correlations. Our conclusion is in agreement with earlier results based on bulk susceptibility and specific heat data, combined with LDA calculations Sefat et al. (2009). In addition, our results in Fig. 2 show that the so-called Korringa ratio, Moriya (1963), is as large as 10.3 at 4.2 K. Ignoring the potential complications arising from the quasi-two dimensionality, the multi-band nature of the electronic states, and the wave-vector dependence of hyperfine couplings, such a large Korringa ratio, , is indeed consistent with the presence of ferromagnetic correlations.
Our findings are in a remarkable contrast with the case of the other end member, BaFe2As2, with a SDW ordered ground state, and modestly Co-substituted superconducting Ba(Fe1-xCox)2As2. In these cases, the growth of spin fluctuations reflected on is not accompanied by that of , because the dominant correlation effects are antiferromagnetic at least up to Ning et al. (2009b). Our new NMR results are also qualitatively different from those reported for SrCo2As2 Pandey et al. (2013) with a nearly antiferromagnetic ground state Jayasekara et al. (2013); both NMR Knight shift and decrease with temperature toward in SrCo2As2. It remains to be seen why the electronic properties are so different between BaCo2As2 and SrCo2As2.
From the comparison of and , we also inferred that ferromagnetic enhancement does not affect all electronic bands. Some Co 3d electrons contribute to a temperature dependent term of spin susceptibility, which grows to emu/mol at 4.2 K. On the other hand, an equally large but temperature independent contribution, emu/mol, arises from Co 3d orbitals with smaller hyperfine couplings with 75As nuclear spins. The latter implies that these Co 3d orbitals have weaker hybridization with As 4s and 4p orbitals. Preliminary 59Co NMR measurements showed that the 59Co NMR Knight shift exhibits analogous temperature dependence as 75As NMR Knight shift . The sign of in the present case, however, is negative, rather than positive observed in Ba(Fe0.9Co0.1)2As2 Ning et al. (2008). The reversal of the sign suggests that the hyperfine coupling of Co orbitals, and hence the nature of their hybridization, is different in the present case. We caution that our NMR data and analysis do not entirely rule out the possibility of antiferromagnetic spin correlations associated with . In this context, it is worth recalling that another well-known multi-band system, Sr2RuO4, turned out to exhibit strong antiferromagnetic spin correlations for two of the three bands, contrary to the initial expectations held by many authors Braden et al. (2011).
It is natural to speculate that and arise from separate parts of the Fermi surface, such as the electron pocket near the point and the flat portion of the band with a large density of states, respectively. Regardless of their origins, our finding implies that Hund’s coupling is not strong enough in BaCo2As2 to force all seven 3d electrons at Co2+ sites to exhibit an identical behavior. In this sense, the magnetism in BaCo2As2 seems more itinerant in character than localized, in agreement with the fact that resistivity shows a Fermi liquid behavior below K Sefat et al. (2009).
Acknowledgements.
The work at McMaster was supported by NSERC and CIFAR. The work at Oak Ridge National Laboratory was supported by the Department of Energy, Basic Energy Sciences, Materials Sciences and Engineering Division. The work at Zhejiang was supported by National Basic Research Program of China (No.2014CB921203, 2011CBA00103), NSF of China (No. 11274268).References
- Kamihara et al. (2008) Y. Kamihara, T. Watanabe, M. Hirano, and H. Hosono, J. Amer. Chem. Soc. 130, 3296 (2008).
- Sefat et al. (2008) A. S. Sefat, R. Jin, M. A. McGuire, B. C. Sales, D. J. Sing, and D. Mandrus, Phys. Rev. Lett. 101, 117004 (2008).
- Rotter et al. (2008) M. Rotter, M. Tegel, and D. Johrendt, Phys. Rev. B. 78, 020503 (2008).
- Ni et al. (2008) N. Ni, M. E. Tillman, J. Q. Yan, A. Kracher, S. T. Hannahs, S. L. Bud’ko, and P. C. Canfield, Phys. Rev. B 78, 214515 (2008).
- Chu et al. (2009) J. H. Chu, J. G. Analytis, C. Kucharczyk, and I. R. Fisher, Phys. Rev. B 79, 014506 (2009).
- Sekiba et al. (2009) Y. Sekiba, T. Sato, K. Nakayama, K. Terashima, P. Richard, J. H. Bowen, H. Ding, Y.-M. Xu, L. J. Li, G. H. Cao, et al., New J. Phys. 11, 025020 (2009).
- Ning et al. (2008) F. L. Ning, K. Ahilan, T. Imai, A. S. Sefat, R. Jin, M. A. McGuire, B. C. Sales, and D. Mandrus, J. Phy. Soc. Jpn. 77, 103705 (2008).
- Ning et al. (2009a) F. L. Ning, K. Ahilan, T. Imai, A. S. Sefat, R. Jin, M. A. McGuire, B. C. Sales, and D. Mandrus, J. Phy. Soc. Jpn. 78, 013711 (2009a).
- Ning et al. (2009b) F. L. Ning, K. Ahilan, T. Imai, A. S. Sefat, M. A. McGuire, , B. C. Sales, D. Mandrus, P. Cheng, B. Shen, et al., Phys. Rev. Lett. 104, 037001 (2009b).
- Sefat et al. (2009) A. S. Sefat, D. J. Sing, R. Jin, M. A. McGuire, B. C. Sales, and D. Mandrus, Phys. Rev. B 79, 024512 (2009).
- Xu et al. (2013) N. Xu, P. Richard, A. van Roekeghem, P. Zhang, H. Miao, W.-L. Zhang, T. Qian, M. Ferrero, A. S. Sefat, S. Biermann, et al., Phys. Rev. X. 3, 011006 (2013).
- Dhaka et al. (2013) R. S. Dhaka, Y. Lee, V. K. Anand, D. C. Johnston, B. N. Harmon, and A. Kaminski, Phys. Rev. B 87, 214516 (2013).
- Pandey et al. (2013) A. Pandey, D. G. Quirinale, W. Jayasekara, A. Sapkota, M. G. Kim, R. S. Dhaka, Y. Lee, T. W. Heitmann, P. W. Stephens, V. Ogloblichev, et al., Phys. Rev. B 88, 014526 (2013).
- Jayasekara et al. (2013) W. Jayasekara, Y. Lee, A. Pandey, G. S. Tucker, A. Sapkota, J. Lamsal, S. Calder, D. L. Abernathy, J. L. Niedziela, B. N. Harmon, et al., Phys. Rev. B 111, 157001 (2013).
- Cohen and Reif (1957) M. H. Cohen and F. Reif, Solid State Physics 5, 321 (1957).
- Singh and Du (2008) D. J. Singh and M.-H. Du, Phys. Rev. Lett. 100, 237003 (2008).
- Kuroki et al. (2008) K. Kuroki, S. Onari, R. Arita, H. Usui, Y. Tanaka, H. Kontani, and H. Aoki, Phys. Rev. Lett. 101, 087004 (2008).
- Graser et al. (2009) S. Graser, T. A. Maier, P. J. Hirschfeld, and D. J. Scalapino, New J. Phys. 11, 025016 (2009).
- Imai et al. (1998) T. Imai, A. W. Hunt, K. R. Thurber, and F. C. Chou, Phy. Rev. Lett. 81, 3006 (1998).
- Ahilan et al. (2008) K. Ahilan, F. L. Ning, T. Imai, A. S. Sefat, R. Jin, M. A. McGuire, B. C. Sales, and D. Mandrus, Phys. Rev. B 78, 100501 (2008).
- Nakai et al. (2008) Y. Nakai, K. Ishida, Y. Kamihara, M. Hirano, and H. Hosono, J. Phys. Soc. Jpn. 77, 073701 (2008).
- Imai et al. (2009) T. Imai, K. Ahilan, F. L. Ning, T. M. McQueen, and R. J. Cava, Phy. Rev. Lett. 102, 177005 (2009).
- Yu et al. (2011) W. Yu, L. Ma, J. B. He, D. M. Wang, T.-L. Xia, and W. B. G. F.C̃hen, Phys. Rev. Lett. 106, 197001 (2011).
- Kotegawa et al. (2011) H. Kotegawa, Y. Hara, H. Nohara, H. Tou, Y. Mizuguchi, H. Takeya, and Y. Takano, J. Phys. Soc. Jpn. 80, 043708 (2011).
- Toechetti et al. (2011) D. A. Toechetti, M. Fu, D. C. Christensen, K. Nelson, T. Imai, H. C. Lei, and C. Petrovic, Phys. Rev. B 83, 104508 (2011).
- Kitagawa et al. (2008) K. Kitagawa, N. Katayama, K. Ohgushi, M. Yoshida, and M. Takigawa, J. Phys. Soc. Jpn. 77, 114709 (2008).
- Ohta et al. (2010) H. Ohta, C. Michioka, and K. Yoshimura, J. Phys. Soc. Jpn. 79, 054703 (2010).
- Moriya (1963) T. Moriya, J. Phys. Soc. Jpn. 18, 516 (1963).
- Braden et al. (2011) M. Braden, Y. Sidis, P. Bourges, P. Pfeuty, J. Kulda, Z. Mao, and Y. Maeno, Phys. Rev. B 66, 064522 (2002).