The mass distribution of the strong lensing cluster SDSS J1531+3414**affiliation: Based on observations made with the NASA/ESA Hubble Space Telescope, obtained at the Space Telescope Science Institute, which is operated by the Association of Universities for Research in Astronomy, Inc., under NASA contract NAS 5-26555. These observations are associated with program GO-12267
Abstract
We present the mass distribution at the core of SDSS J1531+3414, a strong-lensing cluster at . We find that the mass distribution is well described by two cluster-scale halos with a contribution from cluster-member galaxies. New HST observations of SDSS J1531+3414 reveal a signature of ongoing star formation associated with the two central galaxies at the core of the cluster, in the form of a chain of star forming regions at the center of the cluster. Using the lens model presented here, we place upper limits on the contribution of a possible lensed image to the flux at the central region, and rule out that this emission is coming from a background source.
Subject headings:
galaxies: clusters: general — gravitational lensing — galaxy clusters: individual: SDSS J1531+34141. Introduction
The number of galaxy clusters that are known to be strong lenses has increased dramatically over the last decade, from a handful of massive clusters, to hundreds of systems with masses ranging from group-scale to super-massive nodes on the cosmic web. This progress is made possible thanks to dedicated surveys that utilize wide field imaging, cluster finding algorithms, and extensive followup. One such survey is the Sloan Giant Arcs Survey (SGAS, Gladders et al. in prep; Bayliss et al. 2011; Hennawi et al. 2008). In short, galaxy clusters were optically selected from the Sloan Digital Sky Survey (SDSS, York et al. 2000) data, based on the red sequence technique (Gladders & Yee 2000). Each galaxy cluster field was then rendered to create a color image with scaling parameters selected to enhance low signal-to-noise features, and inspected by astronomers for evidence of strong lensing. Candidate lenses were imaged with larger telescopes, and all the high confidence lensed galaxies (arcs) were followed up spectroscopically. The multi-wavelength SGAS followup includes spectroscopy of all the bright arcs (Bayliss et al. 2011), and for different subsamples of the clusters, we have Subaru imaging for weak lensing (Oguri et al. 2012), Spitzer imaging, UV imaging (Bayliss 2012), radio observations of the Sunyaev-Zel’dovich (SZ) Effect (Gralla et al. 2011), detailed, medium resolution and IFU spectroscopy (Wuyts et al. 2012a,b; Rigby et al. 2014; Bayliss et al. 2013; Wuyts et al. 2014), and HST imaging (Bayliss et al. 2013). This multi-wavelength approach enables the study of both the lensed background galaxies, some of which are highly magnified (Wuyts et al. 2012a, Rigby et al. 2014, Koester et al, Bayliss et al. 2010; Gladders et al. 2013; Dahle et al. 2013), and the lensing clusters themselves (Gralla et al 2011; Bayliss et al. 2011, 2014; Blanchard et al. 2013).
High resolution HST imaging as part of HST Cycle 20 program GO13003 (PI: Gladders) was obtained for 37 SGAS cluster fields, in order to study the lensed sources, and answer fundamental questions about the galaxy population at the peak of the star formation history of the Universe. The main scientific goal of this program is to determine the morphology of star formation and the fundamental sizes of star forming regions in galaxies at that epoch. The combination of lensing magnification by galaxy clusters and the HST resolution can uniquely access individual star forming regions in these distant galaxies, and probe scales down to 100 pc. Typical SGAS arcs, by selection, are bright enough for ground-based followup and detailed spectroscopy to explore the physical conditions in these galaxies. On the other hand, they are not necessarily intrinsically luminous, and are thus more representative of their population than bright unlensed field galaxies.
The study of the background source, as well as the mass distribution at the core of the galaxy cluster, relies on the availability of a robust lens model. The lensing magnification and its uncertainty are needed in order to convert measured quantities such as luminosity, star formation rate, stellar mass and sizes to their unlensed values. Moreover, images of lensed galaxies can be highly distorted, especially when they form giant arcs. The mass model allows us to compute an image of the source galaxy, by ray-tracing through the lensing equation (e.g., Sharon et al. 2012).
SDSS J1531+3414 was discovered as part of SGAS and first presented in Hennawi et al. (2008) as a definite lensing cluster, based on ground-based imaging detection of multiple prominent arcs. The cluster redshift, , was determined from SDSS spectroscopy of three galaxies, including the brightest cluster galaxy (BCG). Followup spectroscopic observations were executed in 2008 with the Gemini Multi-Object Spectrograph (GMOS; Hook et al. 2004), yielding redshifts of eight cluster galaxies and three background sources (Bayliss et al. 2011). Bayliss et al. also measured a velocity dispersion of km s-1 for this cluster, indicating that it is moderately massive.
Gralla et al. (2011) report an SZ mass and lensing analysis of SDSS J1531+3414 as part of a study of the mass-concentration relation in 10 lensing-selected clusters. They measured M M⊙, where Mpc, using an SZ-weak lensing scaling relation from Marrone et al. (2012). They report an Einstein radius of for a source at with an estimated uncertainty of 5%. Oguri et al. (2012) used Subaru imaging in a combined weak and strong lensing analysis of 28 SGAS clusters, including SDSS J1531+3414. They measured an Einstein radius of for a source at and a weak lensing mass M⊙, in line with the velocity dispersion measurement, within errors. In both Gralla et al. (2011) and Oguri et al. (2012), the strong lensing analysis was based on ground-based imaging, which led to misinterpretation of some of the lensed features due to the poor resolution.
Our recent HST imaging data of SDSS J1531+3414 revealed that what was suspected to be light from images of radial arcs close to the central galaxies, is in fact emission from ongoing star formation in the form of star clusters forming a “beads on a string” morphology. We report on this unusual galaxy-cluster star formation in a companion paper, Tremblay et al. (2014).
In this paper, we present the mass distribution in the inner 100 kpc of SDSS J1531+3414 from detailed strong lensing model, based on the new HST imaging. We describe the HST data in § 2; the lensing analysis, including revised identification of lensed galaxies and their redshifts, the lens modeling process, and the derived model results are described in § 3; finally, we discuss implications for the star formation detected in the core of SDSS J1531+3414 in § 4. Throughout the paper we assume a flat cosmology with , , and km s-1 Mpc-1. In this cosmology, corresponds to 4.64 kpc at the cluster redshift, . Magnitudes are reported in the AB system.
2. Data
SDSS J1531+3414 was observed as part of HST Cycle 20 program GO13003 (PI: Gladders) during three orbits on UT 2013 May 06. The observation was restricted to the WFC3 cameras in order to reduce overheads, and split between the IR and UVIS detectors. The filters were selected to provide good sampling of the spectral energy distribution of the main lensed galaxy, at : in the UVIS channel, it was observed in three filters, F390W (2256 s), F606W (1440 s), and F814W (1964 s); and in the IR channel, it was observed with the F160W filter (912 s). Each image was executed in four sub exposures with sub-pixel dithers in order to fill the chip gap and to remove cosmic rays, hot or bad pixels, and other artifacts. Individual images were combined onto a common grid using AstroDrizzle (Gonzaga et al. 2012) with a pixel scale of pixel-1, and drop size of 0.5 for the IR filters and 0.8 for the UVIS filters. These values were selected to provide the best sampling of the point spread function in each filter. Images taken with the WFC3 camera are known to have several artifacts that degrade the data quality. In the IR channel, circular areas with lowered sensitivity are referred to as “IR Blobs” in the WFC3 Data Handbook (Rajan et al. 2010). We used a custom algorithm to remove the IR blobs from all the images, by modeling these blobs in a superflat image created from all the IR imaging in our program, and flatfielding these artifacts out. This procedure was applied to each IR image prior to drizzling. In the UVIS channel, the declining charge transfer efficiency (CTE) of the detector can cause large flux losses and increase the level of correlated noise in the image. To mitigate the CTE losses, the bluest UVIS data were taken with post-flash, to increase the image background and ensure that faint sources have high enough counts (see WFC3 Data Handbook, Raja et al. 2010). Post-observation image corrections were applied to individual exposures using the Pixel-based Empirical CTE Correction Software111http://www.stsci.edu/hst/wfc3/ins_performance/CTE/ provided by STScI. In the final reduced data, the limiting magnitudes for detection are m=26.5 mag in the F390W filter, and m=26.1 mag in F606W, F814W and F160W.
3. Lensing Analysis
3.1. Identification of Lensed Images
The main lensed features in SDSS J1531+3414 are detectable in ground-based imaging, and were targeted for spectroscopy prior to the HST observation, as part of a spectroscopic campaign to secure redshifts of background sources and cluster galaxies in a large sample of SGAS galaxies. These spectroscopic observations and analyses are described in Bayliss et al. (2011), and we refer the reader to that publication for further details. For consistency, we mention the image IDs of Bayliss et al. (2011).
The lensing system of SDSS J1531+3414 consists of three confirmed strongly-lensed galaxies. We describe each of these systems below.
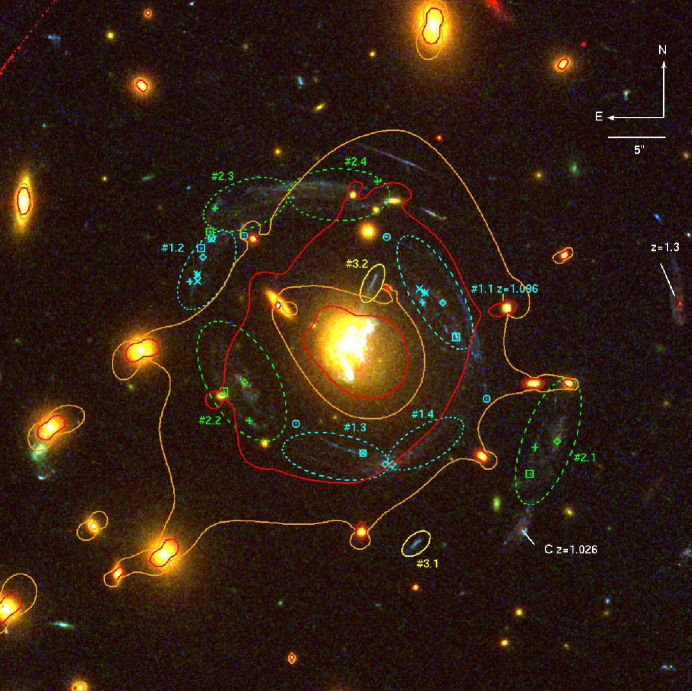
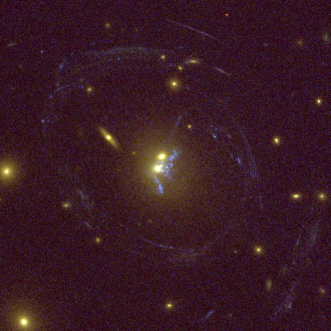
System #1 is multiply imaged into five images (Figure 1). Images 1.1 and 1.2 are complete images of the background galaxy, and 1.3 and 1.4 are partial images forming a merging pair south of the cluster core. A fifth image is predicted by the lens model to lie close to the central cluster galaxies, but is not uniquely identified. Several emission knots in images 1.1, 1.2, 1.3 and 1.4 were targeted for spectroscopy by Bayliss et al. (2011; A1-A4 in their Figure 5) and show identical features, including strong emission line from O II, which confirms the lensing interpretation. The source is spectroscopically confirmed to be at z=1.096 (Bayliss et al. 2011).
System #2 is composed of five images as well. Similarly to system #1, images 2.1 and 2.2 are complete images of the background galaxy, and image 2.3 and 2.4 form a merging pair at the north of the cluster center. A fifth image is predicted behind the central galaxies, and is not identified. The redshift of Source #2 is not spectroscopically determined. Bayliss et al. (2011) targeted images 2.1, 2.2, 2.3 for spectroscopy: some of these spectra show a blue continuum with no features, providing a lower limit of , and the other spectra were not useful for measuring redshifts due to contamination of one or both nod-and-shuffle traces by chance collision with other galaxies and stars. We note that in Bayliss et al. (2011), image 2.3 is labeled as B1, and due to a typographical error it was erroneously reported to be at .
Source #3 is multiply imaged into a tangential arc (3.1) and radial arc (3.2). A spectrum of the radial arc was obtained by Bayliss et al. (2011) and shows low signal-to-noise blue continuum with no features, which supports a lower limit of . Image 3.1 was not targeted for spectroscopy.
Images A5, A6, B2, and C1 in Bayliss et al. (2011) are found to be not multiply-imaged and are thus not used as constraints in this work.
| Source | ID | RA [o] | Dec [o] | |
|---|---|---|---|---|
| #1 | 11.1 | 232.798460 | 34.242414 | 1.096 |
| 11.2 | 232.791470 | 34.241359 | ||
| 11.3 | 232.792900 | 34.237469 | ||
| 11.4 | 232.793120 | 34.237454 | ||
| 12.1 | 232.798830 | 34.241860 | ||
| 12.2 | 232.792040 | 34.241349 | ||
| 13.1 | 232.798630 | 34.241870 | ||
| 13.2 | 232.792140 | 34.241676 | ||
| 14.1 | 232.798610 | 34.242029 | ||
| 14.2 | 232.791970 | 34.241605 | ||
| 15.1 | 232.798500 | 34.242660 | ||
| 15.2 | 232.791060 | 34.240519 | ||
| 16.1 | 232.798210 | 34.242889 | ||
| 16.2 | 232.793790 | 34.237723 | ||
| 17.1 | 232.797250 | 34.242966 | ||
| 17.2 | 232.793110 | 34.242933 | ||
| 17.3 | 232.795740 | 34.238452 | ||
| 17.4 | 232.790180 | 34.239033 | ||
| #2 | 21.1 | 232.788120 | 34.238060 | |
| 21.2 | 232.797260 | 34.239392 | ||
| 22.1 | 232.788770 | 34.237850 | ||
| 22.2 | 232.797100 | 34.238497 | ||
| 22.3 | 232.798090 | 34.243633 | ||
| 22.4 | 232.793370 | 34.244258 | ||
| 23.1 | 232.788910 | 34.237212 | ||
| 23.2 | 232.797800 | 34.239135 | ||
| 23.3 | 232.798250 | 34.243064 | ||
| #3 | 30.1 | 232.793550 | 34.241752 | |
| 30.2 | 232.792240 | 34.235538 |
Note. — Positions of the lensed features that were used as constraints in the lens model. The redshifts and redshift limits are from Bayliss et al. (2011).
3.2. Strong Lens Model
The lens plane is modeled with Lenstool (Jullo et al. 2007), based on the identification of arcs and galaxies in the new HST imaging, and redshifts from Bayliss et al. (2011). The minimization is done in both the source plane and in the image plane, using a Markov Chain Monte Carlo minimizer. The modeling is done iteratively, starting with the high confidence arcs, and adding on constraints as other multiply imaged features are identified with the help of the model. We use as lensing constraints individual emission knots in each of the lensed images, and the spectroscopic redshift of source #1 (Table 1). The redshifts of the other two sources are set as free parameters with a lower prior of , as indicated by the spectroscopy, while forcing knots that belong to the same galaxy to have the same redshift. Figure 1 shows the lensed systems, with the emission knots that were used as constraints labeled. The lens plane is represented by several pseudo-isothermal ellipsiodal mass distribution (PIEMD222This profile is formally the same as dual Pseudo Isothermal Elliptical Mass Distribution (dPIE, see Elíasdóttir et al. 2007).) halos, described by the following parameters: position , ; a fiducial velocity dispersion ; a core radius ; a truncation radius ; ellipticity , where and are the semi major and semi minor axes, respectively; and a position angle . Cluster galaxies were selected by their F606W-F814W color in a color-magnitude diagram, also matching the colors of the spectroscopically-confirmed cluster members from Bayliss et al. (2011). All galaxies brighter than F814W 23.5 mag in the WFC3 field of view were included in the model. Each cluster galaxy is assigned a PIEMD halo, with positional parameters (, , , ) that follow their observed measurements, fixed at 0.15 pc, and and scaled with their luminosity (see Limousin et al. 2005 for a description of the scaling relations). We allow all the parameters of the cluster PIEMD to vary, except for , which is not constrainable by the lensing evidence and was thus set to 1.5 Mpc. We also include a group-size PIEMD halo SE of the BCG, to represent the dark matter halo of a small group of galaxies. We initially allowed all of its parameters to vary, however, some parameters were not sensitive to the lensing constraints, and a large range of values within the priors was allowed. We therefore arbitrarily fixed , and . The positional parameters, and are strongly correlated with each other (following the linear relation , where and are measured in arcseconds East and North of the BCG, see table 2), but are otherwise only weakly constrained by the lensing evidence. We have also experimented with adding another group-size halo component in the direction of the bright galaxy 27” North of the BCG, which is the second brightest galaxy in the cluster core, by allowing the parameters of that galaxy to vary. Similar attempts were made by freeing the parameters of the central galaxies and other galaxies close to lensed features. These iterations did not result in better models, and thus the parameters of all the cluster galaxies are set according to the same scaling relations.
3.3. Results
We find that the cluster is well represented by two cluster- or group-sized halos plus contribution from galaxy-scale halos. The first halo is centered close to the BCG, and the second one south-East of the BCG, contributing shear to the lensing potential.
Table 2 lists the best-fit parameters and uncertainties, and values of fixed parameters. The model uncertainties were determined through the MCMC sampling of the parameter space and limits are given. The image plane RMS of the best-fit lens model is ″.
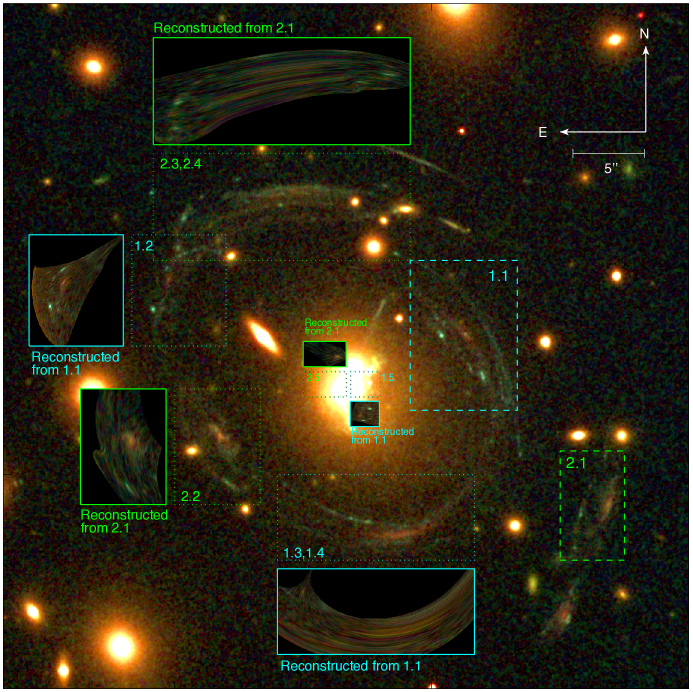
To demonstrate the predictive power of the model and provide a visual indication of its robustness, we show in Figure 2 image reconstructions of the counter-images of 1.1 and 2.1. The reconstruction of counter images is computed by first ray-tracing each pixel in a rectangular region to the source plane and calculating its source position, and then searching for other pixels in the image plane that are de-lensed to the same source position. These pixels are then assigned the same flux values as the pixel that was ray-traced. The result is a model prediction of the appearance of all the lensed images, from one of the lensed images of the source (image 1.1 and 1.2 are selected to be the starting point of this exercise because they are complete images of their respective sources). In the figure, the predicted images are displaced from their predicted location in order to allow a visual comparison between the model-prediction and the data. We find good agreement between the obesrved and reconstructed counter images of images 1.2,1.3,1.4 and 2.2,2.3,2.4, both in position and morphology. The predicted fifth image of each system cannot be uniquly identified in the imaging data (see § 4).
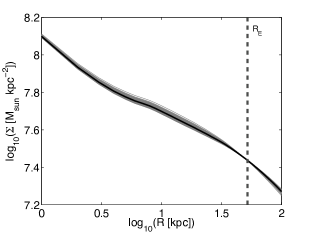
Strong lensing analysis produces a measurement of the mass in the region of the strong lensing evidence. We thus refrain from extrapolating the model to larger radii, and report the total mass enclosed within kpc, approximately the area in which the lensing constraints are found: M⊙. The projected mass density profile out to 100 kpc is plotted in Figure 3.
The PIEMD fiducial velocity dispersions of the two halos are = km s-1 and = km s-1 for the main and secondary halos, respectively. To compare the PIEMD parameter to the velocity dispersion that was measured by Bayliss et al. (2011), we need to take into account that the PIEMD fiducial velocity dispersion is not exactly the velocity dispersion one measures from the distribution of galaxy redshifts. We use the PIEMD formalism given by Elíasdóttir et al. (2008), and integrate their equations (A29) and (A30) numerically to find the ratio between a measured velocity dispersion and the PIEMD fiducial velocity dispersion. For the best-fit parameters found in our model (), and the radius in which the velocity dispersion was measured (), the ratio between a measured velocity dispersion and the PIEMD fiducial velocity dispersion is , assuming no anisotropy and a spherically symmetric profile. The corrected best-fit velocity dispersion of the main halo is thus km s-1. This value is formally in agreement (within uncertainties) with the velocity dispersion that was measured by Bayliss et al. (2011), km s-1 from 11 galaxies; nevertheless, the offset can be a result of the complexity of the mass distribution, and the ellipticity of the halos.
Since the lens model is composed of two elliptical halos the velocity dispersion of the system as a whole will account for the sum of their masses. For this comparison, we integrate the enclosed projected mass density of a single spherical PIEMD halo out to kpc and find that in order to produce the model-derived enclosed mass the corrected PIEMD fiducial velocity dispersion would be 892 km s-1, closer to the observed value.
The best fit model predicts a redshift of for source #2, and for source 3, with a strong correlation between the redshift of source #2 and the main halo parameters. The relation between the redshift of source #2 and the velocity dispersion is consistent with km s-1. A similar linear correlation is found with the core radius and with the mass of the halo, due to the analytical relation between the core radius, velocity dispersion, and mass in the PIEMD profile. Similarly, the projected mass density enclosed in a radius of kpc is correlated with the redshift of source #2, and follows the relation M⊙. We thus expect to derive higher values of , , and enclosed mass if a higher redshift is measured for source #2 in future spectroscopic observations.
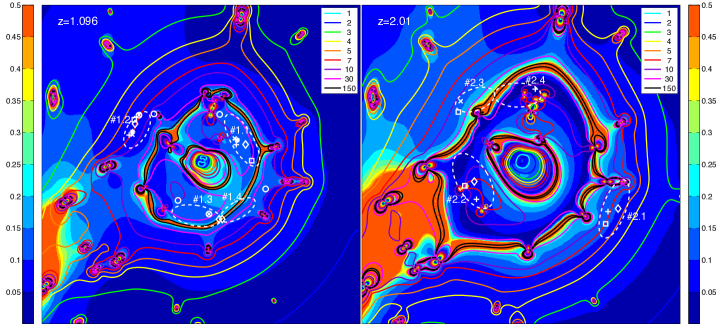
We derive a best-fit lensing magnification and uncertainties from a suite of models, computed from sets of parameters taken from the MCMC sampling, and representing 1- in the parameter space. Figure 4 shows the magnification of the best-fit model as contours, and its uncertainty as color scale, in each position in the image plane for two source redshifts: a source at 1.096 and a source at , which is the predicted redshift of source #2. The uncertainties take into account the distribution of model-predicted redshifts for source #2. We note that the relative uncertainty () is largest close to the critical curves, as well as in the direction of the secondary halo, whose position is poorly constrained. Nevertheless, in the locations of the lensing constraints, the magnification uncertainty is typically below 20%, with the exception of arcs very close to the critical curves.
The Einstein radius, , is often used as an indicator of the lensing cross section. In a spherically symmetric lens the tangential critical curve is a circle, and would be the radius of that circle. Here, we define , where is the area enclosed by the tangential critical curve; for a circular lens the two definitions are identical. The lensing configuration in this cluster can provide a robust estimate of . We find an Einstein radius of for a source at 1.096 and for a source at the model predicted redshift of source #2. The uncertainty of the latter takes into account the distribution of predicted redshifts for source #2.
| Halo | RA | Dec | |||||
|---|---|---|---|---|---|---|---|
| (PIEMD) | () | () | (deg) | (kpc) | (kpc) | (km s-1) | |
| Halo 1 | [1500] | ||||||
| Halo 2 | [50] | [1500] | |||||
| L* galaxy | [0.15] | [40] | [170] |
Note. — All coordinates are measured in arcseconds East and North of the center of the BCG, at [RA, Dec]=[232.79429 34.240312]. The ellipticity is expressed as . is measured North of West. Error bars correspond to 1- confidence level as inferred from the MCMC optimization. Values in square brackets are for parameters that were not optimized. The location and the ellipticity of the matter clumps associated with the cluster galaxies and the BCG were kept fixed according to their light distribution, and the fixed parameters determined through scaling relations (see text).
3.3.1 Comparison to Previous Work
Gralla et al. (2011) presented a joint analysis of SZ and strong lensing in 10 strong lensing clusters, including SDSS J1531+3414. The Einstein radius they report for SDSS J1531+3414 is ″ for a source at , with an estimated statistical uncertainty of up to 5%. This measurement is higher than the one we find here, , for a source at . The reason for the discrepancy is that the lensing analysis in Gralla et al. (2011) was based on ground-based imaging: in those data, the interpretation of the lensing configuration was ambiguous and the identification of counter images was lacking.
A strong lensing model for SDSS J1531+3414 was also published by Oguri et al. (2012), based on identification of the images of source #1 in Subaru data, and on its spectroscopic redshift from Bayliss et al. (2011). Oguri et al. (2012) report an Einstein radius of for a source at , in agreement with our result (within uncertainties).
4. Discussion: The Core of SDSS J1531+3414
The high resolution, multiband shallow HST images of SDSS J1531+3414 reveal unusual star formation activity near the core of the cluster (Figure 5). This star formation is detected in the form of multiple blue emission knots on a scale of approximately 0.5-1 kpc in diameter, and spanning 27 kpc across. In a companion paper (Tremblay et al. 2014), we analyze this emission and report on the star forming activity and the spatial distribution of the star forming regions, and discuss limits on their age and formation scenarios. In this paper, we determine what portion of the observed emission is attributed to images of a background galaxy or galaxies.
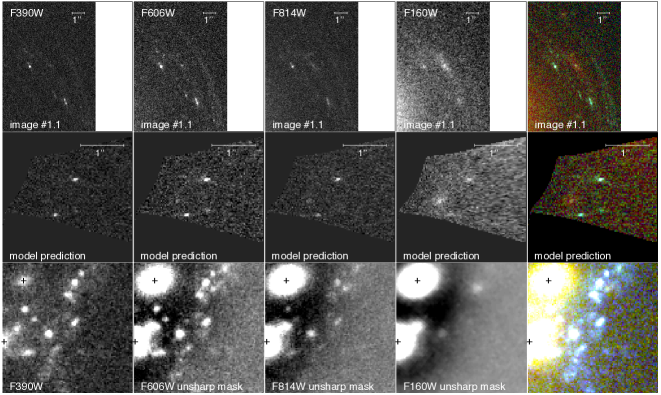
As described above, the lens model predicts the formation of a fifth lensed image for both source #1 and source #2, and a third image for source #3. These images are predicted to lie close to the center of the cluster, and are often referred to as central images. In most lensing configurations, the central image is not highly magnified, and often it is demagnified (i.e., ) and undetectable. In the case of SDSS J1531+3414, the lens model predicts that the central image of source #1 is somewhat magnified, by approximately 2, with a spatial size comparable to that of the SF region. Nevertheless, it would be significantly less magnified than images 1.1-1.4. Quantitatively, the brightest emission knot in the predicted fifth image of source #1 would be at least two magnitudes fainter than that in image 1.2 (marked with a cyan cross in Figure 1), which would result in F390W magnitude mag. The emission knots that are detected in the F390W image, in the innermost , are significantly brighter, with magnitudes ranging from 23 to 26 mag. The central images of sources #2 and #3 are predicted to be demagnified, and are fainter than our detection limit. Figure 6 shows the predicted central image of source #1 in the four HST bands, and the corresponding area in the images. Since the light of the central cluster galaxies dominate the center of the cluster in all but the bluest band, we created an unsharp mask to reveal the central morphology. The unsharp mask was created by convolving the image with a gaussian with a width of 20 pixels and subtracting it from the original image. We note that the HST point spread function was not applied to the predicted image in Figure 6. The predicted image has two faint knots in the F390W band; a few more faint knots in the F606W bands, only one knot in the F814W band; and in the F160W, the brightest feature is the center of the lensed galaxy. It is thus possible that at most one or two of the knots are brighter than the detection limit in the F390W band, but they do not correspond to the much brighter knots that are reported on in Tremblay et al. (2014). The center of the lensed galaxy, which is most noticeable in the F160W image, does not have a counterpart at the predicted location within the detection limit and colors. It is possible that the faint fifth image is obscured by the light of the much brighter star formation knots.
Further evidence against the identification of the bright emission knots as lensed galaxies comes from presence of H flux at the cluster redshift, in spectroscopic observations using the Nordic Optical Telescope (NOT). These observations are described in Tremblay at al. (2014). Had these emission knots been a counter image of source #1, these observations would have revealed strong [O II] emission at 1.096. A careful reduction of the NOT spectra and a thorough examination of the data reveals no trace of emission from the fifth image of source #1 where this emission line is expected.
We conclude the emission in the clumps that are detected close to the two central galaxies is too bright to be coming from counter images of the lensed galaxies, and rule out that a faint central image of a background source contributes significantly to this emission.
In summary, we present new HST imaging data and a lens model of the strong lensing cluster SDSS J1531+3414. We detect three lensed background sources, and uniquely identify their multiple images that stretch to form giant arcs around the core of the cluster. We find that the lens model is best represented by two cluster-scale halos, with contributions from cluster-member galaxies. The mass enclosed in the innermost 100 kpc is M⊙, in agreement with previous estimates. The lens model predicts the formation of a faint image close to the center of the cluster. At this position, we detect bright emission knots, most prominent in the bluer HST filters. Based on the lens model presented here, we rule out the possibility that this emission is coming from a counter image of one of the giant arcs, and support the interpretation of Tremblay et al. (2014) that this emission is due to star formation at the core of SDSS J1531+3414.
References
- Bayliss (2012) Bayliss, M. B. 2012, ApJ, 744, 156
- Bayliss et al. (2014) Bayliss, M. B., Johnson, T., Gladders, M. D., Sharon, K., & Oguri, M. 2014, ApJ, 783, 41
- Bayliss et al. (2013) Bayliss, M. B., Rigby, J. R., Sharon, K., et al. 2013, arXiv:1310.6695
- Bayliss et al. (2011) Bayliss, M. B., Gladders, M. D., Oguri, M., et al. 2011, ApJ, 727, L26
- Bayliss et al. (2011) Bayliss, M. B., Hennawi, J. F., Gladders, M. D., et al. 2011, ApJS, 193, 8
- Bayliss et al. (2010) Bayliss, M. B., Wuyts, E., Sharon, K., et al. 2010, ApJ, 720, 1559
- Blanchard et al. (2013) Blanchard, P. K., Bayliss, M. B., McDonald, M., et al. 2013, ApJ, 772, 24
- Dahle et al. (2013) Dahle, H., Gladders, M. D., Sharon, K., et al. 2013, ApJ, 773, 146
- Elíasdóttir et al. (2007) Elíasdóttir, Á., Limousin, M., Richard, J., et al. 2007, arXiv:0710.5636
- Gladders & Yee (2000) Gladders, M. D., & Yee, H. K. C. 2000, AJ, 120, 2148
- Gladders et al. (2013) Gladders, M. D., Rigby, J. R., Sharon, K., et al. 2013, ApJ, 764, 177
- Gralla et al. (2011) Gralla, M. B., Sharon, K., Gladders, M. D., et al. 2011, ApJ, 737, 74
- Gonzaga & et al. (2012) Gonzaga, S., & et al. 2012, The DrizzlePac Handbook, HST Data Handbook,
- Hennawi et al. (2008) Hennawi, J. F., Gladders, M. D., Oguri, M., et al. 2008, AJ, 135, 664
- Hook et al. (2004) Hook, I. M., Jørgensen, I., Allington-Smith, J. R., et al. 2004, PASP, 116, 425
- Koester et al. (2010) Koester, B. P., Gladders, M. D., Hennawi, J. F., et al. 2010, ApJ, 723, L73
- Marrone et al. (2012) Marrone, D. P., Smith, G. P., Okabe, N., et al. 2012, ApJ, 754, 119
- Oguri et al. (2012) Oguri, M., Bayliss, M. B., Dahle, H., et al. 2012, MNRAS, 420, 3213
- Oguri et al. (2009) Oguri, M., Hennawi, J. F., Gladders, M. D., et al. 2009, ApJ, 699, 1038
- Rajan et al. (2010) Rajan, A. et al. 2010, “WFC3 Data Handbook”, Version 2.1, (Baltimore: STScI).
- Rigby et al. (2014) Rigby, J. R., Bayliss, M. B., Gladders, M. D., et al. 2014, ApJ, in press; arXiv:1406.3356
- Sharon et al. (2012) Sharon, K., Gladders, M. D., Rigby, J. R., et al. 2012, ApJ, 746, 161
- Tremblay et al. (2014) Tremblay, G. R., et al. 2014 ApJ, in press; arXiv:1407.2251
- Wuyts et al. (2012) Wuyts, E., Rigby, J. R., Sharon, K., & Gladders, M. D. 2012b, ApJ, 755, 73
- Wuyts et al. (2012) Wuyts, E., Rigby, J. R., Gladders, M. D., et al. 2012a, ApJ, 745, 86
- Wuyts et al. (2014) Wuyts, E., Rigby, J. R., Gladders, M. D., & Sharon, K. 2014, ApJ, 781, 61
- York et al. (2000) York, D. G., Adelman, J., Anderson, J. E., Jr., et al. 2000, AJ, 120, 1579