Electronic inhomogeneities in the superconducting phase of CaFe1.96Ni0.04As2 single crystals
Abstract
Superconductivity in CaFe2-xNixAs2 emerges in close proximity to an antiferromagnetic (AFM) ordered parent state and the AFM phase overlaps with superconducting (SC) phase for a small range of x-values. We present scanning tunneling microscopy and spectroscopy study of an underdoped CaFe2-xNixAs2 single crystal in the vicinity of the boundary of the two phases. Both resistivity and magnetic susceptibility measurements show a superconducting TC of 15 K and from later we deduce a superconducting fraction of 1.2 . Topographic images show reasonably flat surface with signatures of atomic resolution. Spectra between 120 K and 20 K are spatially homogeneous and show signatures of spin density wave (SDW) gap. Below , spectra show significant spatial inhomogeneity with a depression in density of states in 5 meV energy range. Inhomogeneity reduces significantly as the temperature goes above and disappears completely far above . These observations are discussed in terms of an inhomogeneous electronic phase that may exist due to the vicinity of this composition to the SC dome boundary on the underdoped side of the phase diagram.
I Introduction
The superconductivity in Iron-Arsenic (Fe-As) based pnictides kamihara emerges in close proximity to an AFM ordered parent state and has dome-shaped dependence on doping or pressure luetkens ; zhao ; peng ; goko ; park ; erwin ; chen ; marsik ; bernhard ; drew ; sana ; laplace . In some pnictides, the AFM and SC phases overlap in the phase diagram and then the maximum is found close to the extrapolated end point of the AFM transition. It is widely believed that magnetic fluctuations have an important role in the origin of high- superconductivity. Quantum fluctuations associated with the quantum critical point (QCP)zhou ; shibauchi may also have a crucial role in superconductivity. Muon spin relaxation (SR) and Mssbauer spectroscopy on LaFeAsO1-xFx show a discontinuous first-order-like transition from SDW to SC state without any coexistence of SDW and SC phases luetkens . Neutron scattering in CeFeAsO1-xFx reveals a continuous second order transition, but the SDW and SC phases touch only at T = 0 and this could be a quantum critical point zhao . On the contrary, in other cases such as scanning tunneling microscopy and spectroscopy on NaFe1-xCoxAs peng , SR goko ; park ; erwin and neutron diffraction chen study on Ba1-xKxFe2As2, SR study on Ba(Fe1-xCox)2As2 marsik ; bernhard and on SmFeAsO1-xFx drew , SR and nuclear quadropole resonance study on SmFe1-xRuxAsO0.85F0.15 sana and 75As NMR study on Ba(Fe1-xRux)2As2 laplace show coexistence of the two phases. These two phases may coexist microscopically or in a phase separated way. SmFe1-xRuxAsO0.85F0.15 sana and Ba(Fe1-xRux)2As2 laplace display phase separation while NaFe1-xCoxAs peng , Ba(Fe1-xCox)2As2 marsik ; bernhard show microscopic coexistence. In some pnictides for example Ba1-xKxFe2As2 and SmFeAsO1-xFx, the issue of whether the two phases, AFM and SC, coexist microscopically or as phase separated, is not completely clear goko ; park ; chen ; erwin ; drew . With its atomic scale structural and spectroscopic imaging capabilities, scanning tunneling microscopy and spectroscopy (STM/S) is an ideal probe to investigate the local electronic properties of these systems. In our variable temperature STM/S we investigate the temperature evolution of the electronic density of states (DOS) to see how they correlate with various phases at different temperatures.
The parent compound CaFe2As2 undergoes a spin density wave (SDW) transition near TSDW = 170 K nandi ; ronning . Around TSDW a structural transition is also observed, where the symmetry changes from tetragonal (I4/mmm) to orthorhombic (Fmmm)nandi ; ronning . Electron doping by partially replacing Fe by Ni suppresses the SDW and the structural transitions, leading to superconductivity in CaFe2As2 neeraj . With increase of Ni concentration, TSDW starts to decrease. Furthermore a drop in resistivity occurs at 15 K for x = 0.027 which at higher doping develops into a pure superconducting transition neeraj . SDW phase vanishes completely at x = 0.06 neeraj .
In this paper, we report temperature dependent STM/S studies of underdoped CaFe1.96Ni0.04As2 single crystals in 5.4 K - 292 K temperature range. We observed flat terraces with some signatures of atomic resolution. Spectra show homogeneous tunneling DOS with SDW gap at high temperature and below TC we see inhomogeneous local tunneling DOS with two kinds of spectra, either showing only SDW gap or a suppression in DOS in 5 mV bias range. Although these spectra below TC are unlike those of typical SC, but the low energy DOS suppression is observed only below TC. A preliminary version of this work was also reported by us in a conference anirban1 .
II Experimental details
Single crystals of CaFe1.96Ni0.04As2 were grown neeraj by the high temperature solution growth using Sn-flux under identical conditions as mentioned in Ref. neeraj2 . Electrical resistivity was measured using a standard four-probe method in a closed cycle refrigerator. DC magnetization was measured in a superconducting quantum interference device magnetometer. STM/S studies were done in cryogenic vacuum using a homemade variable temperature STM with fresh-cut Pt0.8Ir0.2 tips with RHK electronics and software. For STM/S measurements crystals were cleaved in situ at room temperature and at 4 10-6 mbar pressure before transferring the sample to the STM head at low temperature. Standard ac-modulation technique was used for STS measurements with a modulation amplitude between 1 and 10 mV and frequency 2731 Hz. For small bias (20 mV) we plot dI/dV directly to show the DOS, while we normalize the spectra for large bias (250 mV) to normalize away the effect of the tunnel matrix element on the spectra anirban . This process also sharpens the spectral features. We have seen similar results on 4-5 different samples of the same composition with more than one tip.
III Results and Analysis
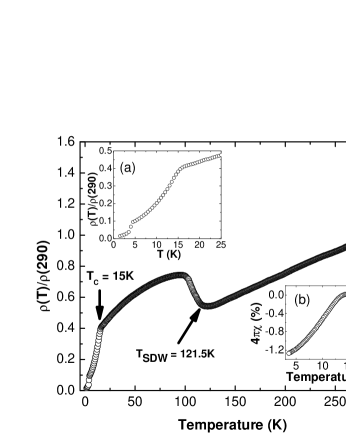
Fig. 1 shows the in-plane electrical resistivity of as-grown CaFe1.96Ni0.04As2 single crystal. The in-plane resistivity decreases slowly with decreasing temperature below room temperature down to 121.5 K. Then there is a relatively broad upturn starting at due to SDW transition. This rise in resistivity is attributed to the opening of a gap in parts of the Fermi surface giving rise to a loss in DOS at upon entering the SDW state. However, resistivity starts decreasing rapidly as the temperature is reduced further indicating that the Fermi surface is only partially gapped in the SDW state. As the temperature decreases further, a sharp drop in the resistivity occurs at 15 K due to the onset of superconducting order. But the resistivity does not go to zero down to 1.3 K. Full superconducting transition develops only at slightly higher Ni doping (0.053 and 0.06)neeraj with an onset of 15 K. The drop in the resistivity at 4 K is due to the presence of traces of Sn, which is used as a flux. The inset (b) of Fig. 1 shows the temperature dependence of magnetic susceptibility measured under zero field cool (ZFC) condition at 50 Oe. Field was applied parallel to the ab-plane of the crystals. The susceptibility remains unchanged (nearly zero) with decreasing temperature down to 15 K. starts decreasing for temperature below 15 K and becomes negative, but 4 does not saturate down to 4 K. This indicates that the system is not fully shielded. Assuming demagnetization factor to be zero for -plane, measured shielding fraction is only 1.2 at 5 K. Thus only a small portion of the system is superconducting at 4 K.
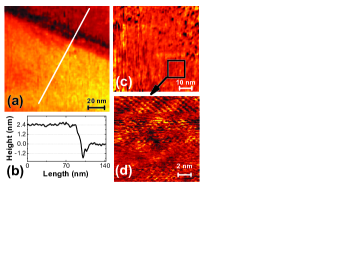
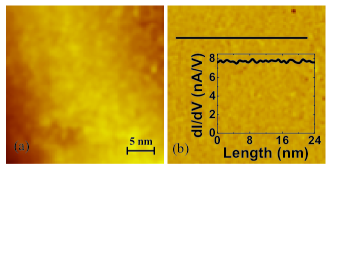
Fig. 2 show STM topographic images of in situ cleaved CaFe1.96Ni0.04As2 single crystal at highest and lowest studied temperatures. Topographic image at 292 K (Fig. 2 (a)) show atomically flat surface over the terraces, with an rms roughness over any terrace as 0.11 nm. Similar kind of topographic images are observed at all studied temperatures. The line profile in Fig. 2 (b) shows that the terraces are separated by 2.4 (0.1) nm, i.e. twice the atomic steps neeraj . Topographic images at the lowest studied temperature (5.4 K) are shown in Fig. 2 (c) and (d), which also show signatures of atomic resolution. Simultaneously acquired STM topographic and conductance images (area: 29.0329.03 nm2) at 110 K are shown in Fig. 3. dI/dV along the marked line, in the conductance map as plotted in the inset, shows very little variation indicating an electronically homogeneous surface.


The temperature dependent tunneling spectra, dI/dV versus V between 78 K and 292 K are shown in Fig. 4 (a). Each plotted spectrum is a spatial average of about one hundred spectra taken over an area of 22 m2, as they show very little variations (See Fig. 5 (a)). d(lnI)/d(lnV) - V is plotted in Fig. 4 (b) which eliminates the effect of the voltage dependence of the tunneling matrix element and sharpens the gap feature anirban . Above (121.5 K), there is a broad depression in the d(ln I)/d(ln V)-V spectra which becomes more pronounced as the temperature goes below . We attribute this to the opening of a partial gap at the upon entering the SDW state. Similar kind of spectra were seen in EuFe2As2 anirban . Local spectra at 78 K and 5.4 K, taken with same junction resistance and ac modulation are plotted in Fig. 5. We see significant spatial inhomogeneity at 5.4 K as compared to to that at 78 K.
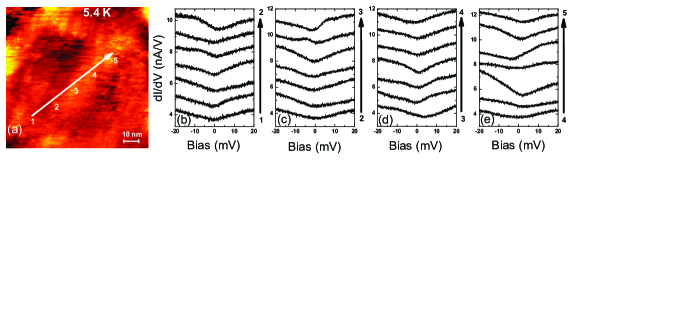
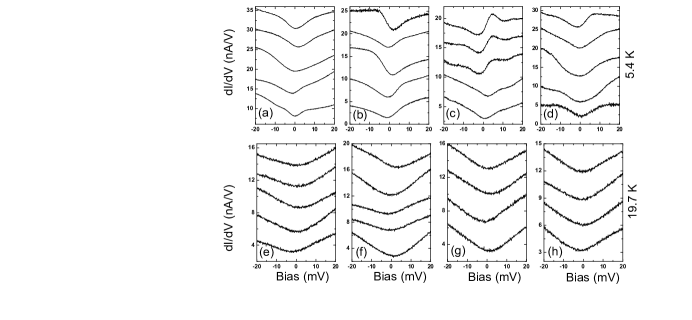
Spatially resolved dI/dV spectra along a line of a topographic image taken at 5.4 K are shown in Fig. 6. Each spectrum at a particular location is an average of 16 spectra and the distance between two consecutive locations is 2.4 nm. We clearly see that the nature of the spectra changes over nm length scale. To see the temperature evolution of these low energy features across the TC = 15 K, we took dI/dV - V spectra at different temperatures between 5.4 K and 20 K at different locations on the surface over an area of 22 m2. The spectra at 5.4 K and 19.7 K are shown in Fig. 7. We have grouped these spectra based on the symmetry of the features observed. None of the spectra show true superconducting gap with two coherence peaks but there is an asymmetric suppression in DOS in mV bias range in some of the spectra. In some spectra, only one peak is observed near mV in the dI/dV spectra. In some cases a sharp decrease in DOS occurs at negative bias without any peak. Few spectra show a symmetric depression over mV bias. In some locations the spectra show a rising DOS with a minima near zero bias but without any low energy features, i.e. these spectra are similar to the ones above 20 K.
Based on the observed spectra at low temperature, we divided them into three categories: spectra with a sharp change in dI/dV at -ve bias, spectra with a peak at +ve bias, and spectra with no sharp change. We took the spatial average of the spectra showing peak at +ve bias and of those showing sharp change in DOS at -ve bias. We plot the temperature dependence of these two types of spatially averaged spectra in Fig. 8 and , which demonstrate the evolution of the DOS across TC. Below TC, there is some depression in the DOS near the Fermi energy (at zero bias) and this depression becomes more pronounced as the temperature goes down. We would like to state that we cannot track the same area as a function of temperature in our STM as the relative xy-shift between tip and sample with temperature is significant.

Our observed tunnel spectra at low temperatures are unlike those of typical superconductors, which show a BCS gap with two coherence peaks in DOS. However, the observed asymmetric or symmetric depression in DOS correlates well with the bulk superconductivity below TC. Above TC, there is no peak or depression in the low bias conductance but as the temperature reduces below the superconducting transition temperature, peak or depression in the tunnel spectra starts to appear. The depression in DOS at low energies is most pronounced at the lowest studied temperature. The temperature variation of the tunnel spectra across TC clearly indicates that this peak disappears above superconducting transition. If we take a spatial average of these spectra we do get a gap-like structure with symmetric depression in DOS and weak peak-like features corresponding to BCS coherence peaks. Asymmetric spectra with gap have been seen routinely in high-TC cuprates pan with an energy gap and two coherence peaks. So the spectra that we observed are somewhat peculiar but the low energy asymmetric features are seen only below TC.
IV Discussions
Emergence of inhomogeneous DOS only below the SC onset temperature is somewhat puzzling. It is possible that some small inhomogeneities do exist above TC and they evolve into more clearly visible features below TC. These features mainly involve an asymmetric depression in DOS near Fermi energy in 5 meV energy range. This energy scale is consistent with the typical superconducting gap reported in some of the pnictides peng ; jennifer . Susceptibility data also show that a tiny fraction (1.2) of the system is in the SC state below TC.
At low temperature tunnel spectra change significantly over a few nm length scale as seen in Fig. 6. A very homogeneous Ni distribution at this doping (0.04) will give 1.4 nm average separation between Ni atoms in a-b plane. So we cannot reconcile our results with clustering of Ni atoms as that would lead to an inhomogeneity over a larger length scale. We have also seen the same inhomogeneous spectra in 4-5 different cleaved surfaces of these crystals, which makes it very unlikely that Ni is segregating over length scales larger than what is accessible to our STM. This is further ruled out from smooth susceptibility data without any sharp jumps. Signatures of atomic resolution and atomic steps with flat terraces make the surface contamination a very unlikely possibility.
It is possible that the cleaved surface differs from the bulk due to reconstruction, restructuring or other disorders jennifer . The nature of exposed surface after cleaving may depend on the cleaving temperature and a room temperature cleaving is more likely to yield a reconstructed surface. Moreover, a STM study ilija on PrxCa1-xFe2As2 showed three different surface morphologies, 21, 11 and a disordered web-like structure. Among these structures, 21 gives a non-polar surface while 11 gives a polar surface. In our atomic resolution images we saw only 11 structure at some places indicating a polar surface. Due to lack of atomic resolution over large area we cannot find the surface termination at various temperatures and locations to correlate with the local spectra. Massee et. al. massee , on room temperature cleaved BaFe1.86Co0.14As2, showed that termination has little effect on the low-energy DOS. A hard X-ray photoemission also supports this finding jong . Thus we find it difficult to attribute the observed inhomogeneity over a few nm length-scale, in low-energy DOS and only below TC, to the spatial variation in surface termination or reconstruction.
Inhomogeneities in tunnel conductance can also arise from quasi-particle interference (QPI) as reported in a STM study on doped CaFe2As2 chuang . In cuprates, spatially periodic DOS modulations have been seen over the SC gap energy scale due to QPI jennifer1 . More pronounced variations in local spectra of cuprates have been associated with oxygen inhomogeneities mcelroy . In our spectra we see much wider spatial variations (see Fig. 6 and 7 ) than what is typically seen in QPI. We cannot rule out the QPI related inhomogeneities in present study, however we find it difficult to completely attribute these inhomogeneities to QPI.
In a typical pnictide phase diagram similar to cuprate superconductors, there is the famous superconducting dome and a phase boundary extending to much higher temperatures that separates the SDW phase from the paramagnetic phase. Thus the phase boundaries touch the T = 0 axis at three points and it is not fully clear if all the three points are QCPs. The temperature dependent resistivity, penetration depth and spin-lattice relaxation measurements have strongly suggested that the point inside the dome is a QCP in pnictides zhou ; shibauchi . In cuprates, field doping near the first point (on underdoped side) has also revealed a QCP due to crossover between SC phase and an insulator phase bollinger . Larger inhomogeneities have been observed in underdoped cuprates than the overdoped ones gomes . Superconductor to insulator transition has also been reported in heavily disordered conventional superconductors although it is not clear if this disorder also acts as a dopant and directly affects the SC order goldman .
The composition of our crystals is close to the superconducting dome boundary on the underdoped side. Proximity to this boundary makes the non-SC phases easily accessible and presence of disorder will further help in nucleating such phases. We believe that in proximity to this crossover point, which may be a QCP, the system will be extremely susceptible to disorder and eventually the disorder might influence this crossover more than doping. Our results could be suggestive of the presence of a QCP at a point where the phase boundary touches the temperature axis in the underdoped side of pnictides.
V Conclusions
In conclusion, our temperature dependent STM/S investigation of underdoped CaFe1.96Ni0.04As2 single crystals show a highly inhomogeneous electronic phase below the SC transition temperature. At high temperatures we see a SDW gap consistent with the resistivity measurements. Magnetic measurement show that only a tiny fraction ( 1.2 ) of this compound superconducts below 15 K. Our STM measurements show atomically flat terraces with signatures of atomic resolutions at lowest temperature. Above TC, the tunnel spectra show homogeneous local DOS with a SDW gap. But, below TC, low energy scale spectra at some locations show an asymmetric or a symmetric dip in DOS at meV energy, while, at other locations the spectra are similar to the ones at higher temperatures with SDW gap. This asymmetric or symmetric depression correlates well with the superconducting phase and the inhomogeneity disappears as the temperature goes above the superconducting transition temperature. Observed inhomogeneity over such a few nm length-scale and smooth susceptibility data also exclude the possibility of segregation of Ni. From this STM/S study we believe that the inhomogeneities in this underdoped compound below TC are intrinsic due to the proximity to the non-SC phase.
Acknowledgements
We thank Sourabh Barua for his help in the resistivity measurement. We also like to acknowledge Amit Dutta for helpful discussions. Anirban acknowledges financial support from the CSIR of the Government of India. A.K.G. acknowledges a research grant from the CSIR of the Government of India.
References
- (1) :
- (2) Y. Kamihara, T. Watanabe, M. Hirano, and H. Hosono, J. Am. Chem. Soc. 130 (2008) 3296.
- (3) H. Luetkens et al., Nature Mater. 8 (2009) 305 .
- (4) J. Zhao et al., Nature Mater. 7 (2008) 953.
- (5) P. Cai et al., Nat. Commun. 4 (2013) 1596.
- (6) T. Goko et al., Phys. Rev. B 80 (2009) 024508.
- (7) J. T. Park et al., Phys. Rev. Lett. 102 (2009) 117006.
- (8) E. Wiesenmayer, H. Luetkens, G. Pascua, R. Khasanov, A. Amato, H. Potts, B. Banusch, H. H. Klauss, and D. Johrendt, Phys. Rev. Lett. 107 (2011) 237001.
- (9) H. Chen et al., Europhys. Lett. 85 (2009) 17006.
- (10) P. Marsik et al., Phys. Rev. Lett. 105 (2010) 057001.
- (11) C. Bernhard et al., Phys. Rev. B 86 (2012) 184509.
- (12) A. J. Drew et al., Nature Mater. 8 (2009) 310.
- (13) S. Sanna, P. Carretta, P. Bonf, G. Prando, G. Allodi, R. De Renzi, T. Shiroka, G. Lamura, A. Mrtinelli, and M. Putti, Phys. Rev. Lett. 107 (2011) 227003.
- (14) Y. Laplace, J. Bobroff, V. Brouet, G. Collin, F. Rullier-Albenque, D. Colson, and A. Forget, Phys. Rev. B 86 (2012) 020510(R).
- (15) R. Zhou, Z. Li, J. Yang, D. L. Sun, C. T. Lin and Guo-qing Zheng, Nat. Commun. 4 (2013) 2265.
- (16) T. Shibauchi, A. Carrington and Y. Matsuda, Annu. Rev. Condens. Matter Phys. 5 (2014) 113.
- (17) M. H. Julien, H. Mayaffre, M. Horvati, C. Berthier, X. D. Zhang, W. Wu, G. F. Chen, N. L. Wang, and J. L. Luo, Euro. Phys. Lett. 87 (2009) 37001.
- (18) N. Ni, S. Nandi, A. Kreyssig, A. I. Goldman, E. D. Mun, S. L. Bud’ko, and P. C. Canfield, Phys. Rev. B 78 (2008) 014523.
- (19) F Ronning, T Klimczuk, E D Bauer, H Volz and J D Thompson, J. Phys.: Condens. Matter 20 (2008) 322201.
- (20) N. Kumar, Songxue Chi, Ying Chen, Kumari Gaurav Rana, A. K. Nigam, A. Thamizhavel, William Ratcliff, II, S. K. Dhar, and Jeffrey W. Lynn, Phys. Rev. B 80 (2009) 144524.
- (21) A. Dutta, A. Thamizhavel, and A. K. Gupta, AIP Conference Proceedings 1591 (2014) 1657.
- (22) N. Kumar, R. Nagalakshmi, R. Kulkarni, P. L. Paulose, A. K. Nigam, S. K. Dhar, and A. Thamizhavel, Phys. Rev. B 79 (2009) 012504.
- (23) A. Dutta, Anupam, Z. Hossain and A. K. Gupta, J. Phys.: Condens. Matter 25 (2013) 375602.
- (24) S. H. Pan et. al., Nature 413 (2001) 282.
- (25) Jennifer E Hoffman, Rep. Prog. Phys. 74, (2011) 124513.
- (26) Ilija Zeljkovic, Dennis Huang, Can-Li Song, Bing Lv, Ching-Wu Chu, and Jennifer E. Hoffman, Phys. Rev. B 87 (2013) 201108(R).
- (27) F. Massee, Y. Huang, R. Huisman, S. de Jong, J. B. Goedkoop, and M. S. Golden, Phys. Rev. B 79 (2009) 220517(R).
- (28) S. de Jong, Y. Huang, R. Huisman, F. Massee, S. Thirupathaiah, M. Gorgoi, F. Schaefers, R. Follath, J. B. Goedkoop, and M. S. Golden, Phys. Rev. B 79 (2009) 115125.
- (29) T.-M. Chuang, M. P. Allan, Jinho Lee, Yang Xie, Ni Ni, S. L. Bud ko, G. S. Boebinger, P. C. Canfield, and J. C. Davis, Science 327, (2010) 181.
- (30) J. E. Hoffman, K. McElroy, D.-H. Lee, K. M. Lang, H. Eisaki, S. Uchida, and J. C. Davis, Science 297 (2002) 1148.
- (31) K. McElroy, Jinho Lee, J. A. Slezak, D.-H. Lee, H. Eisaki, S. Uchida, J. C. Davis, Science 309 (2005) 1048.
- (32) A. T. Bollinger, G. Dubuis, J. Yoon, D. Pavuna, J. Misewich, and I. Boovi, Nature 472 (2011) 458.
- (33) K. K. Gomes, A. N. Pasupathy, A. Pushp, S. Ono, Y. Ando, and A. Yazdani Nature 447 (2007) 569.
- (34) A. M. Goldman, and N. Markovic, Phys. Today 51 (1998) 39.