Interevent time distributions of human multi-level activity in a virtual world
Abstract
Studying human behaviour in virtual environments provides extraordinary opportunities for a quantitative analysis of social phenomena with levels of accuracy that approach those of the natural sciences. In this paper we use records of player activities in the massive multiplayer online game Pardus over 1,238 consecutive days, and analyze dynamical features of sequences of actions of players. We build on previous work were temporal structures of human actions of the same type were quantified, and extend provide an empirical understanding of human actions of different types. This study of multi-level human activity can be seen as a dynamic counterpart of static multiplex network analysis. We show that the interevent time distributions of actions in the Pardus universe follow highly non-trivial distribution functions, from which we extract action-type specific characteristic “decay constants”. We discuss characteristic features of interevent time distributions, including periodic patterns on different time scales, bursty dynamics, and various functional forms on different time scales. We comment on gender differences of players in emotional actions, and find that while male and female act similarly when performing some positive actions, females are slightly faster for negative actions. We also observe effects on the age of players: more experienced players are generally faster in making decisions about engaging and terminating in enmity and friendship, respectively.
keywords:
quantitative sociology , human action dynamics , time series analysis , online gamesPACS:
89.75.Da , 02.50.Le , 89.65.Ef, , , ,
1 Introduction
The life of humans can be viewed as a sequence of different actions that are carried out from birth to death. Some of these actions are carried out with high regularity on various timescales (circadian, yearly, etc.), others have significant stochastic components. By now it is well established that distribution functions characterising sequences of human actions over time are highly non-trivial [1, 2, 3, 4, 5, 6, 7, 8, 9, 10, 11, 12], and their origins remain largely unclear.
The very fact that distributions of human actions over time, such as distributions of phone calls, follow statistical laws was known since the beginning of the last century [13], and triggered the origin of queueing theory [14]. Early attempts to understand human action sequences were based on the assumption that actions are carried out homogeneously in time with constant rates, which then lead to Poisson processes [15]. This lead to the conclusion that times between consecutive actions of the same individual should be distributed exponentially. Models to describe human dynamics that are based on Poisson processes are still widely used [16, 17]. However, the careful analysis of various patterns of human activity provides growing evidence for highly inhomogeneous bursty distributions of human actions in time. Further there is evidence for non-trivial inter-dependencies of actions that influence their (usually power-law dominated) temporal statistics [1, 2, 3, 4, 5, 6, 7, 8, 9, 10, 11, 12]. The latter were found both for traditional human actions such as writing letters [3, 7], checking out books in libraries, performing financial transactions [4], or writing e-mails [1, 2, 6], web browsing [4], sending text messages [9], editing Wikipedia pages [10, 12], and many more. Different reasons have been suggested to explain their appearance. In particular, the priority queueing model [2] is a possibility to explain the bursty mechanism of human behavior by a decision-based queueing process where individuals perform tasks according to some priority. This may explain the observed correspondence patterns of Darwin and Einstein [3]. Alternatively it has been hypothesized that human correspondence is driven not by responses to others but by the variation in an individual’s communication needs over the course of their lifetime [7].
The common feature of the above mentioned observations is that they are based on the analysis of human actions of a single type: either writing e-mails, or letters, or making phone calls, etc. The next step beyond these studies is to consider the much more involved situation where tasks of different types are performed. What is the action dynamics of an individual (or of a group of individuals) that writes both e-mails, and letters, and makes phone calls? Carrying out actions of different types we call multi-level human activity. The analysis of multilevel activity encounters obvious difficulties, typically requiring serious efforts on data collection [18]. In this study we circumvent this problem by studying the log-files of all actions performed in a virtual world, where actions of different types are performed by thousands of people [19, 20]. The virtual universe of the online game Pardus [21] is briefly outlined below.
Pardus is a massive multiplayer online game (MMOG) which is online since 2004. It is an open-ended game with a worldwide player base of more than 400,000 registered players [21, 22]. The game has a science fiction setting and features three different universes. All universes have a fixed start date but no scheduled end date. Every player controls one avatar, called the player’s character. The characters act within a virtual world making up their own goals and interacting with the self-organized social environment. There is a variety of different activities the characters can participate in, including communication, trade, attack, and other forms of social actions such as establishing or breaking friendships or enmities, see Fig. 1. Since it has been launched, the Pardus game served as a unique testing ground to measure different observables that characterize inhabitants of the virtual world and in this way to learn about complex social processes taking place in the real world – “When the same six soldiers take out a dragon in a synthetic world, the dragon is not real but the teamwork is” [23]. Indeed, with a complete record of complete information about millions of actions of different kinds performed by thousands of people during several years from a single source, this setting provides the unique position to achieve a detailed non-intrusive quantitative analysis of complex social behavior [22, 24, 25, 26, 27, 28, 29, 30, 31, 32]. In particular, the complex network structure of the Pardus society has been exposed and evidence was collected for several social-dynamics hypothesis, including the Granovetter weak ties hypothesis and triadic closure [28]. In this way further evidence has been provided about validity of a model of online communities for human societies, allowing to operate with a precision resembling that of natural sciences [22]. Further analysis of the Pardus society has revealed the network topology of social interactions [24, 28], mobility of characters [25], behavioral action sequences [26], gender differences in networking [27], and the functioning of the virtual economy [30].
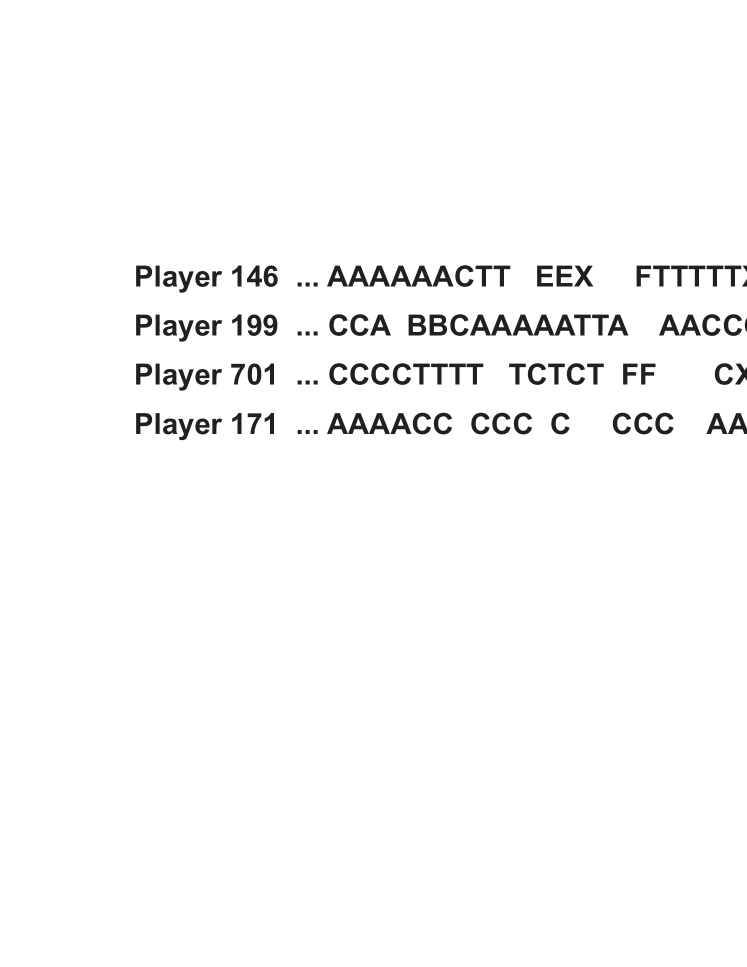
The main idea of this paper is to analyze the evolution of actions within the Pardus universe over time: what are the temporal characteristics of actions taken by players? Is there an action-specific dynamics, and are there some global processes that dominate the dynamics of players in the online world? It is well established by now that a number of features of the virtual society resemble those in the offline society, giving hope to expect that the analysis of the virtual world action dynamics will provide insights into human dynamics that is valid also for real societies. Social systems can be quantified comprehensively by studying the superposition of its constituting socio-economic networks (multiplex networks, see [33, 34, 35]) [24]. The same information is contained in the dynamical behavioural sequences (Fig. 1) of the individuals, however with a focus on temporal aspects of the multi-level activity.
The paper is organized as follows. In Section 2 we describe the database and concentrate on the main observable of interest, the interevent time and its statistics. We comment on the bursty dynamics of individual characters. Action-specific dynamics is studied in Section 3. There we analyze inherent features of actions of different types and compare actions performed by different types of players such as male and female. The dynamics of the entire community of players in the Pardus game is analyzed in Section 4. In particular, we discuss an increase of activity during periods of war in the game. Conclusions and outlook are presented in Section 5.
2 Data set and general statistics of interevent times
The Pardus world consists of three different game universes: Orion, Artemis, and Pegasus. In this study we concentrate on the Artemis universe because in this Universe complete data is available for all actions of all players [22]. The Artemis universe is also the most densely populated universe over time, inhabited by more than 7,000 active characters (see Table 1 for more details). Artemis was opened on June 10, 2007. Our analysis is based on the information about player activities during 1,238 consecutive days since the universe was opened. Every character in the game is a pilot who owns a spacecraft, travels in the universe and is able to perform a number of activities of different type. There is no specified goal in the game, the players make up their own goals and interact with their self-organized social environment. Every player picks a male or female avatar, the age of the player is measured as a the number of days since the first registration. We concentrate on the following actions that can be acted out within the game
-
•
sending private messages from one player to another (communication, C);
-
•
attacking other players or their belongings (attack, A);
-
•
trading or giving gifts (trade, T);
-
•
marking friends by adding their names to a friend list (F);
-
•
marking enemies by adding their names to an enemy list (E);
-
•
removing friends from the friend list (D);
-
•
removing enemies from the enemy list (X).
More information is found in [22]. It is important to note that actions performed by a character (such as trade, travel, adding/removing friends) cost a certain amount of so-called action points (APs). The number of APs available per character at once cannot exceed 6,100. For each character which owns less APs than their maximum, every 6 minutes 24 APs are automatically generated. Once a character is out of APs, they have to wait for new APs to be regenerated. Social interactions, e.g. sending private messages, planning, coordination, etc., do not cost APs. This feature adds one additional difference between the action types and causes peculiarities in the behavior of characters, as we will see below.
The above actions can be labeled as “positive” or “negative” depending on their nature: A, E and D are considered as negative, while C, T, F, X are considered positive [22, 26]. In some cases this classification may be questioned. For example, thorough categorization of the private messages would have to take into account their content. However, we will classify C as a positive action because only a negligible part of communication in Pardus takes place between enemies [22]. Since private messages are the most frequently performed actions (), the number of positive actions is much larger than the number of negative ones.
Action type All 7,818 8,373,209 8,365,391 63,882,774 0 Positive 7,806 7,492,460 7,484,648 63,882,774 0 Negative 6,918 880,749 873,831 91,715,678 0 A 5,412 742,798 737,386 100,686,258 0 T 6,883 561,327 554,444 86,705,400 0 C 7,799 6,775,950 6,768,151 72,931,246 0 E 5,638 105,958 100,320 100,232,580 2 F 7,067 125,984 118,917 100,736,362 1 X 3,653 29,199 25,546 87,400,240 1 D 3,188 31,993 28,805 95,379,313 1
Two observables are widely used to quantify action streams [2, 3, 4, 6, 7, 9, 12, 36]. These are interevent time, i.e. the time interval between two consecutive actions of the same person, and the waiting time, defined as the time interval between the action (of one person) and reaction (of another person). The last quantity is sometimes understood as the “time to reciprocate”. In the correspondence pattern analysis the reaction on a received letter is another letter that is sent in reply. However, there might also be mixed reciprocity, where the type of reaction differs from an action itself – say, an email sent as a reaction on a phone call received. Because of this, we first simply focus on the interevent time, ignoring the type of action. We denote this by . In Tab. 1 we collect the main features of the data set. The overall number of characters that have performed at least one action in the Artemis universe is , the overall number of actions performed during the observation period of consecutive days is . The majority of actions belong to the positive type (F,C,T,X), due to the fact that C are considered as positive actions. The next in frequency are: A, T, F, E, D, and X. The number of actions is action type specific and ranges from for C, to for X. The number of players that are involved in any specific type of action is distributed rather homogeneously: several thousands of players for each action.
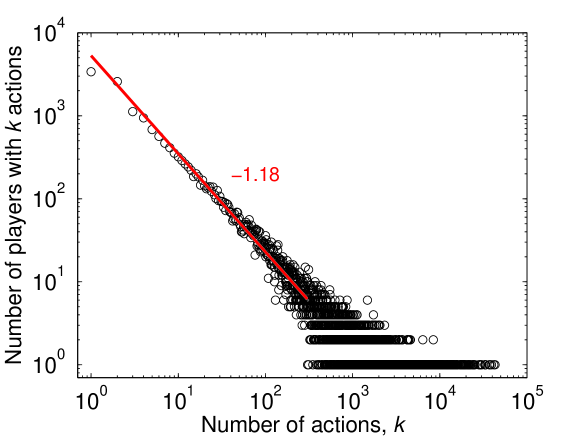
The histogram of the number of actions is shown in Fig. 2. The majority of players performed just a few actions during the entire period, while a few very active players provided huge activity statistics. We find an approximate power law scaling with an exponent of . Players with a small number of actions typically quit the game just after registration. These players are not representative so that we exclude all players that performed less than 50 actions.
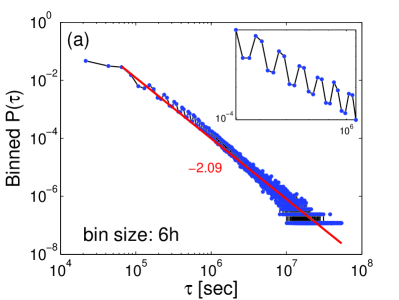
Since all actions are time stamped with an accuracy of one second, we can calculate interevent times, . The distribution of follows a power law as seen in Figs. 3a and 3b. The exponent dependents on the chosen time scale (bin size). The periodic pattern (inset) corresponds to circadian cycles [10, 11, 17].
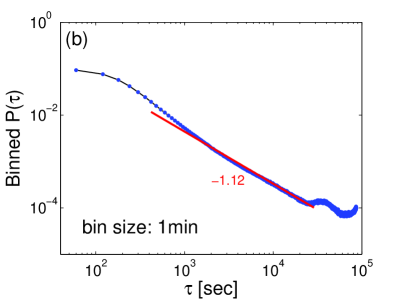
To focus on the dynamics within the first 24 hours (most frequent values for ) we take a bin size of 1 min, Fig. 3b. The local minimum, which appears on this scale for hours sec can be explained by the “active working day”. Since it is more convenient to play in the morning (before work) or in the evening (after work), interevent intervals of 7 hours are less probable than those for 8, 9, or 10 hours. One observes a further regime at small values of , corresponding to immediate or slightly delayed repetition. This can be observed within the first 3 minutes after the performed action. This is due to the peculiarities of different actions. For example, attacks could be naturally grouped into sequences due to repeatedly pressing an attack button to attack the same opponent, while a separate decision is needed to add each new enemy. Further, player synchronization might play a substantial role, where two players can react promptly when they are both online, but only with a (significant) delay if one is offline. It is possible that the shape of the interevent times distribution after these first “immediate” values is influenced by the login behavior of players.
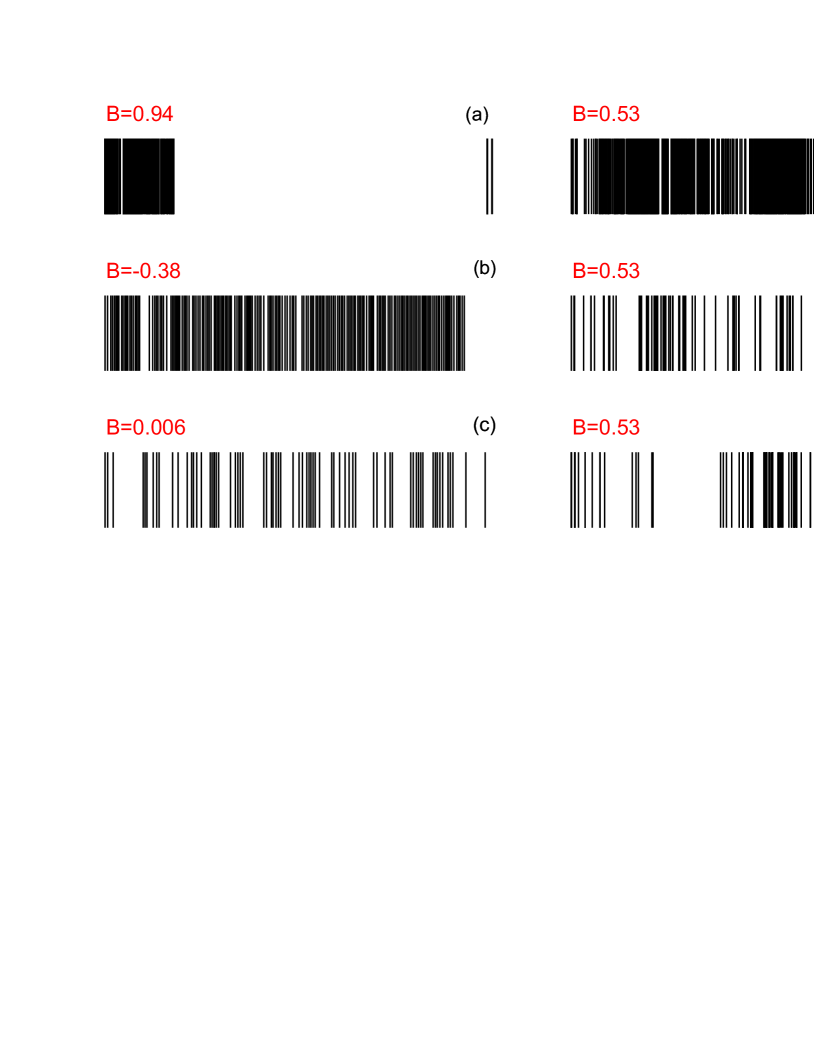
The power-law-like distribution of interevent times between the actions indicates the bursty nature of human dynamics [2, 3, 5]: periods of high activity are separated by long periods of inactivity. Although the origins of such a non-uniform distribution of actions are highly diverse, it is recognized to be an inherent feature of human dynamics. A measure for burstiness was introduced in [8], its simplified version (see [10, 12]) is defined as follows:
| (1) |
where is the average of the interevent time , and its standard deviation. For a regular pattern we have , for a random Poissonian process with a fixed event rate, , and for fat-tailed distributions of time intervals, .
In Fig. 4 we show (compressed) action streams of players with different values of . Each line marks the time of an executed action. The patterns on the left-hand side correspond to the activity with (a) maximal, (b) minimal, and (c) close to zero values of . A random distribution of actions over the time line is characterized by . It is observed that seemingly very different activity patterns can be characterized by similar values of burstiness, Fig. 4d–f.
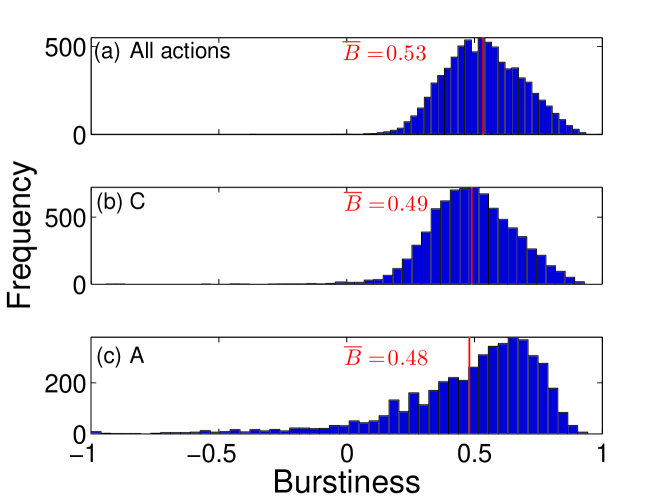
The histogram of for all players is shown in Fig. 5a. The most frequent value (maximum) () as well as the average (mean) () values are both larger than 0.5. The average burstiness values for the process of real-world mobile communication is more than two times smaller, [10], while for Wikipedia editing (events correspond to consequent edits of Wikipedia articles) it is [12]. The maximum of the histogram of , for attacks, Fig. 5b, has larger values than for communication, Fig. 5c. This illustrates the intuitive understanding of the nature of these actions: attacks appear highly clustered within short time intervals, while communication is more uniformly distributed over time.
3 Action-specific dynamics: Decay constants of human actions
In this section, we ask if it is possible to discriminate between actions types given only information about their interevent time distributions. We can show that the “decay” of the interevent time distribution serves as a distinguishing feature of action types. To quantify this decay we introduce “decay constants” and “decay exponents” that are specific for different actions.
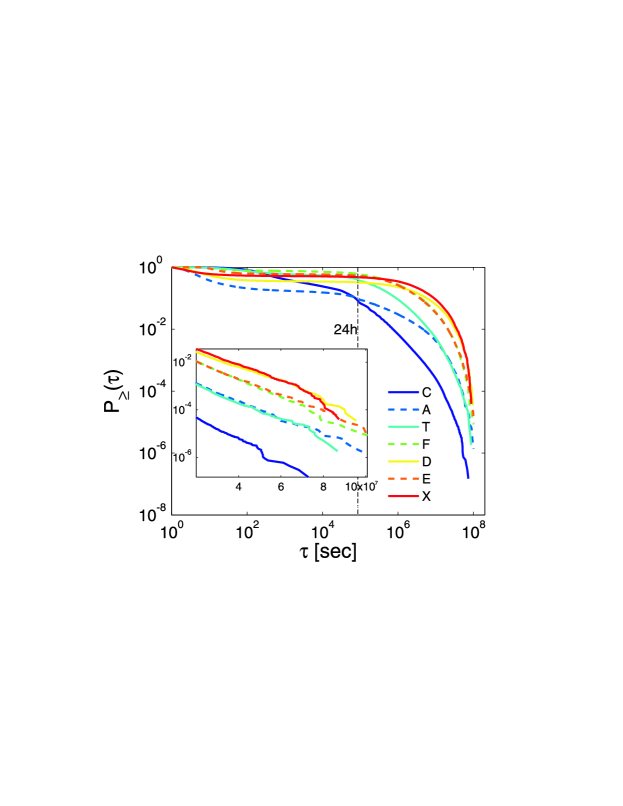
We calculate the inverse cumulative distributions of interevent times for each of the seven action types. They are shown in Fig. 6 for communication (C), attacks (A), trade (T) and for the friendship-enmity marking actions F, D, E, and X. Due to the massive contribution of C actions, the curve for all actions is dominated by the C distribution.
Based on our previous observations (see Section 2), we are particularly interested in the behavior on three different time scales: immediate reaction where does not exceed a couple of minutes; early day, is less than 8 hours; and the late day, is between 8 and 24 hours. Our main observations are
-
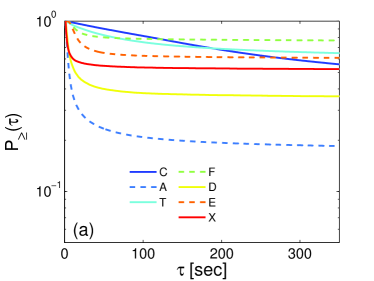
•
Immediate reaction ( sec). is shown in Fig. 7a. All curves have a tendency to decay fast at small values of . The decay is especially pronounced for A, D, F, X, and E actions. This means that short interevent times are typical for most of the actions. Large numbers of attacks or emotional addings-removings are performed one-by-one in a very fast way (grouped into sequences), while the probabilities of values greater than 1 min start to decrease very slowly. The decay for short interevent times for T and C is less steep, whereas its further evolution remains more homogeneous.
- •
-
•
Late day (8 hours 24 hours). in this region is shown in Fig. 7c. We fit here the decay by the exponential function,
(3) Values of are collected in the third column of Tab. 2. The slow exponential decay is described by slightly different action-specific values of . This difference has a tendency to diminish for larger time intervals. The fastest decay is observed for C, with , which is twice as large as for A (), and ten times larger than for the other actions.
-
•
Long times ( sec). An exponential cut-off for large (more than eight months) becomes apparent in , see Fig. 6. The exponential decay has similar numerical values for the different actions providing evidence for a cut off effect.
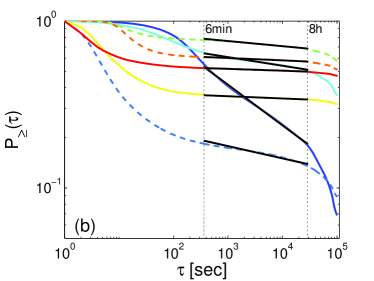
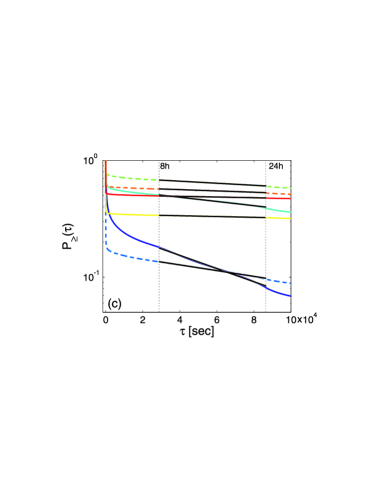
The results indicate that the various types of actions are characterised by distinct decay properies of the interevent time distributions. The values in Eq. (2) and in Eq. (3) may serve as “decay constants” and turn out to be action specific. This is especially pronounced for interevent times in the time intervals “early-day” (6 min 8 hours), and “late-day” (8 hours 24 hours). The “long time” exponential decay can be safely interpreted as a finite size effect of the sample. The average values of interevent times also point on the different speed in performing different kinds of actions. Due to the contribution of some rare but large values of , as well as the periods of natural inactivity (circadian cycles), the values of are large: h for C, h for A, h for T, h for F, h for D, h for E, h for X. is smallest for communication and much larger for any other kind of activity.
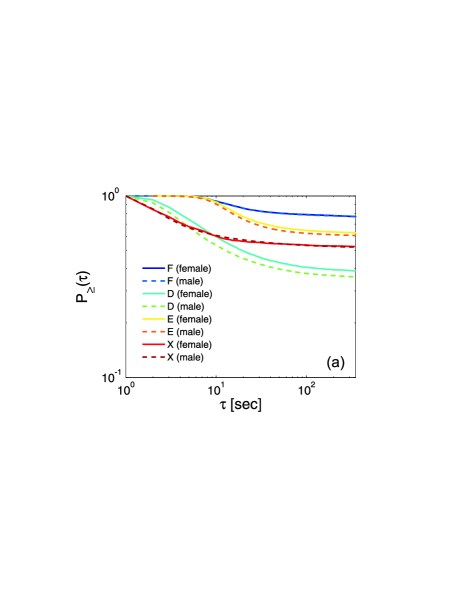
We conclude this section by studying players of different type. For the majority of actions, the interevent time distributions of males and females are very similar. We concentrate here on the actions where slight gender effect is present. In Fig. 8a we compare (for small ) for the E, F, D, and X actions of female (solid curves) and male (dashed curves) game characters. There is a slight gender effect in action interevent times in the process of marking friends and enemies, compatible what has been previously reported on a social network level in [27]. The difference for the negative actions (enemy adding and friend removing) and the positive actions (friend adding and enemy removing) might be explained by underlying biological or socio-dynamic reasons. Whereas the interevent time distributions of males and females performing positive actions (F and X) almost coincide, this is not the case for the negative actions (E and D), see Fig. 8a. The corresponding curves for females are always above those for males: negative actions performed by females have shorter time intervals. Whereas male and female act almost similarly when performing positive actions, females are faster in negative ones. Note, however, that such difference is not observed for the A, T, and C actions.
early-day late-day long times A -0.07 -2.46e-06 -3.64e-08 T -0.05 -1.81e-06 -3.71e-08 C -0.24 -5.65e-06 -4.55e-08 E -0.01 -0.56e-07 -3.49e-08 F -0.03 -0.88e-07 -3.80e-08 X -0.01 -0.29e-07 -3.41e-08 D -0.01 -0.34e-07 -3.13e-08
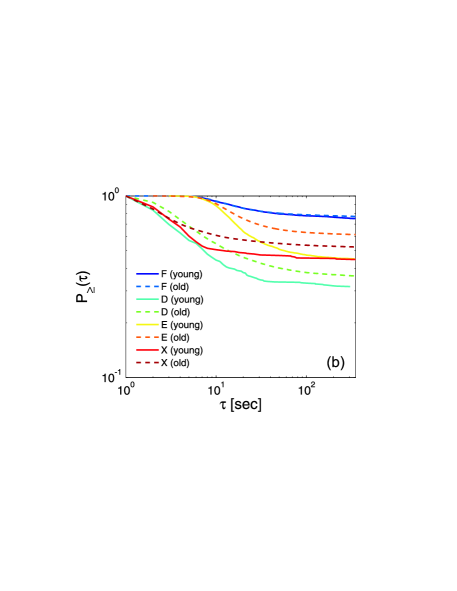
The details of the friendship-enmity marking actions can be observed also for players with different experience. Fig. 8b shows (for small ) are shown for young (solid curves) and old (dashed curves) players: the F curves coincide for young Pardus players. Old players are defined as those who have started the game at least one year before the last day of the data set. Young players are those who are younger than one year. The other curves for old players are always above those of the young players. The time intervals between marking somebody as an enemy or removing the marks are shorter for experienced players. The speed of marking friends is the same for all players. The majority of friends are typically marked early on in Pardus “life”.
4 Global dynamics and activity patterns: War and peace
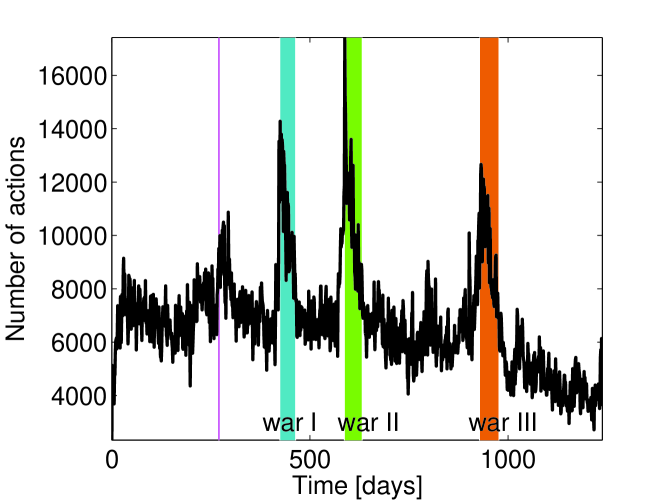
We now study how actions are distributed in time. The number of all actions types pooled together is shown for every day in Fig. 9. The time interval starts on 2007/06/12 and covers 1,238 consecutive days of players activity. There are four pronounced peaks in the player activity which can not be understood without knowing the history of the virtual world during the observation period.
-
•
The peak of activity on March, 2008 (magenta line in figure) was caused by the introduction of new major game features called “Syndicates” on March 7, 2008 [37]. Big changes in the game usually become a hot topic to discuss, leading to the higher level of C activity.
-
•
The peak of activity in August-September, 2008 (blue stripe in figure) corresponds to the war, that occurred in the period between 2008-08-08 and 2008-09-17 (war I).
-
•
The peak of activity in January-March, 2008 (green stripe in figure) corresponds to the war, 2009-01-18 – 2009-03-04 (war II).
-
•
The peak of activity in end December 2019 – February 2010 (orange stripe in figure) corresponds to a war between 2009-12-25 and 2010-02-12 (war III).
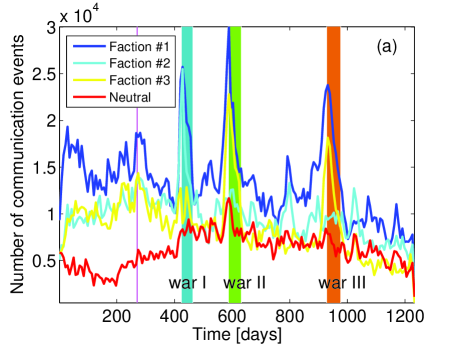
Before discussing player activity in peace and war periods we briefly explain how a war emerges in the virtual world. According to the specifics of the game [21] each player can belong to one of three factions (organizations) or stay neutral. There are three factions in the game: 1 – “Federation”, 2 – “Empire”, 3 – “Union”. Only two factions can participate in a war simultaneously. During the observation period the following pairs of factions were involved in wars: Factions 1 and 2 in war I and factions 1 and 3 in the next two wars. Factions 2 and 3 were never engaged in a war within the observation period.
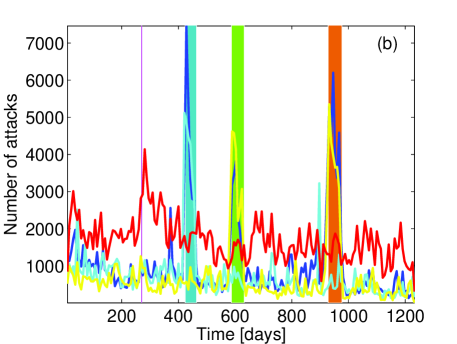
Table 3 collects basic statistics of actions during war and peace periods. The change in activity that leads to the overall increase of the number of actions of players engaged in war can be analyzed in more detail by studying the distributions for specific actions. The most distinct peaks are observed for C and A. In Fig. 10 we show the weekly number of C (a) and A (b) for the different factions. The highest number of actions occurs in those factions that are involved in wars. While the general level of activity during the wars increases, there are no distinct differences in the distributions of interevent times for peace and war periods, respectively.
[sec] % pos actions % neg actions % male All wars† 4,883 1,350,144 1,345,119 9,856,569 84.9 15.1 87.5 War I 3,034 422,386 419,181 3,111,881 84.2 15.8 86.8 War II 3,173 470,262 466,928 3,828,040 87.5 12.5 87.0 War III 2,816 457,496 454,532 4,024,289 82.8 17.2 88.5 Peace‡ 7,776 7,023,065 7,015,281 52,305,174 90.4 9.6 86.4
† Peace periods are ignored in the calculation of
‡ War periods are ignored in the calculation of
Taken that a war in a virtual world arises as a result of a complex process of social interactions between the players it is tempting to seek for war precursors. To this end we decided to check whether changes in player activity (of the different actions) may serve as a predictor for an upcoming war. In Pardus war officially starts whenever a so-called “faction-relation” ratio, defined by the game system for each pair of factions, exceeds a certain threshold value. The faction-relation is evaluated daily in a specific way that takes into account numerous behavioural factors of all players organised in factions, for more information see [21].
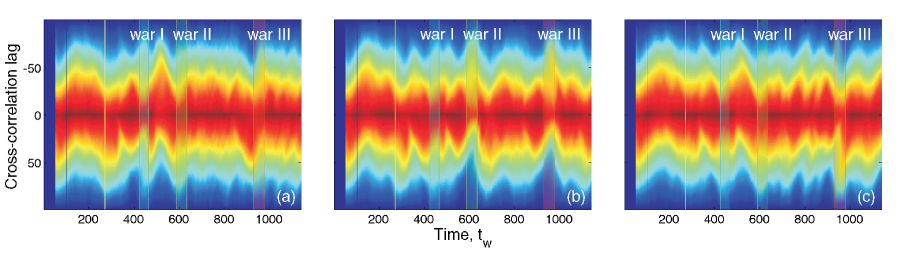
To test if one can predict a war based on activity data only, we applied a cross-correlation analysis and scanned for potential lead effects of activity patterns on the faction-relation time series. We performed a systematic scan for lead-lag relationships, involving all types of actions (some are seen in Fig. 10), all combinations of factions, for several sizes of time-windows. While we see clear differences between periods of war in peace in the extend of cross-correlations, we were unable to find conclusive precursors for the onset of war. This negative finding does not exclude the existence of other indicators that could have more predictive power than the activity patterns alone.
The cross-correlation values (colors) for all actions as a potential predictor for the faction-relation time series are presented in Fig. 11. Lead and lag values are on positive and negative y-axis, respectively. War regions are marked by vertical bars.
5 Conclusions
We used records about player activities in the MMOG Pardus to analyze several dynamical features of player actions. It has been shown in previous work that the characters in Pardus display rich and realistic social behavior [22, 24, 25, 26, 27, 28, 29, 30, 31, 32]. This includes the complex multiplex network structure of the Pardus society, complex multiplex network topologies of social interactions, non-ergodic behavioral action sequences, etc. In the present study we extend these observations by a thorough analysis of the interevent time distributions for the activities players can perform in the game. In particular, we have shown that the interevent time distributions in the Pardus universe highly non-trivial in nature. One feature of these distributions is an presence of periodic patterns on different scales, which correspond on the one hand to trivial circadian cycles, on the other hand to more non-trivial periods of the working day and to short scales of straightaway reactions. Similar to human activities in the real-world, non-trivial distributions go hand in hand with bursty dynamics [2, 3, 5, 8]. The measured value of burstiness of player actions, is compatible to the values reported for other types of human actions [10, 12] and implies long periods of inactivity between active periods.
Interevent time distributions for different actions show that although these distributions share several features, they are specific for the various types of actions. Different kinds of actions are characterized by different decay constants which indicate the typical “speed” of performing: time intervals between messages are usually shorter comparing with the other actions kinds, while the attack are performed more fast than trade; the longest time is necessary for friendship and enmity marking. We quantified decay times by exponential, Eq. (3), and power law, Eq. (2) fits to , depending on the time scale. The interevent time distributions are well fitted by power law within the interval 6 min 8 hours, while longer time intervals (6 min 8 hours) they are distributed exponentially. For long interevent times (8 hours ) the differences between actions types become less pronounced. The average values of interevent times also indicates different speeds in performing different types of actions. Even given the inactivity periods due to circadian cycles, the value of is smallest for communication and is much larger for other types.
Finally, we observed periods of increased activity in the Pardus due to history specific events, such as wars that were waged in the game. Our search for potential predictive indicators that would signal the onset of war lead to the negative conclusion that changes in player activity does not serve as reliable indicator of an upcoming massive conflict.
Acknowledgments
This work was supported in part by the 7th FP, IRSES project No. 612707 Dynamics of and in Complex Systems (DIONICOS) and by Austrian Science Fonds FWF P23378.
References
- [1] J. Kleinberg, Data Mining and Knowledge Discovery 7 (2003) 373.
- [2] A. Barabási, Nature 435 (2005) 207.
- [3] J.G. Oliveira, A. Barabási, Nature 437 (2005) 1251.
- [4] A. Vázquez et al., Phys. Rev. E 73 (2006) 036127.
- [5] T. Zhou, X.-P. Han, B.-H. Wang Towards the understanding of human dynamics. – In: M. Burguete, Lui Lam (Ed.), Science matters: humanities as complex systems, pp. 207–233, World Scientific, 2007.
- [6] R.D. Malmgren, D.B. Stouffer, A.S.L.O. Campanharo, L.A.N. Amaral, preprint arXiv:physics/0605027.
- [7] R.D. Malmgren, D.B. Stouffer, A.S.L.O. Campanharo, L.A.N. Amaral, Science 325 (2009) 1696.
- [8] K. Goh, A.L. Barabási, EPL 81 (2008) 48002.
- [9] Y. Wu, C. Zhou, J. Xiao, J. Kurths, H.J. Schellnhuber, PNAS 107 (2010) 18803.
- [10] H.-H. Jo, M. Karsai, J. Kertész, K. Kaski, New J. Phys. 14 (2012) 013055.
- [11] T. Yasseri, R. Sumi, J. Kertész, PLoS ONE 7(1) (2012) e30091.
- [12] T. Yasseri, R. Sumi, A. Rung, A. Kornai, J. Kertész, PLoS ONE 7(6) (2012) e38869.
- [13] A.K. Erlang, Elektrotkeknikeren 13 (1917) 5.
- [14] R.B. Cooper. Introduction to Queueing Theory (2nd edition), North Holland, New York, Oxford, 1981.
- [15] F.A. Haight, Handbook of the Poisson Distribution, Wiley, New York, 1967.
- [16] R.M. Anderson, R.M. May, Infectious diseases of humans, Oxford Univ. Press, New York, 1991.
- [17] R.D. Malmgren, D.B. Stouffer, A.E. Motter, L.A.N. Amaral, PNAS 105 (2008) 18153.
- [18] A. Stopczynski et al., PLoS ONE 9 (2014) e95978.
- [19] D. Lazer, A. Pentland, L. Adamic, S. Aral, A.-L. Barabási, et al. Science 323 (2009) 721.
- [20] W.S. Bainbridge, Science 317 (2007) 472.
- [21] Pardus game web-page http://www.pardus.at.
- [22] M. Szell, S. Thurner, Social Networks 32 (2010) 313.
- [23] E. Castronova, Synthetic Worlds: The Business and Culture of Online Games, The University of Chicago Press, Chicago and London, 2005.
- [24] M. Szell, R. Lambiotte, S. Thurner, PNAS 107 (2010) 13636.
- [25] M. Szell, R. Sinatra, G. Petri, S. Thurner, V. Latora, Scientific Reports 2 (2012) 457.
- [26] S. Thurner, M. Szell, R. Sinatra, PLoS ONE 7(1) (2012) e29796.
- [27] M. Szell, S. Thurner, Scientific Reports 3 (2013) 1214.
- [28] P. Klimek, S. Thurner, New J. Phys. 15 (2013) 063008.
- [29] B. Corominas-Murtra, B. Fuchs, S. Thurner, arXiv:1309.6740.
- [30] B. Fuchs, S. Thurner, PLoS ONE (2014), in print.
- [31] B. Fuchs, D. Sornette, S. Thurner, preprint arXiv:1403.3228.
- [32] R. Sinatra, M. Szell, Entropy 16 (2014) 543.
- [33] P.J. Mucha, T. Richardson, K. Macon, M.A. Porter, J.P. Onnela. Science 328 (2010) 876.
- [34] J. Gao, S.V. Buldyrev, H.E. Stanley, S. Havlin. Nature Phys. 8 (2011) 40.
- [35] M. De Domenico, A. Solé-Ribalta, S. Gómez, A. Arenas. PNAS 111 (2014) 8351.
- [36] T. Zhou, H.A.T. Kiet, B.J. Kim, B.-H. Wang, P. Holme, EPL 82 (2008) 28002.
- [37] http://www.pardus.at/index.php?section=archive&show=69