FACT –
Operation of the First G-APD Cherenkov Telescope
Abstract
Since more than two years, the First G-APD Cherenkov Telescope (FACT) is operating successfully at the Canary Island of La Palma. Apart from its purpose to serve as a monitoring facility for the brightest TeV blazars, it was built as a major step to establish solid state photon counters as detectors in Cherenkov astronomy.
The camera of the First G-APD Cherenkov Telesope comprises 1440 Geiger-mode avalanche photo diodes (G-APD aka. MPPC or SiPM) for photon detection. Since properties as the gain of G-APDs depend on temperature and the applied voltage, a real-time feedback system has been developed and implemented. To correct for the change introduced by temperature, several sensors have been placed close to the photon detectors. Their read out is used to calculate a corresponding voltage offset. In addition to temperature changes, changing current introduces a voltage drop in the supporting resistor network. To correct changes in the voltage drop introduced by varying photon flux from the night-sky background, the current is measured and the voltage drop calculated. To check the stability of the G-APD properties, dark count spectra with high statistics have been taken under different environmental conditions and been evaluated.
The maximum data rate delivered by the camera is about 240 MB/s. The recorded data, which can exceed 1 TB in a moonless night, is compressed in real-time with a proprietary loss-less algorithm. The performance is better than gzip by almost a factor of two in compression ratio and speed. In total, two to three CPU cores are needed for data taking. In parallel, a quick-look analysis of the recently recorded data is executed on a second machine. Its result is publicly available within a few minutes after the data were taken.
The telescope is the first Cherenkov telescope which is operated completely remote. Its data taking is fully automatic, although interventions by the remote shifter are still necessary in case of events like sudden weather changes.
Index Terms:
FACT, Cherenkov astronomy, Geiger-mode avalanche photo diode, focal plane, MPPC, SiPMI Introduction
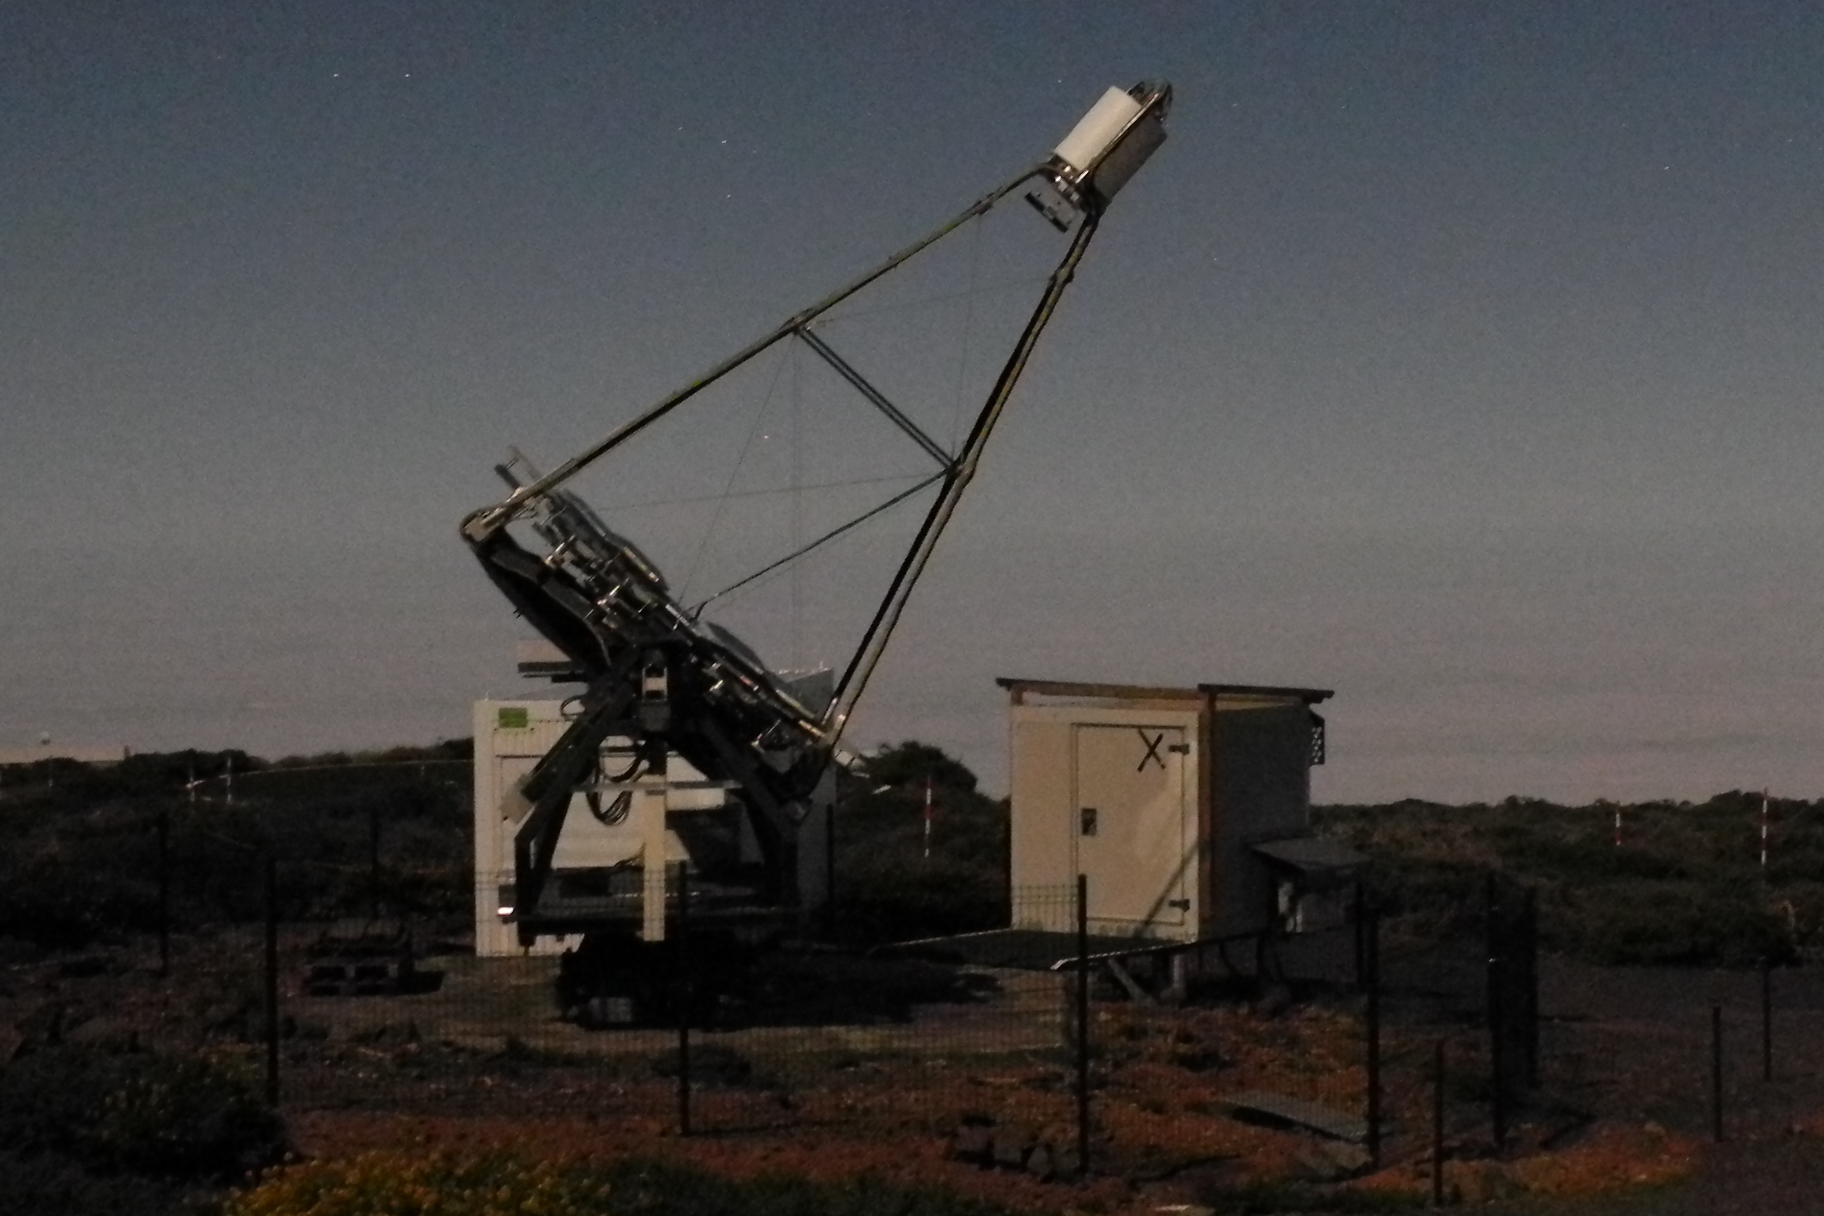
For the first time, a Cherenkov telescope is operated using Geiger-mode avalanche photo diodes (G-APD aka. SiPM) as photo detectors. It is also the first time that a Cherenkov telescope is operated remotely. The First G-APD Cherenkov Telescope (FACT) as shown in Fig. 1 has been operated for three years and situated at the Observatorio Roque de los Muchachos at the Canary island of La Palma (Spain). First results were published in [1, 2].
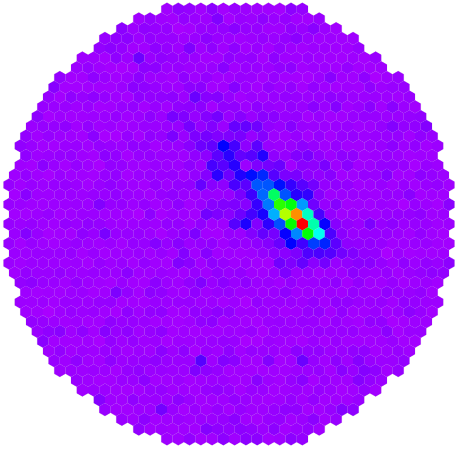
The imaging air-Cherenkov technique is an indirect measurement technique, which is necessary as gamma-rays do not penetrate the Earth’s atmosphere down to ground. Instead, Cherenkov telescopes record light flashes of the Cherenkov light emitted by the particle cascade induced by a primary particle hitting the Earth’s atmosphere. Using the recorded light intensity and distribution allows to reconstruct energy and direction of the primary particle as well as its type. An example of a recorded shower image is shown in Fig. 2.
To detect these faint light flashes which last only several nano-seconds, a fast and very sensitive camera is necessary. In the past, such cameras have used photo multiplier tubes for photo detection. The focal plane is equipped with 1440 sensors each readout individually. Each sensor is glued to a solid light guide to increase the light collection area of the sensor. The field-of view of each sensor is 0.11° providing a total field-of-view of 4.5°.
The response of silicon based photo sensors depends on the ambient temperature and the applied voltage. Therefore, a feedback loop is necessary which corrects for the temperature effect and the voltage drop induced by changing ambient light levels.
For data acquisition, the Domino Ring Sampler DRS 4 is used. Under standard data taking conditions, the waveform is sampled with 2 Gsamples and a readout window of 150 ns. The data is transferred via Ethernet to a standard PC. A proprietary loss-less compression algorithm compresses the data in real time while it is written to disk.
Apart from the data acquisition software, many other systems have to be controlled and read out. A common software framework for all programs ensures easy maintenance and simplifies the implementation. To control the system centrally, a JavaScript interpreter is used. The use of JavaScript allows easy scripting while forcing some simplicity for the scripts.
The common framework, the application of modern programming techniques and the simplicity of the implemented programs ensure a stable operation.
The observation schedule is stored in a central database and can be edited from a web interface. This allows full automation of the system. While some steps during data taking as start-up and shutdown or the reaction on significant worsening of weather conditions are still partially manual for security reasons, data taking itself is fully automatic.
A web based monitoring and control allows full control over the system operated under standard conditions. In other cases, each program can be controlled individually from a console interface.
An analysis running in parallel just after data recording ensures the availability of flux estimates a few minutes after data taking.
The following will give a short introduction to the feedback system which has been discussed in more details in [3] together with the results of the measurements. It will give a more detailed description of the implementation of the data acquisition software, the data compression, the slow control software and the remote control software.
More technical details about the hardware and software are provided in [4].
II Feedback
The response of silicon based photo sensors depends on their temperature and the applied voltage. To correct the temperature effect, their temperature can be measured and the applied voltage adapted accordingly. The applied voltage can change due to the increased voltage drop at the supporting resistors when the ambient light level is changing. To correct this effect some kind of feedback is necessary.
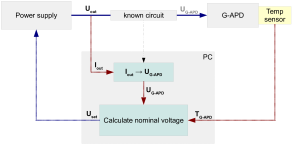
In the FACT camera, the temperature of the focal plane is measured at 28 positions and interpolated. To close the feedback loop for the voltage control, the current is measured about once a second for each voltage channel and the corresponding voltage drop calculated. The output voltage of the power supply is then adapted for each voltage channel accordingly. A sketch of the loop is shown in Fig. 3.
That this keeps the sensor properties stable within the limit of the power supply has been demonstrated in [3]. For that, dark counts have been recorded and analyzed and the corresponding dark count spectra compiled. The fact that they can be super-positioned although taken at different temperatures, shows impressively the precision of the system.
III Data acquisition
For the total number of 1440 readout channels, 160 Domino Ring Sampling chips (DRS 4) are used mounted on 40 readout boards. Each readout board has an Ethernet port and is connected to a switch from which four Ethernet cables are connected to an Ethernet card in a PC. The maximum throughput achieved is around 240 MB/s which corresponds to the maximum data rate the used Ethernet chips can provide. Under normal data taking conditions, sampling 150 ns with 2 Gsamples and trigger rates below 100 Hz, the data rate is well below that limit. For some calibration data, the system is operated close to its throughput limit. As protocol, the TCP/IP protocol is used, because it ensures that packages do not get lost and that they arrive in the correct order. The data acquisition software is implemented in C++11 and is using the boost-libraries.
There are several ways to read data from several Ethernet ports (poll, epoll, etc.), but tests have shown that the most efficient way is a continuous non-blocking read from a socket (recv). There is no real need to run more than a single thread reading from the 40 open sockets and the additional need for synchronization would significantly increase complexity.
The maximum size of data which can arrive from each board per event is pre-allocated and used as a static buffer. Once the first header of any of the 40 boards of an event has arrived, the memory for the whole event is allocated. Since allocation and de-allocation can become a time consuming operation when large memory chunks are handled or memory becomes fragmented, the memory is allocated in chunks corresponding to the maximum event size and never freed. Each free operation is just putting the corresponding pointer back on a stack from where it is retrieved if new memory is requested. Physical allocation takes only place when not enough memory is allocated or available. To avoid conditions in which the system runs out of memory, the maximum amount of memory which can be allocated is limited. If this limit is reached, no further read operation takes place until free memory becomes available again.
Pointers to the event objects are stored and handled by shared pointers (std::shared_ptr), so that memory is kept allocated until all references to the event have vanished and is automatically freed once no reference are left. This ensures efficient memory handling and intrinsically avoids segmentation faults. To keep a list of incomplete events, a double-linked list (std::list) is used keeping a constant access time for adding and removing entries.
Once an event has been compiled from all 40 boards and is completely available in memory, its shared pointer is propagated to a Queue. A Queue is a thread which is processing the data in a queue with a pre-defined processing function. Using a conditional mutex the thread can be sleeping until it gets woken up by a signal which is automatically emitted when a new entry is added to the queue. It will only fall asleep again when there are no further events in the queue. In this way, CPU time is not wasted for waiting operations keeping an efficient handling of the events. If an event was successfully processed, the shared pointer is either released or handed over to a new queue. This concepts ensures a self consistent handling of the memory with a high flexibility and also allows an easy implementation of new algorithm processing the data. Only access to the stack of pointers needs to be protected against race conditions by mutex semaphores.
Currently several queues are available and executed sequentially. The first queue only tests the integrity of the events. In the secondary queue, events are written to disk. Whenever the run-number in the sequence of events has changed, a new file is opened automatically.
In parallel, the event is posted to a processing queue, where some calibration is applied which is necessary to calibrate the features of the DRS 4, so that a first analysis of each event is available. Within an interval of three seconds, the event with the highest signal is selected and available for display in a graphical interface to have an easy way to monitor the system.
Other parallel queues propagate header information, counters and other meta data extracted from the events to the slow control system.
No further analysis is applied yet, but the implementation of a software trigger within this concept should be trivial.
IV Data compression
The data is written to FITS files. The FITS format is a format widely spread in astronomy. Its main purpose is writing of tables with a predefined row-size. The data format is described in a well-defined header which makes the format self-consistent. If the binary data written to the tables is compiled in memory, it can be written as a direct stream to the files as one stream which makes it an efficient data format for continuous data streams. Decompilation of the data can be done in a similar manner once data is read from the file. Also here the advantage is a very efficient access and the possibility to read the data as a single stream, interesting for example if compression algorithms like gzip are applied. Using the z-library (libz), data can be decompressed during a normal read operation so that compressed files can be read directly. However, the compression ratio of this library (or gzip) is not optimal for the raw data, therefore, a proprietary algorithm was implemented.
In a first step, the offsets calculated for each capacitor in all DRS chips is subtracted as an integer offset. This operation is easily reversible and significantly decreases the amount of random noise in the sampled waveforms. In a second step, the data is smoothed to keep the number of necessary tokens low. Therefore, from each sample, the average of the two previous samples is subtracted which is a good estimate of the next sample. The advantage is that this operation is fully reversible. The averaging of two samples decreases the amount of noise in the subtracted value significantly. As now 16-bit values are available of which in almost all cases the hi-byte is zero, a simple compression algorithm like a byte-wise Huffman encoding would still need at least one bit to encode the hi-byte. Therefore, a word-wise Huffman encoding is applied.
The implemented compression algorithm is significantly faster than applying a z-lib compression and compresses the data by almost a factor of two better. If compressed event by event, the algorithm can easily be parallelized. This allows to easily run the compression in real time during data taking while saving a significant amount of disk space and lowering the I/O demands on the system. During standard data taking, typically less than one core is enough for data compression. In case of maximum trigger rates, about three cores are needed.
V Slow control
The slow control system is based on a common framework and communication via the Distributed Information Management System (DIM, [5]). The DIM-network allows to send commands to servers as well as updating so-called services, which can be considered a broadcast of a piece of information to all clients. The configuration of the whole system is stored in a database and re-loaded from the database at each start of a program. Changing of the setup during runtime is intentionally not foreseen to avoid easy change of the setup during data taking. A web interface is available to edit the setup. A history of all changes is avilable and a web interface to to compare configurations from different dates and times.
To ensure stable operation of the system, generally memory is never allocated manually, instead flexible data members like std::vector are used. Having a central event queue in each program avoids the need for any synchronization which significantly reduces complexity. Events can either be triggered by the user via commands arriving through the DIM-network, console input processed by the readline library or service updates. The central event queue ensures sequential processing which significantly simplifies the code dealing with asynchronous inputs.
Since each DIM command comes with the format of its parameters, a command entered in the console interface can be directly converted into a command sent over the network or to the local client. This avoids the need to implement a console based command interface and enables the easy implementation of a central command interface. To simplify the interpretation of the command arguments, each server automatically offers a additional description service which distributes the description of the command parameters as well. A similar service is available for the DIM services, so that for each value in a DIM service a name, a unit and a description is available.
A central data logger is logging all service updates in the DIM network, so that all values which are available from each server are automatically logged to files. Human readable logging is also broadcasted as DIM service and hence logged by the central data logger as well.
Since all information is available as DIM service and all actions can be executed via commands, it is very simple to implement a graphical user interface. Since many user interfaces (as Qt 4) implement central event queues, received data can be propagated to such a queue and displayed in graphical elements. Buttons and other controls can be connected to DIM commands. This allows a very simple implementation of a graphical interface just using a GUI builder as the qt4-builder.
For the implementation of a central control, a JavaScript interpreter has been chosen which allows to enhance the language with callbacks to C-functions. This has two advantages: The simplicity of JavaScript forces the implementation of higher level functionality such as histogramming somewhere else which keeps the central scripts simple and therefore easy to maintain. The second advantage is that the JavaScript sandboxes can be fully integrated and controlled by the existing framework. The fact that there is full control over the interactions of the script from outside ensures that the integrity of the system can be maintained at any time improving the stability of the system significantly.
Having this framework available, implementation of communication with additional hardware components or new clients is reduced to the setup of the user commands, the implementation of the action based on the commands and the implementation of handling data received from possible hardware components.
Since most of the intelligence is based in the framework and therefore implementation of the final programs remains simple, a high level of stability is ensured important for any remotely and automatically operated instrument. This is demonstrated by a typical data taking efficiency of more than 90% per night, mainly limited by the time needed to re-position the telescope, as shown in [6].
VI Remote control
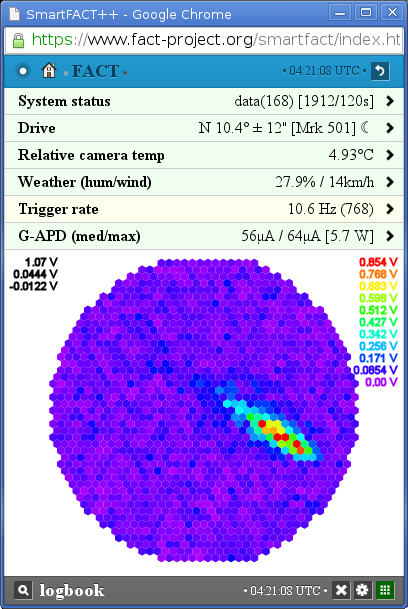
For remote control, a web interface [7] (Fig. 4) has been implemented. Its back-end is a client which subscribes to all DIM services in the DIM network, similar to the central data logger. The data received is then processed and the contents of small ASCII files are updated accordingly. The ASCII files contain the raw values, or an encoded history of values or a list of values corresponding to the channels in the camera.
To keep the traffic low, the page layout and the displayed data is transferred separately so that the continuous data stream is reduced to the raw information which is really updated. By loading the page, mainly a small JavaScript is retrieved. After the JavaScript has loaded the layout of the requested page, the page is compiled interactively in the browser and the data loaded and updated in regular intervals. This allows transfer rates of less than 1 kB/s which is low enough that even monitoring from a mobile phone with a slow internet connection is possible. At the same time, this also limits the possibility for page layouts which unifies the control and therefore ensures an easy understanding of the functionality.
If a page is marked as a command-page, a button is displayed allowing to submit form-data or just a command to an interpreting php. The php then calls a program which injects the command into the DIM network and therefore propagates it to the corresponding server. This allows direct control of all functions needed during standard data taking and, in turn, avoids the need to be logged in on the machines running the system and thus keeps uncontrolled user interference to a minimum, a requirement for each stable system.
VII Automation
To automate operation, a central JavaScript takes care of the operation of the telescope. Its main purpose is to convert a schedule stored in a database into actions. In addition, it ensures to bring the whole system back into a well controlled condition once started, so that in the rare cases of failure a restart is enough. Typical actions during standard data taking are opening or closing the lid, switching the bias voltage of the sensors on or off, re-position the telescope and start data recording. At this high level some actions can be executed synchronously to gain observation time.
The schedule can be coded as JSON object and entered into the database via a locally executed JavaScript or from a web-page. The schedule stores a list of observations and tasks. Each observation has a fixed start time and can contain several tasks which are executed sequentially. If the start time for the next observation has passed, the current run or action is finished and the next observation started right after. To be flexible, a configuration formatted as JSON string can be added to each task. This allows the implementation of many possible configurations.
In this system, only the last task in an observation can be of an undefined length. While the previous tasks have to be limited in time, the last task, e.g. standard data taking, might be executed until the next scheduled observation. Assuming a potential problem in the data taking procedure or a newly discovered error, a restart of the program could easily re-execute the first task of an observation over and over again. Therefore, if the start time has already passed, only the last task of the current observation is executed. If the script is started before the scheduled time, all tasks are executed normally. To avoid that after restart, the last scheduled task is executed again, e.g the operator wants to wait for better weather conditions, an idle-task can be scheduled.
VIII Conclusions
The First G-APD Cherenkov Telescope (FACT) is the first Cherenkov telescope which is operating with silicon photo sensors and which is fully remote controlled. With the implementation of a feedback system, it has been proven that the respose of those sensors can be kept stable within the limits of the power supply, and effects from changing light level and ambient temperatures can be corrected.
A well designed data acquisition software ensures stable operation of the program for months without interruption. A proprietary compression algorithm allows real-time compression during data taking with a significantly increased compression ratio as compared to gzip. The common framework used for all programs keeps maintenance needs low and increases simplicity of the individual programs. Both together ensure a stable operation of the whole system. For remote control, a JavaScript interface is available allowing a well controlled access to all components of the telescope enabling the implementation of a very efficient data taking. A web interface with low bandwidth requirements allows to control and monitor the system easily from everywhere with just a mobile phone under normal data taking conditions. Excluding external factors, data taking efficiencies of more than 90% are achieved only limited by fixed operation times like re-positioning.
Just after data is recorded, a quick look analysis is executed on a PC in parallel. The results of this analysis, are publicly available online at [8].
References
- [1] T. Bretz, D. Dorner et al. (FACT Collaboration), AIP Conf. Proc. 1505 (2012) 773.
- [2] D. Dorner et al. (FACT Collaboration), In proc. of the \nth33 Internat. Cosmic Ray Conf. (2013) [arXiv:1311.0478].
- [3] A. Biland et al. (FACT Collaboration)
- [4] H. Anderhub et al. (FACT Collaboration) 2013, JINST 8 P06008 [arXiv:1304.1710].
- [5] http://dim.cern.ch/
- [6] T. Bretz et al. (FACT Collaboration), In proc. of the IEEE Nuclear Science Symposium and Medical Imaging Conference (NSS/MIC) (2013) [arXiv:1403.3573].
- [7] http://www.fact-project.org/smartfact/
- [8] http://www.fact-project.org/monitoring/