A Delayed Transition to the Hard State for 4U 1630–47 at the End of Its 2010 Outburst
Abstract
Here we report on Swift and Suzaku observations near the end of an outburst from the black hole transient 4U 1630–47 and Chandra observations when the source was in quiescence. 4U 1630–47 made a transition from a soft state to the hard state 50 d after the main outburst ended. During this unusual delay, the flux continued to drop, and one Swift measurement found the source with a soft spectrum at a 2–10 keV luminosity of erg s-1 for an estimated distance of 10 kpc. While such transients usually make a transition to the hard state at –3%, where is the Eddington luminosity, the 4U 1630–47 spectrum remained soft at % (as measured in the 2–10 keV band), where is the mass of the black hole in units of 10. An estimate of the luminosity in the broader 0.5–200 keV bandpass gives %, which is still an order of magnitude lower than typical. We also measured an exponential decay of the X-ray flux in the hard state with an e-folding time of d, which is much less than previous measurements of 12–15 d during decays by 4U 1630–47 in the soft state. With the 100 ks Suzaku observation, we do not see evidence for a reflection component, and the 90% confidence limits on the equivalent width of a narrow iron K emission line are 40 eV for a narrow line and 100 eV for a line of any width, which is consistent with a change of geometry (either a truncated accretion disk or a change in the location of the hard X-ray source) in the hard state. Finally, we report a 0.5–8 keV luminosity upper limit of erg s-1 in quiescence, which is the lowest value measured for 4U 1630–47 to date.
Subject headings:
accretion, accretion disks — black hole physics — stars: individual (4U 1630–47) — X-rays: stars — X-rays: general1. Introduction
Most of the binary black hole systems in our Galaxy are X-ray transients that undergo outbursts where the luminosity can change by factors of or . As the observational properties of these systems change during outbursts that last for a few months to a few years, they can undergo state transitions. There are different schemes for classifying states (e.g., Homan & Belloni, 2005), but one useful classification depends largely on whether the thermal, soft power-law, or hard power-law component dominates the 1–20 keV energy spectrum. These are called the thermal-dominant, steep power-law, and hard states, respectively (McClintock & Remillard, 2006), and intermediate states also occur. Physically, the thermal-dominant state occurs when the optically thick accretion disk extends near or all the way to the innermost stable circular orbit (ISCO), and this component is well-modeled with a multi-temperature disk component (McClintock et al., 2006). While radio jets are quenched during the thermal-dominant state (Fender et al., 1999; Russell et al., 2011), the hard state has steady jets that emit in the radio, IR, and perhaps at higher frequencies (Corbel et al., 2000; Fender, 2001; Corbel & Fender, 2002; Russell et al., 2013).
Most often, black hole transients have outbursts where the source rises in the hard state, makes a transition to the thermal-dominant or steep power-law state at a relatively high luminosity, and then transits back to the hard state at lower luminosity (Fender, Belloni & Gallo, 2004; Corbel et al., 2004; Belloni et al., 2005; Dunn et al., 2010). This hysteresis effect and its cause have been a topic of extensive discussion, and many theories have been advanced to explain it. One idea is that sources tend to stay in the hard state during the rise because the hard X-ray emission keeps the corona hot while sources tend to stay in the soft state (i.e., either the thermal-dominant or steep power-law state) during decay because the soft X-ray emission keeps the corona cool (Meyer-Hofmeister, Liu & Meyer, 2005; Liu, Meyer & Meyer-Hofmeister, 2005). Another possibility is the two-flow picture where there is a Keplerian flow that corresponds to the optically thick accretion disk and a sub-Keplerian flow with the energetic electrons that produce the hard X-rays (Chakrabarti & Titarchuk, 1995). In this model, the bright hard state can be explained by a longer (viscous) time scale for changes in the Keplerian flow compared to the sub-Keplerian flow (Debnath, Chakrabarti & Nandi, 2013).
In other potential explanations for the hysteresis, the large-scale magnetic field in the disk, which can depend on the accretion state or the type of accretion flow, plays an important role (Petrucci et al., 2008; Begelman & Armitage, 2014). The Begelman & Armitage (2014) model explains the hysteresis by invoking the connection between the magnetic field and the viscosity. With the magnetorotational instability being the source of viscosity (Balbus & Hawley, 1991), changes in magnetic field imply changes in disk viscosity, and hysteresis is produced because the transition luminosity is given by (Esin, McClintock & Narayan, 1997), where is the viscosity parameter and is the Eddington luminosity. Petrucci et al. (2008) also emphasize the role of the magnetic field in producing the hysteresis, but this is primarily through the possible connection between the magnetic field in the inner disk and the production of jets. Petrucci et al. (2008) and Begelman & Armitage (2014) discuss how changes in the magnetic field may explain the the observed jet behaviors such as the steady jet in the hard state and the impulsive relativistic jets that are typically produced when systems make a transition from a bright hard state (Fender, Belloni & Gallo, 2004; Corbel et al., 2004; Fender, Homan & Belloni, 2009).
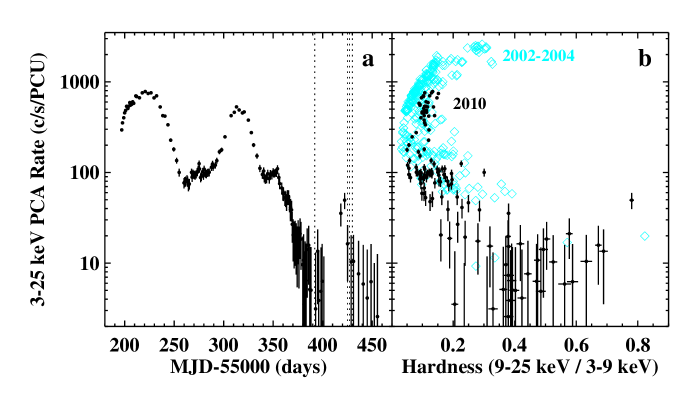
In this context, 4U 1630–47 is an interesting source since the large number of outbursts allows us to compare their properties. At least one well-studied outburst follows the typical hysteresis pattern. In 1998, the source was seen in the hard state during the rise (Dieters et al., 2000), radio jets were produced (Hjellming et al., 1999), and it made a transition back to the hard state at a much lower luminosity than the transition during the rise (Tomsick & Kaaret, 2000). However, other outbursts have shown very different behavior. A detailed comparison between the 1998 outburst and the 2002–2004 outburst showed that the 2002–2004 outburst was much softer (Tomsick et al., 2005), and it did not exhibit bright hard states (Tomsick et al., 2005; Abe et al., 2005) or radio emission (Hannikainen et al., 2002). The 2010 outburst was very similar to 2002–2004 in terms of hardness and evolution (see Appendix); however, while there was no observational coverage of the end of the 2002–2004 outburst, we have obtained such coverage in 2010.
Given the fact that 4U 1630–47 is in a crowded region of the Galactic Plane, source confusion was a major issue for the Rossi X-ray Timing Explorer (RXTE; Bradt, Rothschild & Swank, 1993) in following the source to low luminosities during previous outbursts (Tomsick et al., 2005). Thus, in this work, we have used X-ray imaging observations with Swift, Suzaku, and Chandra to study the end of the 2010 outburst and quiescence (although the RXTE measurements are shown in the Appendix). A main motivation for this study is to determine the time of the transition to the hard state and to obtain a long observation with Suzaku after the transition in order to measure the iron K emission line that comes from the reflection component (e.g., Fabian et al., 1989). This follows a similar campaign where we observed GX 339–4 and obtained iron line measurements that provided evidence for truncation of the accretion disk (Tomsick et al., 2009). In the following, we describe the observations and how the data were analyzed (Section 2), report the results of the analysis, focusing on the evolution of the energy spectrum (Section 3), and then provide a discussion of the evolution of the spectral states and the implications for the constraints on the iron line and the quiescent luminosity limit (Section 4).
2. Observation and Data Reduction
We report on Swift and Suzaku observations of 4U 1630–47 taken between 2010 July 15 and 2010 Aug 17 near the end of an outburst and Chandra observations made in 2011 June when the source was in quiescence. The Observation IDs, start and stop times, and total exposure times are listed in Table 1, which lists four relatively short (690–4,617 s) Swift observations, a long (100 ks) Suzaku observation, and two 19–20 ks Chandra observations.
We reduced the Swift and Suzaku data using High Energy Astrophysics Software (HEASOFT) v6.15 along with the 2013 March 13 (for Swift) and 2013 September 16 (for Suzaku) releases of the Calibration Database (CALDB). For Swift, we produced photon event lists and exposure maps using xrtpipeline. The X-ray Telescope (XRT; Burrows et al., 2005) was in photon counting mode, which provides 2-dimensional imaging information. For the source spectrum, we extracted the photons from a circle with a 20-pixel () radius centered on 4U 1630–47. The background spectrum came from a source-free region in another part of the field of view. We used xrtmkarf to make an ancillary response matrix and included an exposure map correction. For the response matrix, we used the file selected from the CALDB by the xrtmkarf program.
For Suzaku, we reprocessed the data from the X-ray Imaging Spectrometers (XISs; Koyama et al., 2007) using aepipeline in order to apply the most recent calibrations. We made an event list for each of the three XIS units (XIS0, XIS1, and XIS3). We extracted light curves and spectra using a circular source region with a radius of 100 pixels (). For background regions, we used a rectangular region close to the edge of the field of view with dimensions of by . We used xisrmfgen and xissimarfgen to make the response files. For the energy spectra, we combined XIS0 and XIS3 as they have very similar response matrices.
We analyzed data from Chandra ObsIDs 12530 and 12533, which are observations made as part of the Norma spiral arm survey (PI: Tomsick). The Advanced CCD Imaging Spectrometer (ACIS; Garmire et al., 2003) instrument was used for both ObsIDs, and the aimpoint was on the ACIS-I detector. 4U 1630–47 was and from the aimpoint for ObsIDs 12530 and 12533, respectively. For data reduction, we used the Chandra Interactive Analysis of Observations (CIAO) software and made event lists using chandra_repro. An inspection of the 0.5–8 keV images does not show any evidence for a source at the position of 4U 1630–47 for either observation. Given the large off-axis angle for ObsID 12533, the sensitivity is much better for ObsID 12530, and we report on a detailed analysis of the data from ObsID 12530 below.
3. Results
Figure 1a shows the RXTE All-Sky Monitor (ASM) light curve for the 2010 outburst. The Swift X-ray Telescope (XRT) and Suzaku observations occurred well after the bright part of the outburst, but the Swift Burst Alert Telescope (BAT) light curve (Figure 1b) shows that a reflare occurred during this time. The reflare was also reported based on observations with the RXTE Proportional Counter Array (PCA; Tomsick & Yamaoka, 2010), and the increase seen by the PCA (see Appendix) led to the XRT observations. The XRT observations confirm that the reflare is from 4U 1630–47 as reported in Tomsick & Yamaoka (2010) and as shown in Figure 2.

For spectral analysis, we used the XSPEC software package (Arnaud, 1996), fitting the four Suzaku spectrum and the Swift spectra in a uniform way. Due to systematic uncertainties in the XIS response matrix associated with absorption edges in the instrument materials, we did not include the 1.65–1.9 keV or 2.2–2.4 keV energy bands, but we used the rest of the 0.4–9 keV and 0.4–12 keV bandpass for XIS1 and XIS0/3, respectively. We rebinned the spectra to at least 100 counts per bin for XIS1 and to at least 200 counts per bin for XIS0/3. For the 0.5–10 keV XRT spectra, we rebinned so that each bin (except for the highest energy bin) has a detection at the 3- level or higher. When fitting, we minimized the W-statistic, which is a generalization of the Cash statistic (Cash, 1979) for the case of non-zero background, and we used as the test statistic.
We fitted each spectrum individually with an absorbed power-law model. 4U 1630–47 is known to have a high column density, and both interstellar material as well as material local to the source may contribute. As any local contribution could be variable, we left the column density as a free parameter in our fits. We used Wilms, Allen & McCray (2000) abundances and Verner et al. (1996) cross-sections for the absorption calculation. The power-law model provides a good description of the Swift spectra as indicated by the reduced- () values reported in Table 2. For observation #1, the spectrum is very soft with a power-law photon index of (90% confidence errors). The spectrum hardened dramatically after observation #1, and during observations #2, #3, and #4, the range of best fit values is –1.7, and the 90% confidence upper limits on are 2.0, 2.2, and 2.1, for the three observations, respectively. The spectral transition is illustrated in Figure 3.

The softness of the spectrum for observation #1 suggests that it is more likely dominated by thermal emission rather than a power-law. We fit the spectrum with an absorbed multi-temperature blackbody model (Mitsuda et al., 1984), commonly called the disk-blackbody model, and this also provides an acceptable fit with for 12 degrees of freedom (dof). The disk-blackbody fit returns a value of keV for the temperature at the inner edge of the accretion disk, which is typical for accreting black holes in the soft state. The normalization we measure, , is related to the inner disk radius according to , where is the inner radius in units of km, is the distance to the source in units of 10 kpc, and is the disk inclination. Thus, corresponds to km (). Given that the distance to 4U 1630–47 is estimated to be near 10 kpc and that the binary inclination is not extremely high (since the source is not eclipsing), such a small inner radius would only be consistent with a very low mass black hole: 1–2 for the maximally rotating case and an even smaller mass for slower rotation rates.
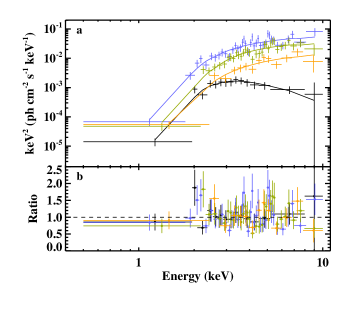
A much more likely scenario is that the observation #1 spectrum actually has two components: the disk-blackbody and a power-law. We re-fitted spectrum #1 with such a two component model, and this allows for a significantly larger normalization for a disk-blackbody component with keV (both are 90% confidence upper limits). With the possibility of the higher , the implied inner radius is km (), which is physically reasonable. While the estimates or limits are useful for determining which spectral model is the most likely, it should be noted that, in addition to the distance and inclination uncertainties, there are other corrections that would be necessary (McClintock et al., 2006) if our intent was to report a measurement of .
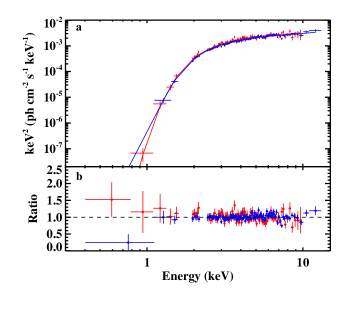
The Suzaku/XIS spectrum (observation #5) is well-described by an absorbed power-law model (see Figure 4 for the spectrum and residuals and Table 2 for the parameter values) with cm-2 and . Such a value for the power-law photon index is expected for a black hole in the hard state. We might also expect to see evidence for a reflection component in the spectrum. While the limited bandpass of XIS would not allow us to detect the Compton bump, which peaks near 20–40 keV (Lightman & White, 1988), the characteristic iron emission line and absorption edge is covered by XIS. Although the residuals (see Figure 4b) do not show strong evidence for iron features, adding a Gaussian with a centroid of keV and a width of keV improves the fit from to . We used the XSPEC script simftest to produce 1000 simulated XIS spectra with an absorbed power-law as the input spectrum and to fit them with and without a Gaussian. While fitting the simulated spectra, was restricted to 6–7 keV and was kept within the 90% confidence error range found when fitting the actual data. We found improvements in the fit as large as the observed improvement for 15 of the simulated spectra, indicating that the significance of the line is 2.2-, which we do not consider to be a significant detection. With the Gaussian parameters free, the 90% confidence upper limit on the equivalent width () of the line is 100 eV. For a narrow line at 6.4 keV, the value is eV.
To understand the implications of these upper limits for reflection models, we fit the XIS spectra with a model consisting of an absorbed power-law model and the reflionx reflection model (Ross & Fabian, 2005). When leaving the parameters for this model free, the best fit value for the ionization parameter is its minimum value ( erg cm s-1) in order to fit the low-level emission feature near 6.4 keV. The iron abundance is not constrained, and we fix it to the solar value (1.0 in the reflionx model). Fitting the spectrum with this model gives a 90% confidence upper limit on the reflection covering fraction of . While this upper limit is valid for the case where there is no relativistic smearing of the reflection component (e.g., if the disk is truncated), if we allow the reflection component to be smeared using, e.g., kdblur (Laor, 1991), a significantly higher covering fraction is possible.
The evolution of the source during observations #1–5 is consistent with a transition from a low-luminosity soft or intermediate state during observation #1 to a hard state in observation #2. We investigated the source evolution during the decay by making a light curve of the absorbed 1–10 keV fluxes during observations #2–5. We calculated one flux point for each of the Swift observations and made a light curve with 5500 s (approximately the satellite orbital period) time resolution for Suzaku. We converted the XIS count rates to fluxes using the power-law fit to the energy spectrum. The model shown in Figure 5 shows that an exponential with an e-folding decay time of d provides a good description of the Suzaku and Swift points ( for 42 dof).
Although there is a long gap of nearly 10 months between the Suzaku and Chandra observations, the Chandra observation provides an opportunity to determine if the source continued its decay into quiescence. For the observation on 2011 June 16 (ObsID 12530), 4U 1630–47 was from the Chandra aimpoint, where the 90% encircled energy fraction (EEF) radius (for 4.5 keV photons) is as determined from the Chandra PSF Viewer111http://cxc.harvard.edu/cgi-bin/prop_viewer/build_viewer.cgi?psf. From previous radio detections, the 4U 1630–47 position is known to subarcsecond accuracy (Hjellming et al., 1999), and we find only one photon (with an energy of 1.48 keV) within of that position during the 19,260 s Chandra observation. The prediction for the number of 0.5–8 keV background counts in the same region is 0.57 counts. Thus, using Poisson statistics, the upper limit on the count rate is s-1. Assuming that the spectrum has a power-law shape with cm-2 and (Plotkin, Gallo & Jonker, 2013; Reynolds et al., 2014), the upper limits on the absorbed and unabsorbed 0.5–8 keV fluxes are erg cm-2 s-1 and erg cm-2 s-1.

4. Discussion
Due to its location in a crowded region of the Galactic plane, imaging X-ray observations are required to reliably follow the evolution and determine the properties of 4U 1630–47 at low luminosities. We have used Swift and Suzaku observations during the decay phase of the 2010 outburst and a Chandra observation in quiescence to provide new information about 4U 1630–47 at low luminosities. In the following, we discuss these findings in the order they were observed: the soft state, the transition to the hard state and subsequent evolution, the limits on a reflection component, and the limits on the quiescent luminosity.
4.1. A Soft State at Low Luminosities
During Swift observation #1, the spectrum of 4U 1630–47 was very soft, and it was likely dominated by thermal emission. Despite the low flux, the source had clearly not made a transition to the hard state, which is notable because black hole transients typically make a transition to the hard state during outburst decay at luminosities between 0.3% and 3% of the Eddington limit (Maccarone, 2003; Kalemci et al., 2013). For 4U 1630–47, the unabsorbed 2–10 keV flux was erg cm-2 s-1 during this observation. The conversion to an Eddington-scaled luminosity depends on the distance to the system, the mass of the black hole, and a bolometric correction. We follow previous work (e.g., Parmar, Stella & White, 1986) by assuming a distance of 10 kpc, giving a 2–10 keV luminosity of erg s-1. Although the distance is somewhat uncertain, Augusteijn, Kuulkers & van Kerkwijk (2001) argue that it is less than 11 kpc since there is a Giant Molecular Cloud (GMC) at this distance (Corbel et al., 1999) in the direction of 4U 1630–47. The measured column density for 4U 1630–47 can be as low as cm-2, but would always be significantly larger if the source was behind the GMC (see Augusteijn, Kuulkers & van Kerkwijk, 2001, and references therein). The black hole mass has not been measured, and we use a fiducial value of 10 for this calculation, giving an Eddington luminosity of erg s-1, where is the mass of the black hole in units of 10. Thus, in the 2–10 keV band, the Eddington-scaled luminosity is 0.008 %.
With the limited bandpass of XRT, making the bolometric correction is not straightforward. While it might be reasonable to extrapolate the steep () power-law to 10 keV, extrapolating to lower energies is not consistent with the fact that the origin of the soft X-ray emission is likely thermal. In Section 3, we fit the observation #1 spectrum with a disk-blackbody plus power-law model, and here, we use those best fit parameters for the extrapolation. With that model, we found cm-2, keV, , , and an unabsorbed 2–10 keV flux for the power-law component of erg cm-2 s-1. In the 0.5–200 keV band, the unabsorbed flux is erg cm-2 s-1, corresponding to %. Thus, this detection of a soft state occurred at a luminosity that is at least an order of magnitude lower than the level where a transition to the hard state would be expected.
As a consistency check on the 4U 1630–47 distance and black hole mass, we consider the highest fluxes seen from this source, which were 0.84 Crab (1.5–12 keV) during the 2002–2004 outburst (Tomsick et al., 2005) and 1.4 Crab (3–6 keV) in 1977 (Chen, Shrader & Livio, 1997). From the 2002–2004 outburst, the highest broadband (3–200 keV) flux quoted was erg cm-2 s-1, and considering the bolometric correction and the brighter 1977 outburst, the maximum flux from 4U 1630–47 is at least erg cm-2 s-1. For a distance of 10 kpc, this flux corresponds to %, and would occur at a distance of 14 kpc. Although this limit is less constraining than the 11 kpc discussed above, this provides a second line of evidence that the distance could not be very much more than the 10 kpc that we have assumed (unless the 4U 1630–47 black hole is more massive than other systems). While we note that the distance could be less than 10 kpc if a significant fraction of the column density is local to the source, a lower distance would make the luminosity when we observe the soft state even lower and more unusual.
There are other cases of soft states at low luminosities, but the best known examples are not at a level as low as we are seeing for 4U 1630–47. In the detailed study of several black hole systems by Kalemci et al. (2013), the lowest luminosity soft state was seen at 0.3% for XTE J1720–330. 1E 1740.7–2942 and GRS 1758–258 both showed unusual behavior by making a transition to a true thermal-dominant state (i.e., the spectra required a thermal disk component) after a drop in luminosity. However, in both of these cases, the thermal-dominant state was seen at 1–2% (Smith et al., 2001; del Santo et al., 2005). Even so, this might provide an interesting comparison to 4U 1630–47 since this low-soft state has been called a “dynamical” soft state (Smith, Dawson & Swank, 2007) based on the two-flow picture and the idea that there is some level of independence between the optically thick flow and the sub-Keplerian flow (Chakrabarti & Titarchuk, 1995).
If the luminosity threshold for the transition to the hard state is set by the magnetic field and viscosity in the disk (Petrucci et al., 2008; Begelman & Armitage, 2014), then the interpretation for a low-soft state would be a weaker than usual large-scale magnetic field in the disk. In the Petrucci et al. (2008) picture, the hard state jet-emitting disk is established when the disk magnetization, , which is related to the disk magnetic field as well as the total pressure (gas plus radiation) in the disk, reaches a specific threshold level (called in Petrucci et al., 2008). Thus, a delayed transition to the hard state would be predicted if starts at a lower value or if it rises slowly. As the rise of is primarily due to a drop in mass accretion rate, which we assume occurs during the decay of all outbursts, it is more likely that starts at a lower value.
As discussed in Petrucci et al. (2008) and shown in Begelman & Armitage (2014), a low magnetic field leads to a lower viscosity parameter, and a lower transition luminosity would be predicted, which is consistent with what we see in 4U 1630–47. If the magnetic field was lower than typical during the entire outburst, then this might also explain why we never observed a bright hard state (see Appendix) and also why radio emission was not reported during the 2010 outburst or during the other outburst (2002–2004) which had very similar evolution in the hardness intensity diagram.
4.2. Evolution in the Hard State
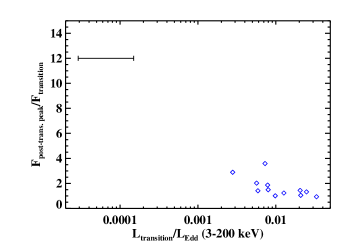
When the transition to the hard state did finally occur, there was a very dramatic increase in the 2–10 keV flux with an increase by at least a factor of 12 (see Figure 2 and Table 2). While increases in flux have been seen at the soft-to-hard state transition, they are more modest. For XTE J1650–500, the flux increased by a factor of 3–4 in the 3–20 keV band (Kalemci et al., 2003), and XTE J1752–223 showed an increase by a factor of 3.5 in the 3–25 keV band (Chun et al., 2013). Figure 6 shows the increase as a ratio of the peak X-ray flux after the transition to the flux prior to the transition () as a function of the Eddington fraction prior to the transition () for 4U 1630–47 compared to the other black hole transient outbursts studied by Kalemci et al. (2013). The values shown in Figure 6 are for the 3–200 keV band, which is the bandpass used in the Kalemci et al. (2013) analysis.
We suspect that there is a connection between the low luminosity soft state and this unusually large increase in the hard state. One piece of support for this is that, in the hard state, the flux reached a high enough level to be at a typical level for a soft-to-hard state transition. Based on the observation #2 spectrum, and extrapolating the power-law to higher energies (i.e., making the bolometric correction), we find that the 0.5–200 keV unabsorbed flux is erg cm-2 s-1, which corresponds to 0.7 %. In other words, if this hard state flare had happened 50 d earlier, we would not have seen the low luminosity soft state, nor the large increase in flux at the state transition, and the evolution would have appeared to be typical. Although this effect has not been seen to such a large level in other sources, Figure 6 suggests that the outbursts with the lowest luminosity transitions may tend to have larger flux increases.
We also obtained a very good measurement of the decay in the hard state (see Figure 5), and it is simply an exponential with an e-folding time of d. This number is much shorter than previous e-folding decay times measured for 4U 1630–47. During the 1996, 1998, and 1999 outbursts, the decay time scales for the 1.5–12 keV light curve were between 12 and 15 d (Kuulkers et al., 1997; Tomsick & Kaaret, 2000; Abraham et al., 2001). However, an important difference is that the measurements made in the 1990s were for the part of the outburst when the source was still in the soft state. Within the two-flow picture, this suggests the possibility that the different e-folding times are related to different viscous time scales for the two flows. The short time scale could also be related to the fact that the transition occurred at a very low mass accretion rate so that the amount of material in the hard X-ray emitting region was more quickly depleted.
4.3. Limits on a Reflection Component
A main goal of the Suzaku observation was to place constraints on the reflection component, which depends on the geometry of the accretion disk and the hard X-ray source. With XIS, the main constraint comes from a measurement of the strength of the iron line. During the brighter phases of outbursts, the Fe K region of the 4U 1630–47 spectrum is complex, showing many different types of absorption and emission lines. The absorption lines that have been detected are narrow (Kubota et al., 2007) and are caused by material in a disk wind (King et al., 2014) or the accretion disk atmosphere (Różańska et al., 2014) or both. Emission lines have also been detected with relatively narrow features possibly originating in the jets (Cui, Chen & Zhang 2000; Díaz Trigo et al. 2013; but also see Neilsen et al. 2014) and a broad line that is related to the reflection component (King et al., 2014). While it is clear that lines are detected in the bright parts of the outburst, the question of whether there are iron features in the hard state is still open. Although a line was very clearly detected in the hard state at the end of the 1998 outburst by RXTE (Tomsick & Kaaret, 2000), INTEGRAL imaging of the region found nearby sources (Tomsick et al., 2005) that could have at least contributed to this line.
An emission line from a reflection component was seen in GX 339–4 in the hard state at a low luminosity of 0.14% , and the narrow width and decreasing strength of the line (Tomsick et al., 2009) clearly shows a change in the system geometry compared to the broad line seen when the source was bright (Miller et al., 2008). Tomsick et al. (2009) interpreted this as truncation of the inner accretion disk, but Dauser et al. (2013) point out that this could also be due to a change in the geometry of the hard X-ray source with one possible scenario being that this emission comes from the jet. For 4U 1630–47, our main result is an upper limit on the equivalent width of a narrow line at 6.4 keV of eV. This limit is lower than the measured of the line in GX 339–4, which was eV. The low is consistent with 4U 1630–47 showing a continuation of the evolution seen for GX 339–4 with the disk becoming even more truncated or with the hard X-ray source moving even farther away from the disk (perhaps along the jet) as the luminosity drops. The 1-100 keV Eddington-scaled luminosity of 4U 1630–47 during the Suzaku observation was 0.03 %, which is about five times lower than for GX 339–4. While we cannot rule out the possibility of a broad line, even that limit ( eV) is lower than the limit of 180 eV suggested by Miller (2007) as being a “significant non-detection” in the sense that a line from a disk that extends to the innermost stable circular orbit is predicted to have a line with an near 180 eV.
4.4. New Limit on Quiescent Luminosity
There has been significant interest in the quiescent luminosities of stellar mass black holes and the comparison to neutron stars (Menou et al., 1999; Garcia et al., 2001). The typically lower black hole luminosities have been taken as evidence for the existence of a black hole event horizons as accretion energy can be advected across an event horizon but not through a neutron star surface (e.g., Narayan, Garcia & McClintock, 1997); although, there may be other possibilities for where the accretion energy goes, such as into the jet (Fender, Gallo & Jonker, 2003). Thus, it is somewhat surprising that a source as well-studied as 4U 1630–47 does not have a sensitive measurement of the quiescent flux. Assuming a distance of 10 kpc, the lowest previously reported luminosity came from a ROSAT measurement in the 0.2–2.4 keV band that was made in 1992 (Parmar, Angelini & White, 1995), and the value was erg s-1 (Parmar et al., 1997). Given the high column density of 4U 1630–47 and the very soft ROSAT bandpass, this limit is highly dependent on the spectral shape assumed. Our 0.5–8 keV unabsorbed flux limit from Chandra corresponds to a luminosity of erg s-1. With the lower value and the wider bandpass, this limit is significantly more constraining than the previous limit.
A value of erg s-1 would be the third brightest quiescent black hole out of 15 black hole systems with reported measurements (Narayan & McClintock, 2008; Reynolds & Miller, 2011). The luminosity level that divides neutron stars and black holes depends on the orbital period of the binary since the quiescent mass accretion rate is expected to be correlated with orbital period. The limit we measure for 4U 1630–47 would fall in the black hole region for orbital periods higher than 20 hr. Although the orbital period is not known for 4U 1630–47, a period near 20 hr would not be surprising. In the future, if the orbital period is found to be lower, this would motivate deeper quiescent X-ray observations to try to obtain a measurement of the quiescent luminosity.
5. Conclusions
X-ray observations of 4U 1630–47 at the end of its 2010 outburst show that the source decayed to a much lower luminosity than is typical before making a transition to the hard state. About two weeks before the transition to the hard state, the source had a soft and likely thermal X-ray spectrum and the 0.5–200 keV luminosity was erg s-1 (assuming a distance of 10 kpc). This corresponds to %, which is at least an order of magnitude lower than typical transition luminosities. We discuss this evolution in terms of theoretical models for hysteresis of black hole state transitions, and based on work by Petrucci et al. (2008) and Begelman & Armitage (2014), we suggest that the behavior could be explained by a lower than typical large-scale magnetic field in the accretion disk. We also consider the two-flow model of Chakrabarti & Titarchuk (1995) as the evolution may suggest decoupling between the optically thick Keplerian disk and the sub-Keplerian flow.
Any conclusion about hysteresis also needs to consider the geometry of the system, including the location of the inner radius of the optically thick disk and whether there is significant X-ray emission from the jet in the hard state. With Suzaku, we have placed tight limits on the presence of a reflection component from 4U 1630–47 in the hard state at %, and the lack of a reflection component is consistent with a large inner radius. More detailed theoretical work is required to determine whether a non-detection of reflection is consistent with a small inner radius and an increased height for the hard X-ray source above the disk. Finally, we report a significantly lower upper limit on the quiescent X-ray luminosity, which is interesting to compare to the other measurements of quiescent luminosities of neutron star and black hole transients.
References
- Abe et al. (2005) Abe, Y., Fukazawa, Y., Kubota, A., Kasama, D., & Makishima, K., 2005, PASJ, 57, 629
- Abraham et al. (2001) Abraham, L., Agrawal, V., Sreekumar, P., & Seetha, S., 2001, Bulletin of the Astronomical Society of India, 29, 365
- Arnaud (1996) Arnaud, K. A., 1996, in Astronomical Data Analysis Software and Systems V, ed. G. H. Jacoby, J. Barnes, Vol. 101, 17
- Augusteijn, Kuulkers & van Kerkwijk (2001) Augusteijn, T., Kuulkers, E., & van Kerkwijk, M. H., 2001, A&A, 375, 447
- Balbus & Hawley (1991) Balbus, S. A., & Hawley, J. F., 1991, ApJ, 376, 214
- Begelman & Armitage (2014) Begelman, M. C., & Armitage, P. J., 2014, ApJ, 782, L18
- Belloni et al. (2005) Belloni, T., Homan, J., Casella, P., van der Klis, M., Nespoli, E., Lewin, W. H. G., Miller, J. M., & Méndez, M., 2005, A&A, 440, 207
- Bradt, Rothschild & Swank (1993) Bradt, H. V., Rothschild, R. E., & Swank, J. H., 1993, A&AS, 97, 355
- Burrows et al. (2005) Burrows, D. N., et al., 2005, Space Science Reviews, 120, 165
- Cash (1979) Cash, W., 1979, ApJ, 228, 939
- Chakrabarti & Titarchuk (1995) Chakrabarti, S., & Titarchuk, L. G., 1995, ApJ, 455, 623
- Chen, Shrader & Livio (1997) Chen, W., Shrader, C. R., & Livio, M., 1997, ApJ, 491, 312
- Chun et al. (2013) Chun, Y. Y., et al., 2013, ApJ, 770, 10
- Corbel et al. (1999) Corbel, S., Chapuis, C., Dame, T. M., & Durouchoux, P., 1999, ApJ, 526, L29
- Corbel & Fender (2002) Corbel, S., & Fender, R. P., 2002, ApJ, 573, L35
- Corbel et al. (2004) Corbel, S., Fender, R. P., Tomsick, J. A., Tzioumis, A. K., & Tingay, S., 2004, ApJ, 617, 1272
- Corbel et al. (2000) Corbel, S., Fender, R. P., Tzioumis, A. K., Nowak, M., McIntyre, V., Durouchoux, P., & Sood, R., 2000, A&A, 359, 251
- Cui, Chen & Zhang (2000) Cui, W., Chen, W., & Zhang, S. N., 2000, ApJ, 529, 952
- Dauser et al. (2013) Dauser, T., Garcia, J., Wilms, J., Böck, M., Brenneman, L. W., Falanga, M., Fukumura, K., & Reynolds, C. S., 2013, MNRAS, 430, 1694
- Debnath, Chakrabarti & Nandi (2013) Debnath, D., Chakrabarti, S. K., & Nandi, A., 2013, Advances in Space Research, 52, 2143
- del Santo et al. (2005) del Santo, M., et al., 2005, A&A, 433, 613
- Díaz Trigo et al. (2013) Díaz Trigo, M., Miller-Jones, J. C. A., Migliari, S., Broderick, J. W., & Tzioumis, T., 2013, Nature, 504, 260
- Dieters et al. (2000) Dieters, S. W., et al., 2000, ApJ, 538, 307
- Dunn et al. (2010) Dunn, R. J. H., Fender, R. P., Körding, E. G., Belloni, T., & Cabanac, C., 2010, MNRAS, 403, 61
- Esin, McClintock & Narayan (1997) Esin, A. A., McClintock, J. E., & Narayan, R., 1997, ApJ, 489, 865
- Fabian et al. (1989) Fabian, A. C., Rees, M. J., Stella, L., & White, N. E., 1989, MNRAS, 238, 729
- Fender et al. (1999) Fender, R., et al., 1999, ApJ, 519, L165
- Fender (2001) Fender, R. P., 2001, MNRAS, 322, 31
- Fender, Belloni & Gallo (2004) Fender, R. P., Belloni, T. M., & Gallo, E., 2004, MNRAS, 355, 1105
- Fender, Gallo & Jonker (2003) Fender, R. P., Gallo, E., & Jonker, P. G., 2003, MNRAS, 343, L99
- Fender, Homan & Belloni (2009) Fender, R. P., Homan, J., & Belloni, T. M., 2009, MNRAS, 396, 1370
- Garcia et al. (2001) Garcia, M. R., McClintock, J. E., Narayan, R., Callanan, P., Barret, D., & Murray, S. S., 2001, ApJ, 553, L47
- Garmire et al. (2003) Garmire, G. P., Bautz, M. W., Ford, P. G., Nousek, J. A., & Ricker, G. R., 2003, in X-Ray and Gamma-Ray Telescopes and Instruments for Astronomy. Edited by Joachim E. Truemper, Harvey D. Tananbaum. Proceedings of the SPIE, 4851, 28
- Hannikainen et al. (2002) Hannikainen, D., Sault, B., Kuulkers, E., Wu, K., Jones, P., & Hunstead, R., 2002, The Astronomer’s Telegram, 108
- Hjellming et al. (1999) Hjellming, R. M., et al., 1999, ApJ, 514, 383
- Homan & Belloni (2005) Homan, J., & Belloni, T., 2005, Ap&SS, 300, 107
- Kalemci et al. (2013) Kalemci, E., Dinçer, T., Tomsick, J. A., Buxton, M. M., Bailyn, C. D., & Chun, Y. Y., 2013, ApJ, 779, 95
- Kalemci et al. (2003) Kalemci, E., Tomsick, J. A., Rothschild, R. E., Pottschmidt, K., Corbel, S., Wijnands, R., Miller, J. M., & Kaaret, P., 2003, ApJ, 586, 419
- King et al. (2014) King, A. L., et al., 2014, ApJ, 784, L2
- Koyama et al. (2007) Koyama, K., et al., 2007, PASJ, 59, 23
- Kubota et al. (2007) Kubota, A., et al., 2007, PASJ, 59, 185
- Kuulkers et al. (1997) Kuulkers, E., Parmar, A. N., Kitamoto, S., Cominsky, L. R., & Sood, R. K., 1997, MNRAS, 291, 81
- Laor (1991) Laor, A., 1991, ApJ, 376, 90
- Lightman & White (1988) Lightman, A. P., & White, T. R., 1988, ApJ, 335, 57
- Liu, Meyer & Meyer-Hofmeister (2005) Liu, B. F., Meyer, F., & Meyer-Hofmeister, E., 2005, A&A, 442, 555
- Maccarone (2003) Maccarone, T. J., 2003, A&A, 409, 697
- McClintock & Remillard (2006) McClintock, J. E., & Remillard, R. A., 2006, Black hole binaries, Compact stellar X-ray sources. Edited by Walter Lewin & Michiel van der Klis: Cambridge University Press, 157–213
- McClintock et al. (2006) McClintock, J. E., Shafee, R., Narayan, R., Remillard, R. A., Davis, S. W., & Li, L.-X., 2006, ApJ, 652, 518
- Menou et al. (1999) Menou, K., Esin, A. A., Narayan, R., Garcia, M. R., Lasota, J., & McClintock, J. E., 1999, ApJ, 520, 276
- Meyer-Hofmeister, Liu & Meyer (2005) Meyer-Hofmeister, E., Liu, B. F., & Meyer, F., 2005, A&A, 432, 181
- Miller (2007) Miller, J. M., 2007, ARA&A, 45, 441
- Miller et al. (2008) Miller, J. M., et al., 2008, ApJ, 679, L113
- Mitsuda et al. (1984) Mitsuda, K., et al., 1984, PASJ, 36, 741
- Narayan, Garcia & McClintock (1997) Narayan, R., Garcia, M. R., & McClintock, J. E., 1997, ApJ, 478, L79
- Narayan & McClintock (2008) Narayan, R., & McClintock, J. E., 2008, New Astronomy Review, 51, 733
- Neilsen et al. (2014) Neilsen, J., Coriat, M., Fender, R., Lee, J. C., Ponti, G., Tzioumis, A. K., Edwards, P. G., & Broderick, J. W., 2014, ApJ, 784, L5
- Parmar, Angelini & White (1995) Parmar, A. N., Angelini, L., & White, N. E., 1995, ApJ, 452, L129
- Parmar, Stella & White (1986) Parmar, A. N., Stella, L., & White, N. E., 1986, ApJ, 304, 664
- Parmar et al. (1997) Parmar, A. N., Williams, O. R., Kuulkers, E., Angelini, L., & White, N. E., 1997, A&A, 319, 855
- Petrucci et al. (2008) Petrucci, P.-O., Ferreira, J., Henri, G., & Pelletier, G., 2008, MNRAS, 385, L88
- Plotkin, Gallo & Jonker (2013) Plotkin, R. M., Gallo, E., & Jonker, P. G., 2013, ApJ, 773, 59
- Reynolds & Miller (2011) Reynolds, M. T., & Miller, J. M., 2011, ApJ, 734, L17
- Reynolds et al. (2014) Reynolds, M. T., Reis, R. C., Miller, J. M., Cackett, E. M., & Degenaar, N., 2014, MNRAS, 441, 3656
- Ross & Fabian (2005) Ross, R. R., & Fabian, A. C., 2005, MNRAS, 358, 211
- Różańska et al. (2014) Różańska, A., Madej, J., Bagińska, P., Hryniewicz, K., & Handzlik, B., 2014, A&A, 562, A81
- Russell et al. (2013) Russell, D. M., et al., 2013, MNRAS, 429, 815
- Russell et al. (2011) Russell, D. M., Miller-Jones, J. C. A., Maccarone, T. J., Yang, Y. J., Fender, R. P., & Lewis, F., 2011, ApJ, 739, L19
- Smith, Dawson & Swank (2007) Smith, D. M., Dawson, D. M., & Swank, J. H., 2007, ApJ, 669, 1138
- Smith et al. (2001) Smith, D. M., Heindl, W. A., Markwardt, C. B., & Swank, J. H., 2001, ApJ, 554, L41
- Tomsick et al. (2005) Tomsick, J. A., Corbel, S., Goldwurm, A., & Kaaret, P., 2005, ApJ, 630, 413
- Tomsick & Kaaret (2000) Tomsick, J. A., & Kaaret, P., 2000, ApJ, 537, 448
- Tomsick & Yamaoka (2010) Tomsick, J. A., & Yamaoka, K., 2010, The Astronomer’s Telegram, 2794
- Tomsick et al. (2009) Tomsick, J. A., Yamaoka, K., Corbel, S., Kaaret, P., Kalemci, E., & Migliari, S., 2009, ApJ, 707, L87
- Verner et al. (1996) Verner, D. A., Ferland, G. J., Korista, K. T., & Yakovlev, D. G., 1996, ApJ, 465, 487
- Wilms, Allen & McCray (2000) Wilms, J., Allen, A., & McCray, R., 2000, ApJ, 542, 914
| Satellite | Observation | ObsID | Start Time | End Time | Exposure Time |
|---|---|---|---|---|---|
| Number | (UT) | (UT) | (s) | ||
| Swift | 1 | 00031224006 | 2010 Jul 15, 12.91 h | 2010 Jun 15, 16.59 h | 4,617 |
| ” | 2 | 00031224007 | 2010 Aug 17, 1.90 h | 2010 Aug 17, 2.09 h | 690 |
| ” | 3 | 00031224008 | 2010 Aug 19, 16.21 h | 2010 Aug 19, 16.54 h | 1,149 |
| ” | 4 | 00031224009 | 2010 Aug 22, 0.46 h | 2010 Aug 22, 3.96 h | 1,348 |
| Suzaku | 5 | 405051010 | 2010 Aug 24, 21.88 h | 2010 Aug 27, 14.72 h | 99,940 |
| Chandra | – | 12530 | 2011 Jun 16, 12.53 h | 2011 Jun 16, 18.15 h | 19,260 |
| ” | – | 12533 | 2011 Jun 17, 5.55 h | 2011 Jun 17, 11.26 h | 19,503 |
| Observation | 222To calculate the column density, we use Wilms, Allen & McCray (2000) abundances and Verner et al. (1996) cross-sections. | Flux333Unabsorbed 2–10 keV flux in units of erg cm-2 s-1. | /dof | |
|---|---|---|---|---|
| Number | ( cm-2) | |||
| 1 | 444Throughout this table, we quote 90% confidence errors. | 0.57/12 | ||
| 2 | 1.26/34 | |||
| 3 | 1.07/34 | |||
| 4 | 1.18/34 | |||
| 5555For Suzaku, we left the overall normalization of XIS1 relative to XIS0/3 as a free parameter, and we obtain a value of . | 0.99/185 |
| Swift | ObsID of | RXTE | Duration | Predicted | Actual |
|---|---|---|---|---|---|
| Observation | Closest RXTE | Start Time | Between | PCA Rate666The count rate prediction for one PCU based on the absorbed power-law model measured by Swift. The values in parentheses are the predicted rates, including the exponential decay of 4U 1630–47. | PCA Rate |
| Number | Observation | (UT) | Start Times | (3-25 keV) | (3-25 keV) |
| 1 | 95702-03-14-03 | 2010 July 15, 20.1 h | 7.2 h | 0.23 c/s | 10.3 c/s |
| 2 | 95702-03-21-01 | 2010 Aug 17, 3.1 h | 1.2 h | 11.6 (11.4) c/s | 23.5 c/s |
| 3 | 95702-03-22-00 | 2010 Aug 20, 18.0 h | 25.8 h | 6.8 (5.0) c/s | 17.5 c/s |
| 4 | 95702-03-22-01 | 2010 Aug 23, 3.3 h | 26.8 h | 2.8 (2.0) c/s | 17.6 c/s |